 Open Access Article
Creative Commons Attribution 3.0 Unported Licence
Phosphotungstic acid catalysed bioethylene synthesis under industrially relevant conditions
Cristina
Peinado
 *,
José M.
Campos-Martin
 and
Sergio
Rojas

Grupo de Energía y Química Sostenibles, Instituto de Catálisis y Petroleoquímica, CSIC, C/ Marie Curie 2, 28049, Madrid, Spain. E-mail: cristina.peinado@csic.es
First published on 12th December 2022
Abstract
Among the different routes of ethylene production, the most plausible way to obtain it from renewable sources nowadays is the dehydration of bioethanol, which can be obtained from biomass or municipal waste. The dehydration of ethanol to ethylene over heteropoly acid catalysts can be advantageous in comparison to other acid catalysts such as zeolites or γ-Al2O3 due to the lower temperature at which the former ones work. This paper studies a trilobe-shaped phosphotungstic acid-based catalyst synthesized by impregnation to be used in the dehydration of ethanol. The catalyst has shown outstanding activity, reaching equilibrium conversion of ethanol under different reaction conditions. In order to assess the catalyst potential for industrial application, relevant conditions were considered, such as the absence of N2 in the feed or the performance of the material at long times of reaction (>250 h). The selectivity towards ethylene was maximized by the optimization of the conditions, and the catalyst has shown good activity for bio-ethylene production (equilibrium ethanol conversion and selectivity towards ethylene >90%) different from a real 1st generation bioethanol.
Introduction
Ethylene is the largest bulk chemical in volume, used for a variety of production processes including polyethylene, ethylene oxide, ethylene dichloride or styrene.1 Its demand reached 150 Mt in 2017 and is expected to exceed 200 Mt by 2025.2 Currently, ethylene is almost exclusively obtained from petroleum-based feedstocks, mainly through steam cracking of hydrocarbons, mainly ethane and naphtha, but also LPG.1,3,4 In this process, which is used for the production of both ethylene and propylene, the hydrocarbons mixed with steam are heated between 500 and 680 °C and then fed to a reactor at temperatures ranging from 500 to 875 °C, with residence times between 0.5 and 1 s, depending on the desired product. Higher severity in the process conditions leads to preferential formation of ethylene, whereas lower severity produces more propylene and other by-products.1,5 The chemical processes involved in the conversion of hydrocarbons into olefins through steam cracking is very endothermic, up to the point that this process is one of the most energy-consuming processes in the chemical and petrochemical industries,6,7 hence imposing important economic and environmental drawbacks.1,4 Attention to volatile fossil fuel prices and society’s awareness of the negative impact of greenhouse gas (GHG) emissions, noting that CO2 emissions associated with the production of ethylene from fossil fuels account to 1 to 1.6 tons per ton of ethylene,1 have now shifted to developing novel technologies for the production of ethylene, preferentially from carbon-decoupled feedstocks.An alternative feedstock for ethylene production is methane, which can be transformed into olefins by different processes. Two main direct routes that have been studied for decades are the oxidative and the non-oxidative coupling of methane (OCM and NCM), which take place at high temperatures, 750 and 1000 °C, respectively.8,9 The first one has been considered through several approaches, including co-feeding of O2, chemical coupling and membrane technologies. For the NCM, technologies under development include thermal pyrolysis, catalytic NCM, which can be coupled with H2-permeable membranes, and plasma. Electrochemical approaches of both routes, oxidative and non-oxidative, have also been studied.3,10 Indirect routes involve methane reforming into syngas,10 from which ethylene can be obtained either directly by means of the so-called Fischer–Tropsch to olefins (FTO) process,5 or via methanol or dimethyl ether (DME) through the methanol to olefins (MTO) or the DME to olefins (DTO) processes, respectively.5,10 These processes occur at temperatures between 300 and 540 °C, depending on the used catalysts.11–13 While some of the methanol-related routes are more mature or even commercially available, as in the case of MTO,14 coupling of methane technologies need to be further developed in order to be a real alternative to the steam cracking process.10 An issue to be addressed in the MTO process is the fact that the feedstock for this process is currently coal or natural gas-derived. The syngas origin should be shifted to renewable sources such as biomass in order for the MTO to be a sustainable alternative to produce ethylene.13
Ethane, as such, is not technically a new feedstock for the production of ethylene, but, although its use for steam cracking has recently gained interest in North America and Middle East,14 partly as a consequence of its enhanced availability from shale gas,3 some other new ethane to ethylene routes are under study. These include the thermochemical oxidative dehydrogenation of ethane (ODH), which can be performed in the presence of either O2 or CO2. The process in the presence of O2 has been more extensively studied, and, similarly to the coupling of methane, chemical looping, membrane and electrochemical approaches have been explored.3 The use of naphtha for ethylene production in processes other than steam cracking has also been studied, with the aim to address the energy efficiency limitations of the traditional process. These processes are based on the use of a catalyst to reduce the operating temperature, and, again, the combination with chemical looping strategies has been studied.3,15,16
Alternatively, like other reactions of alcohol dehydration to olefins, the production of ethylene using ethanol as a feedstock has gained attention lately, as deduced from the swift increase in the bibliography on these topics.17–19 Although the first known ethanol to ethylene plant dates from 1913,20 nowadays, this process can benefit from the readily available technology to produce bioethanol from renewable sources, including lignocellulosic biomass or urban waste.21,22 This approach is actually being implemented at the industrial level by several companies, Braskem, Dow and Toyota, totalling a total capacity of almost 400 kilotonnes per year in 2016.17 The main unitary operation of this process is the catalytic ethanol dehydration reaction, which takes place in the gas phase over a solid acid material, including Al2O3–MgO/SiO2 (Syndol), γ-Al2O3, or HZSM-5,17 at temperatures ranging from 320 to 500 °C,17,23–25 but originally it was carried out over solid phosphoric acid, used in the first plant in 1913.17 Other catalysts studied for the ethanol dehydration reaction are molecular sieve-based materials, such as HZSM-5 or SAPO-34,24,26 as well as heteropoly acids.17,24 Catalysts for this process must be tolerant to impurities contained in the bioethanol, which can include fusel alcohols, acetic acid or ethyl acetate, derived from the complex biochemical processes during sugar fermentation.27
Heteropoly acids (HPA) with the Keggin structure, such as phosphotungstic (HPW), silicotungstic (HSiW) or phosphomolybdic (HPMo) acids, and their salts, have been used as catalysts for alcohol dehydration reactions.28–31 Due to their high Brønsted acidity, HPAs are suitable catalysts for alcohol dehydration reactions, including ethanol, producing a pool of compounds, mostly ethers and olefins, in which the final product distribution will depend on the reaction conditions and the actual nature of the HPA. For instance, silica-supported HPW provided ethanol conversion and ethylene selectivity above 90% at 160 °C, while the silica-supported Cs salt of HPW needed a higher temperature, i.e., 190 °C, to reach similar values of conversion and selectivity.32 Several studies have reported the good activity of HPW-based catalysts, with very high selectivity towards ethylene,33–36 some of them at temperatures as low as 200 °C.37 Nonetheless, few data regarding the demonstration of their applicability under relevant industrial conditions can be found in the literature, although they are known to be used in Technip Energies' Hummingbird production technology.38 For instance, all of the studies above were performed with a feed consisting of alcohol strongly diluted in an inert gas (N2, He, Ar…). Since the catalytic performance of HPA is strongly affected by the composition of the feed, studies using a concentrated stream of ethanol must be carried out in order to assess the upscaling of this reacting system.
In this study, a silica-supported HPW catalyst has been synthesised by impregnation, and their composition, structure, texture have been investigated by inductively coupled plasma-optical emission spectroscopy (ICP-OES), X-ray diffraction (XRD), N2 adsorption–desorption and diffuse reflectance infrared Fourier transform spectroscopy (DRIFTS). The activity of this catalyst for the ethanol dehydration reaction has been studied under different conditions of pressure, temperature and space velocity, as well as varying the concentration of ethanol in the feed. Finally, a real 1st generation bioethanol obtained from VERTEX Bioenergy has been used as a reactant in order to assess the effect of the impurities contained in the bioethanol in the catalytic performance.
Experimental section
Phosphotungstic acid hydrate (H3[P(W3O10)4]·nH2O; HPW, Merck) and silica trilobes (Tlb) of 1.5 mm diameter (Saint-Gobain) were used for the preparation of HPW/Tlb. The amounts of HPW and Tlb were chosen to satisfy a surface density of HPW of 4.5 Keggin units per nm2 of support. This HPA loading has been reported to be the optimum one for alcohol dehydration over TiO2-supported HPA catalysts.29 After impregnation, the obtained material was kept overnight at ambient temperature, and then it was dried at 60 °C for 24 h. Potentially produced fines were removed by sieving.The catalyst composition was measured by ICP-OES on a spectrometer ICP-OES PlasmaQuantÆ PQ 9000 (Analytik Jena) after adequate digestion of the sample.
N2 adsorption–desorption isotherms were collected using an equipment ASAP 2020 (Micromeritics), after degasification on a VacPrep 061 LB (Micromeritics). The specific surface area of the catalyst was calculated through the BET method. The average pore size was obtained with the BJH model applied to the desorption branch.
XRD analysis of the powdered HPW/Tlb was carried out on an X'Pert Pro PANalytical diffractometer with a configuration θ–θ, equipped with an Anton Paar XRK900 reactor chamber that allows the collection of diffractograms under a controlled atmosphere at different temperatures.
DRIFTS experiments were performed on an FT/IR-6300 (JASCO) with a DRIFTS cell in which the sample in powdered form can be heated and under different atmospheres. Infrared spectra were collected in the presence of either ethanol or pyridine. Typically, a flow of inert gas (He or Ar) was bubbled through liquid ethanol or pyridine before it was driven to the cell. Measurements with adsorbed ethanol were taken during an ethanol/He flow and after flushing physisorbed ethanol with He and at increasing temperatures to monitor the ethanol desorption. Measurements with pyridine were collected only after physisorbed pyridine was flushed. Prior to each experiment, the sample was treated in situ at 220 °C for 30 minutes under a flow of inert gas, and a spectrum of the clean sample was taken.
The activity of the HPW/Tlb catalyst was tested in a Microactivity Pro reactor, comprising a fixed-bed tubular reactor heated by an oven and placed in a hot box, where the temperature of both can be controlled independently. Nitrogen was fed using a mass-flow controller, ethanol was fed using a Gilson 307 HPLC pump, and the pressure was controlled with a pressure valve placed downstream of the reactor. The desired amount of HWP/Tlb catalyst (between 380 and 750 mg) was loaded to the reactor and diluted with trilobes in order to operate under isothermal conditions. Prior to the activity tests, the loaded catalyst was pre-treated in situ under a N2 flow at 220 °C (with a heating rate of 5 °C from room temperature) for 1 h. The temperature was then changed to the operating temperature, and the feed was changed to ethanol. The feed consisted of either a synthetic azeotropic mixture of ethanol (99.5%, Scharlab) and Milli-Q water, indicated in the captions as azeotropic mixture ethanol/water, or a purchased 1st generation bioethanol obtained from VERTEX Bioenergy, diluted with Milli-Q water up to the azeotropic composition, indicated in the captions as azeotropic mixture bioethanol/water. After that, the pressure was increased to the desired one, after which the reaction is considered to start.
The composition of the outlet stream of the reactor was analysed on a Varian CP-3800 gas chromatograph with a Carboxen-1000 packed column connected to a TCD. In all cases, ethylene and diethyl ether were the only reaction products detected. Ethanol conversion and ethylene selectivity were calculated from eqn (1) and (2), respectively.
 | (1) |
 | (2) |
Results
Characterization results
Table 1 shows the results of the ICP-OES, along with the theoretical value of HPW loading to meet the required surface density and the real value, BET area and average pore size of the HPW/Tlb catalyst and the support. As shown in Table 1, the HPW content in the catalyst is slightly lower than the theoretical one. This is because in the catalyst impregnation some powder rich in HPW is produced after the drying step, and it is removed from the final catalyst by sieving. The catalyst composition was very close to the intended one, with a deviation of less than 9%. Considering the results of the N2 adsorption–desorption isotherm analyses, it can be observed that the impregnation of HPW over the high-surface silica trilobes resulted in a catalyst with a specific surface area of 92 m2 g−1, a value ca. 10 times higher than that of bulk HPW (∼8 m2 g−1 (ref. 29 and 39)). Besides, no significant blockage of the pores of the support was observed, as the mean pore size of both the trilobes and HPW/Tlb is similar.| Sample | Theoretical HPW loading | Actual HPW loading (ICP-OES) | Surface area | Mean pore size |
|---|---|---|---|---|
| wt% | m2 g−1 | nm | ||
| Trilobes | — | — | 238 | 14 |
| HPW/Tlb | 83.7 | 76.2 | 92 | 15 |
The XRD patterns of HPW/Tlb treated at increasing temperatures in N2 are shown in Fig. 1. The diffractogram of HPW/Tlb at r.t. is shown in Fig. 1 which only displays the diffraction lines of the pure hexahydrated HPW (H3PW12O40·6H2O), indicating that the Keggin structure of HPW remains unaltered after impregnation on the support. By increasing the temperature to 150 °C or 220 °C a gradual removal of water of crystallization molecules, from 6 molecules at r.t., to 3 molecules at 150 °C and finally resulting in an anhydrous Keggin structure at 220 °C.
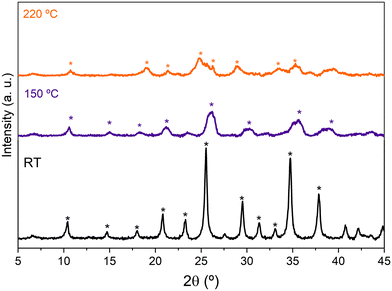 | ||
Fig. 1 X-ray diffractograms of HPW/Tlb recorded at r.t., 150 °C and 220 °C under N2. H3PW12O40·6H2O (*), H3PW12O40·3H2O ( ) and H3PW12O40 ( ) and H3PW12O40 ( ). ). | ||
Fig. 2 shows the DRIFTS spectra of Tlb, HPW, and HPW/Tlb obtained under different atmospheres. Fig. 2A shows the spectra collected at 140 °C of the support, bulk HPW and HPW/Tlb catalysts after pre-treatment at 220 °C under a He flow. These experiments were used to identify and assign the main bands of the samples. Fig. 2B and C show the spectra of HPW/Tlb under the same conditions as in Fig. 2A, during ethanol admission into the IR cell, after feeding ethanol for 30 min, and during desorption of ethanol at increasing temperatures under a He flow in two different regions.
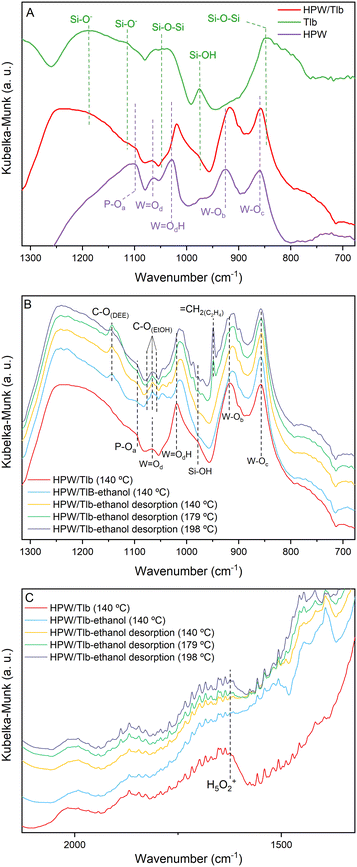 | ||
| Fig. 2 DRIFT spectra of the Tlb, bulk HPW and HPW/Tlb, after pre-treatment at 220 °C under a He flow (A) and during ethanol adsorption and desorption experiments at different temperatures (B and C). | ||
In Fig. 2, subscripts in the O symbol refer to the position of the oxygen atoms in the Keggin structure. The subscript a refers to the oxygen atoms in the tetrahedron, bounded to the P; b and c refer to the corner-sharing and the edge-sharing atoms, respectively; and d stands for the terminal position of the oxygen atom. The spectrum of HPW depicted in Fig. 2A shows the typical bands of the Keggin anion structure,40,41 namely the antisymmetric stretching of P–Oa (1099 cm−1), W![[double bond, length as m-dash]](https://www.rsc.org/images/entities/char_e001.gif) Od (1064 cm−1), W
Od (1064 cm−1), W![[double bond, length as m-dash]](https://www.rsc.org/images/entities/char_e001.gif) OdH (1028 cm−1), W–Ob (925 cm−1) and W–Oc (859 cm−1) bonds. The bands for P–Oa and W
OdH (1028 cm−1), W–Ob (925 cm−1) and W–Oc (859 cm−1) bonds. The bands for P–Oa and W![[double bond, length as m-dash]](https://www.rsc.org/images/entities/char_e001.gif) Od appear at the same position in the spectrum of the supported catalyst (HPW/Tlb). By contrast, the bands for W
Od appear at the same position in the spectrum of the supported catalyst (HPW/Tlb). By contrast, the bands for W![[double bond, length as m-dash]](https://www.rsc.org/images/entities/char_e001.gif) Oc and W–Ob species shift to lower frequencies in the spectrum of HPW/Tlb, appearing at 1018 and 915 cm−1, respectively. This shifting indicates a slight change in the structure of the Keggin anion after impregnation in the silica support, caused by bond weakening and loss of cohesion. The same effect has been observed with ceria and zirconia supported HPW.41,42 In addition, the spectrum of HPW/Tlb displays two broad bands at 1248 and 790 cm−1. These bands correspond to the Si–O− asymmetric stretching43 and Si–O–Si symmetric stretching vibrations.44,45 These bands are also visible in the spectrum of Tlb at 1187 and 848 cm−1. The weak band at 1114 cm−1 is ascribed to the Si–O− asymmetric stretching.43 Finally, the bands at ca. 1047 and 975 cm−1 are assigned to Si–O–Si bonding45 and silanol (Si–OH) groups,43,46,47 respectively.
Oc and W–Ob species shift to lower frequencies in the spectrum of HPW/Tlb, appearing at 1018 and 915 cm−1, respectively. This shifting indicates a slight change in the structure of the Keggin anion after impregnation in the silica support, caused by bond weakening and loss of cohesion. The same effect has been observed with ceria and zirconia supported HPW.41,42 In addition, the spectrum of HPW/Tlb displays two broad bands at 1248 and 790 cm−1. These bands correspond to the Si–O− asymmetric stretching43 and Si–O–Si symmetric stretching vibrations.44,45 These bands are also visible in the spectrum of Tlb at 1187 and 848 cm−1. The weak band at 1114 cm−1 is ascribed to the Si–O− asymmetric stretching.43 Finally, the bands at ca. 1047 and 975 cm−1 are assigned to Si–O–Si bonding45 and silanol (Si–OH) groups,43,46,47 respectively.
The spectra collected during ethanol adsorption show three bands centred at ca. 1065 cm−1, ascribed to the C–O stretching of ethoxy species formed due to ethanol adsorption48 according to the collected spectrum of ethanol fed to a KBr sample (not shown). These bands overlap with the band assigned to W![[double bond, length as m-dash]](https://www.rsc.org/images/entities/char_e001.gif) Od, and their intensity decreases with the increasing temperature, due to ethanol desorption, revealing again the band of the bond of HWP at 198 °C. Since the intensity of the bands for Si–OH at 978 cm−1 and the H5O2+ band at 1622 cm−1 decreases upon ethanol admission into the cell (see Fig. 2C), it is reasonable to assume that ethanol adsorbs on both silanol and HPW acid sites. This last feature has been previously observed in similar experiments when studying the dehydration of methanol on heteropoly acid catalysts,28 showing that the removal of water molecules from the Keggin structure in the presence of the reactant alcohol favours good activity for the dehydration reaction.
Od, and their intensity decreases with the increasing temperature, due to ethanol desorption, revealing again the band of the bond of HWP at 198 °C. Since the intensity of the bands for Si–OH at 978 cm−1 and the H5O2+ band at 1622 cm−1 decreases upon ethanol admission into the cell (see Fig. 2C), it is reasonable to assume that ethanol adsorbs on both silanol and HPW acid sites. This last feature has been previously observed in similar experiments when studying the dehydration of methanol on heteropoly acid catalysts,28 showing that the removal of water molecules from the Keggin structure in the presence of the reactant alcohol favours good activity for the dehydration reaction.
These spectra recorded during the desorption process display two bands at 1142 and 950 cm−1, ascribed to the C–O stretching band of diethyl ether (DEE) and to the bending of![[double bond, length as m-dash]](https://www.rsc.org/images/entities/char_e001.gif) CH2.48 As observed in Fig. 2B, DEE formation commences at lower temperatures than C2H4, in accordance with the thermodynamics of the reactions. In fact, the IR band for DEE is observed immediately upon ethanol admission into the cell at 150 °C being observed until 198 °C. The band for ethylene starts to be observed in the spectrum collected at 179 °C and its intensity increases with temperature until 198 °C. These results are consistent with the literature.33,36,37
CH2.48 As observed in Fig. 2B, DEE formation commences at lower temperatures than C2H4, in accordance with the thermodynamics of the reactions. In fact, the IR band for DEE is observed immediately upon ethanol admission into the cell at 150 °C being observed until 198 °C. The band for ethylene starts to be observed in the spectrum collected at 179 °C and its intensity increases with temperature until 198 °C. These results are consistent with the literature.33,36,37
An interesting fact observed in these experiments is the shifting of the bands ascribed to the W–Ob and W![[double bond, length as m-dash]](https://www.rsc.org/images/entities/char_e001.gif) OdH species as soon as ethanol is admitted to the cell. This observation suggests that ethanol adsorbs/absorbs into the Keggin structure as expected for the pseudo-liquid catalysis attributed to this kind of compounds. The shifting in the frequencies of these bands would indicate a modification of the structure as a consequence of the absorption of the alcohol. Similar observations have been reported before by other authors.49
OdH species as soon as ethanol is admitted to the cell. This observation suggests that ethanol adsorbs/absorbs into the Keggin structure as expected for the pseudo-liquid catalysis attributed to this kind of compounds. The shifting in the frequencies of these bands would indicate a modification of the structure as a consequence of the absorption of the alcohol. Similar observations have been reported before by other authors.49
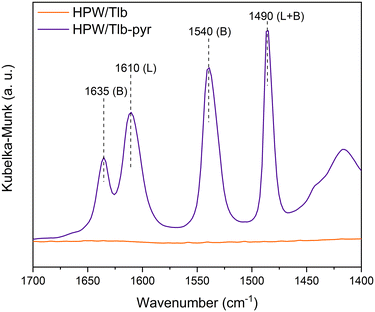
The nature of the acid sites of HPW/Tlb was examined from the analysis of the DRIFTS spectra collected after pyridine chemisorption, see Fig. 3.
As observed in Fig. 3, the HPW/Tlb catalyst presents both Brønsted and Lewis acid sites. Bands at 1635 and 1540 cm−1 are ascribed to the 8a and 19b vibrating modes of protonated pyridine chemisorbed onto Brønsted sites of the catalyst. These bands typically appear when chemisorbing pyridine on heteropoly acids due to the high concentration of mobile protons of H bonded water in the secondary structure of the Keggin anions.50 The observation of a band at 1610 cm−1 is characteristic of an intermediate Lewis acid, as it is ascribed to the 8a vibrational mode pyridine when adsorbed on these types of sites.51 These bands in similar catalysts have been reportedly associated with coordinative unsaturation of the central atom (in this case, W) or positively charged Si4+.50 The band at 1490 cm−1 is not assigned to a single site, instead it contains contributions of both Lewis and Brønsted sites.52,53
Catalytic activity results
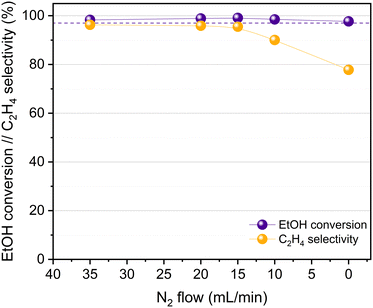
The catalytic activity of HPW/Tlb for the ethylene production was tested under industrially relevant conditions, i.e., 210 °C, 5 bar and a LHSV of 1.6 h−1. These conditions are close enough to (or even milder than) those used in industry using alumina-based catalysts.24 First, we analysed the effect of the composition of the ethanol/N2 stream fed into the reactor, i.e., by diluting the pure ethanol feed with different N2 flows, ranging from 0 to 35 N ml min−1. The ethanol molar concentrations in the feed, corresponding to the decreasing N2 flows studied, were 9, 14, 18, 25 and 100%. The results of these experiments are shown in Fig. 4.As observed in Fig. 4, the HPW/Tlb catalyst is very active for the ethylene production under the conditions studied in this work, reaching equilibrium conversions (96%). Note that carbon oxides were not observed among the products, neither in these experiments, nor under any other conditions studied in this work. This is a remarkable feature since crude ethylene obtained from the industrial process of ethanol dehydration to ethylene contains measurable amounts of CO and CO2.24 As shown in Fig. 4, ethanol conversion and especially ethylene selectivity are affected by the presence of N2 in the feed. Thus, the highest ethanol conversion and ethylene selectivity are achieved by using a N2 flow of 20 mL min−1 or higher. Below this N2 flow value, the selectivity towards the olefin decreases, but the ethanol conversion remains over 95%. These results indicate that feeding pure ethanol promotes the production of diethyl ether (DEE) to the point that the ethylene selectivity drops below 80% when no N2 is fed to the reactor. By contrast, olefin production is promoted when diluting ethanol with N2. This inhibition of ethylene production by using high concentrations of ethanol has been also reported with γ-Al2O3,54 and it was ascribed to the necessity of certain free sites for ethylene formation which are saturated when the concentration of the reactant is too high, thus favouring the formation of DEE. According to the literature, C2H4 can be produced from ethanol either directly or via DEE formation, which in a subsequent dehydration step produces ethylene.24 Lower space velocities may promote the formation of ethylene via the latter pathway. To assess this theory, we halved the space velocity and tested the dehydration of ethanol with HPW/Tlb under the same conditions. The results obtained are depicted in Fig. 5.
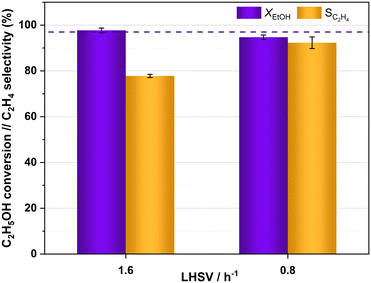 | ||
| Fig. 5 Ethanol conversion and ethylene selectivity obtained with HPW/Tlb at different LHSVs, 210 °C and 5 bar. Feed: azeotropic mixture ethanol/water. Dotted line: ethanol equilibrium conversion. | ||
As observed in Fig. 5, halving the LHSV results in higher ethylene selectivity, from ca. 78% to 92%; nevertheless, practically the same ethanol conversion was achieved irrespective of the LHSV. The improvement in ethylene selectivity is explained by the ethylene formation mechanism, which occurs both directly from ethanol and via DEE formation, which is subsequently cracked to ethylene and water, either over heteropoly acid catalysts or over other acid solids.34,55,56 This is in line with the results obtained by DRIFT spectroscopy, which show that DEE is more readily produced than ethylene, the formation of which was not fast enough until the temperature rose between 140 and 179 °C. Thus, a higher contact time between the reacting stream and the catalyst would facilitate the slower process of ethylene formation via DEE. Similar observations have been previously reported for the ethanol dehydration over heteropoly acid catalysts.57
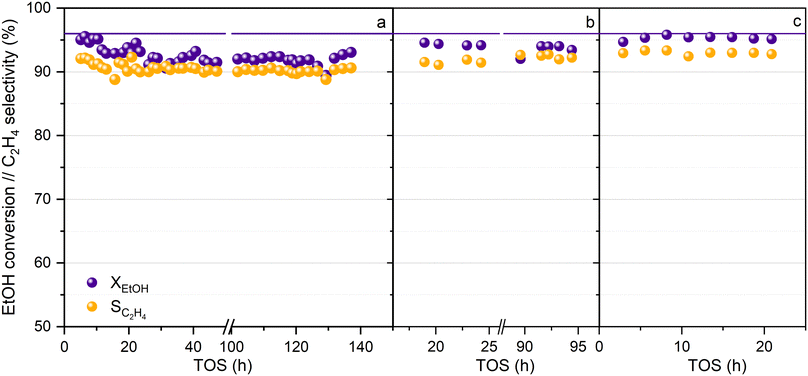
The activity of the HPW/Tlb catalyst has been tested at long reaction times without using N2 dilution of the azeotropic ethanol–water feed, and under conditions of cyclic shutting down and re-starting of the reaction system, to test the capability of the catalyst to perform properly at the industrial or semi-industrial scale. Thus, after ca. 140 hours of continuous reaction at 210 °C, 5 bar and LHSV = 0.8 h−1, the feed was switched to pure N2 and the pressure and temperature were decreased to ambient values. The system was maintained under these conditions for at least 24 h, and then the catalyst was re-activated for 1 h under a N2 flow at 220 °C, after which, the reaction was re-launched by feeding pure ethanol at 0.8 h−1 under the same reaction conditions used with the fresh catalyst. This protocol was repeated twice, and the results obtained can be observed in Fig. 6. Regarding the TOS at which these data were collected, this can be considered as a long-term experiment according to the available literature.58,59 Moreover, the study of the stability under shut-down and re-launch conditions is a differentiating element of our study, given that it is hardly ever considered in the available literature related to this process.
As shown in Fig. 6, HPW/Tlb is a robust catalyst, and neither ethanol conversion nor ethylene production are affected during shut down and re-launch experiments, revealing that this catalyst would be suitable for operating at the industrial or semi-industrial scale, in which the stability of the catalyst is mandatory. Within the first 10 hours of operation, the conversion and selectivity to ethylene dropped from 95 and 92% to 93 and 90%, respectively. After that, both remained mostly stable during the operation until the first shutdown of the reaction at nearly 140 h. Once reactivated, the catalytic performance is recovered, reaching a stable ethanol conversion of 94% and an C2H4 selectivity of 92%. The slight increase in the activity after reactivation was also observed after the second shutdown, achieving values of conversion and selectivity as high as those observed for the fresh catalysts at low TOS. Moreover, the fact that the catalyst is capable of operating for more than 250 h without N2 addition makes the HPW/Tlb a solid candidate to be used at a larger scale. On the other hand, the stable catalytic performance of HPW/Tlb in the azeotropic mixture ethanol–water suggests that this catalyst would be suitable for using bioethanol purified by distillation, with no need for additional separation operations, such as the use of zeolites to remove the remaining water.
Bioethanol usually contains impurities produced during different stages of its synthesis process, such as the pre-treatment of the biomass or the fermentation of the sugars obtained. These impurities can interfere in the proper performance of the catalysts used in the bioethanol transformation processes.27,60 The HPW/Tlb catalyst has been tested for the ethylene synthesis reaction using an azeotropic mixture of commercial bioethanol and water. The results obtained in this experiment are shown in Fig. 7.
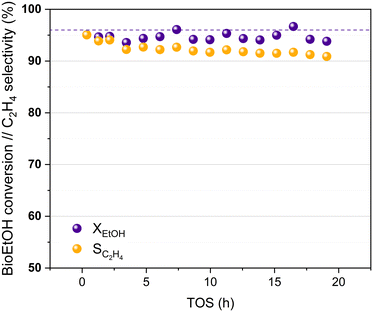 | ||
| Fig. 7 Bioethanol conversion and ethylene selectivity at increasing TOS, 210 °C and 5 bar. Liquid feed: azeotropic mixture bioethanol/water. Dotted line: ethanol equilibrium conversion. | ||
Fig. 7 reveals that the HPW/Tlb catalyst presents a similar activity when using bioethanol as a feed instead of pure, dehydrated ethanol. A stable bioethanol conversion around 95% is reached during 20 h of the experiment. The selectivity for bioethylene production ranged between 95% and 92% within the first 5 hours reaching a value of 91% after 19 h, with only DEE as a co-product. Thus, the HPW/Tlb catalyst provided a good, relatively stable activity for the bioethanol dehydration to bioethylene under industrially relevant conditions, resulting in a good candidate to be used at bigger scales with a regular bioethanol.
Conclusions
An HPW trilobe-shaped catalyst, HPW/Tlb, with outstanding activity for the ethanol dehydration reaction to ethylene has been synthesized. The support provided an increase in the HPW surface area 10 times higher than that of the bulk HPW. Both XRD and DRIFTS analyses confirmed that the Keggin structure of HPW maintained its integrity after impregnation. Besides, DRIFTS results illustrate how the HPW structure modifies its structure during the ethanol dehydration reaction, which has been considered as a proof that pseudo-liquid catalysis is taking place. The activity of the catalyst is highly selective towards ethylene, with no formation of CO or CO2, and presents good stability at long TOS and after shutdown and re-launch of the reaction. Finally, the catalyst is capable of working under industrially relevant conditions when bioethanol is fed to the reactor, confirming that HPW/Tlb is suitable for the bio-ethylene production reaction.Conflicts of interest
There are no conflicts to declare.Acknowledgements
This work has been developed in the frame of the URBIOFIN project, which has received funding from the Bio-Based Industries Joint Undertaking under the European Union's Horizon 2020 research and innovation programme under grant agreement No 745785. This study was supported by MCIN with funding from European Union NextGenerationEU (PRTR-C17.I1) within the Green Hydrogen and Energy Program-CSIC and CSIC Interdisciplinary Thematic Platform (PTI+) Transición Energética Sostenible+ (PTI-TRANSENER+). We acknowledge the support of the publication fee by the CSIC Open Access Publication Support Initiative through its Unit of Information Resources for Research (URICI).Notes and references
- H. E. Z. Immermann, L. E. Division, H. Zimmermann and R. Walzl, in Ullmann's Encyclopedia of Industrial Chemistry, 2012 Search PubMed.
- Ethylene Global Supply Demand Analytics Service, https://www.woodmac.com/news/editorial/ethylene-global-supply-demand-analytics-service/, (accessed 30 November 2021) Search PubMed.
- Y. Gao, L. Neal, D. Ding, W. Wu, C. Baroi, A. M. Gaffney and F. Li, ACS Catal., 2019, 9, 8592–8621 CrossRef CAS.
- T. Ren, M. Patel and K. Blok, Energy, 2006, 31, 425–451 CrossRef CAS.
- H. M. Torres Galvis and K. P. de Jong, ACS Catal., 2013, 3, 2130–2149 CrossRef CAS.
- S. H. Symoens, N. Olahova, A. E. Munoz Gandarillas, H. Karimi, M. R. Djokic, M. F. Reyniers, G. B. Marin and K. M. Van Geem, Ind. Eng. Chem. Res., 2018, 57, 16117–16136 CrossRef CAS.
- T. Ren, M. K. Patel and K. Blok, Energy, 2008, 33, 817–833 CAS.
- R. S. Postma and L. Lefferts, React. Chem. Eng., 2021, 6, 2425–2433 RSC.
- A. Cruellas, T. Melchiori, F. Gallucci and M. van Sint Annaland, Catal. Rev.: Sci. Eng., 2017, 59, 234–294 CrossRef CAS.
- I. Amghizar, L. A. Vandewalle, K. M. Van Geem and G. B. Marin, Engineering, 2017, 3, 171–178 CrossRef CAS.
- Z. Gholami, F. Gholami, Z. Tišler, J. Hubáček, M. Tomas, M. Bačiak and M. Vakili, Catalysts, 2022, 12, 1–31 Search PubMed.
- M. Ghavipour, R. M. Behbahani, R. B. Rostami and A. S. Lemraski, J. Nat. Gas Sci. Eng., 2014, 21, 532–539 CrossRef CAS.
- M. R. Gogate, Pet. Sci. Technol., 2019, 37, 559–565 CrossRef CAS.
- International Energy Agency, The Future of Petrochemicals, Paris, 2018, https://www.iea.org/reports/the-future-of-petrochemicals, (accessed 25 February 2022) Search PubMed.
- Y. Yoshimura, N. Kijima, T. Hayakawa, K. Murata, K. Suzuki, F. Mizukami, K. Matano, T. Konishi, T. Oikawa, M. Saito, T. Shiojima, K. Shiozawa, K. Wakui, G. Sawada, K. Sato, S. Matsuo and N. Yamaoka, Catal. Surv. Jpn., 2001, 4, 157–167 CrossRef.
- R. B. Dudek, X. Tian, M. Blivin, L. M. Neal, H. Zhao and F. Li, Appl. Catal., B, 2019, 246, 30–40 CrossRef CAS.
- I. S. Yakovleva, S. P. Banzaraktsaeva, E. V. Ovchinnikova, V. A. Chumachenko and L. A. Isupova, Catal. Ind., 2016, 8, 152–167 CrossRef.
- Y. Ma, Q. Ge, W. Li and H. Xu, Appl. Catal., B, 2009, 90, 99–104 CrossRef CAS.
- Y. Ma, Q. Ge, W. Li and H. Xu, J. Nat. Gas Chem., 2008, 17, 387–390 CrossRef CAS.
- A. Morschbacker, Polym. Rev., 2009, 49, 79–84 CrossRef CAS.
- J. A. Okolie, A. Mukherjee, S. Nanda, A. K. Dalai and J. A. Kozinski, Int. J. Energy Res., 2021, 45, 14145–14169 CrossRef CAS.
- I. Ioannou, S. C. D'Angelo, Á. Galán-Martín, C. Pozo, J. Pérez-Ramírez and G. Guillén-Gosálbez, React. Chem. Eng., 2021, 6, 1179–1194 RSC.
- IEA-ETSAP and IRENA, Technology brief I13, Production of Bio-ethylene, 2013 Search PubMed.
- M. Zhang and Y. Yu, Ind. Eng. Chem. Res., 2013, 52, 9505–9514 CrossRef CAS.
- C. Rodaum, S. Klinyod, W. Nunthakitgoson, P. Chaipornchalerm, N. Liwatthananukul, P. Iadrat and C. Wattanakit, Chem. Commun., 2022, 58, 9618–9621 RSC.
- J. Sun and Y. Wang, ACS Catal., 2014, 4, 1078–1090 CrossRef CAS.
- N. Sanchez, R. Ruiz, V. Hacker and M. Cobo, Int. J. Hydrogen Energy, 2020, 45, 11923–11942 CrossRef CAS.
- C. Peinado, D. Liuzzi, R. M. Ladera-Gallardo, M. Retuerto, M. Ojeda, M. A. Peña and S. Rojas, Sci. Rep., 2020, 10, 8551 CrossRef CAS PubMed.
- R. M. Ladera, M. Ojeda, J. L. G. Fierro and S. Rojas, Catal. Sci. Technol., 2015, 5, 484–491 RSC.
- R. Al-Faze, A. Finch, E. F. Kozhevnikova and I. V. Kozhevnikov, Appl. Catal., A, 2020, 597, 117549 CrossRef CAS.
- A. Ciftci, D. Varisli, K. Cem Tokay, N. Asli Sezgi and T. Dogu, Chem. Eng. J., 2012, 207–208, 85–93 CrossRef CAS.
- W. Alharbi, E. Brown, E. F. Kozhevnikova and I. V. Kozhevnikov, J. Catal., 2014, 319, 174–181 CrossRef CAS.
- M. Almohalla, I. Rodríguez-Ramos and A. Guerrero-Ruiz, Catal. Sci. Technol., 2017, 7, 1892–1901 RSC.
- A. Popa and V. Sasca, React. Kinet., Mech. Catal., 2017, 121, 657–672 CrossRef CAS.
- O. Verdes, V. Sasca, M. Suba, S. Borcanescu and A. Popa, React. Kinet., Mech. Catal., 2019, 128, 53–69 CrossRef CAS.
- U. Filek, A. Kirpsza, A. Micek-Ilnicka, E. Lalik and A. Bielański, J. Mol. Catal. A: Chem., 2015, 407, 152–162 CrossRef CAS.
- M. C. H. Clemente, G. A. V. Martins, E. F. de Freitas, J. A. Dias and S. C. L. Dias, Fuel, 2019, 239, 491–501 CrossRef CAS.
- Technip Energies Process Technology Handbook, 2021, https://edition.pagesuite.com/html5/reader/production/default.aspx?pubname=&pubid=9f345b4c-683a-40dc-b3b4-dbb8fce57a5b, (accessed 15 August 2022) Search PubMed.
- R. M. Ladera, J. L. G. Fierro, M. Ojeda and S. Rojas, J. Catal., 2014, 312, 195–203 CrossRef CAS.
- A. M. Herring and R. L. McCormick, J. Phys. Chem. B, 1998, 102, 3175–3184 CrossRef CAS.
- Y. Geng, S. Xiong, B. Li, Y. Liao, X. Xiao and S. Yang, Ind. Eng. Chem. Res., 2018, 57, 856–866 CrossRef CAS.
- E. López-Salinas, J. G. Hernández-Cortéz, I. Schifter, E. Torres-García, J. Navarrete, A. Gutiérrez-Carrillo, T. López, P. P. Lottici and D. Bersani, Appl. Catal., A, 2000, 193, 215–225 CrossRef.
- J. M. Miller and L. J. Lakshmi, J. Phys. Chem. B, 1998, 102, 6465–6470 CrossRef CAS.
- H. Liu, Y. Jiang, D. Liu, S. Li, X. Yang, Y. Ji and Y. Cui, Vib. Spectrosc., 2018, 96, 101–105 CrossRef CAS.
- J. Lin and B. Wang, Adv. Mater. Sci. Eng., 2014, 2014, 594516 Search PubMed.
- M. M. Mohamed and G. M. S. El Shafei, Spectrochim. Acta, Part A, 1995, 51, 1525–1531 CrossRef.
- M. G. Garnica-Romo, J. M. Yañez-Limón, M. Villicaña, J. F. Pérez-Robles, R. Zamorano-Ulloa and J. González-Hernandez, J. Phys. Chem. Solids, 2004, 65, 1045–1052 CrossRef CAS.
- Z. S. B. Sousa, C. O. Veloso, C. A. Henriques and V. Teixeira da Silva, J. Mol. Catal. A: Chem., 2016, 422, 266–274 CrossRef CAS.
- J. Schnee and E. M. Gaigneaux, Catal. Sci. Technol., 2017, 7, 817–830 RSC.
- S. Damyanova, J. L. G. Fierro, I. Sobrados and J. Sanz, Langmuir, 1999, 15, 469–476 CrossRef CAS.
- A. Vimont, A. Travert, C. Binet, C. Pichon, P. Mialane, F. Sécheresse and J. C. Lavalley, J. Catal., 2006, 241, 221–224 CrossRef CAS.
- P. Berteau, B. Delmon, J. L. Dallons and A. Van Gysel, Appl. Catal., 1991, 70, 307–323 CrossRef CAS.
- T. Barzetti, E. Selli, D. Moscotti and L. Forni, J. Chem. Soc., Faraday Trans., 1996, 92, 1401–1407 RSC.
- S. Golay, R. Doepper and A. Renken, Chem. Eng. Sci., 1999, 54, 4469–4474 CrossRef CAS.
- T. K. Phung and G. Busca, Chem. Eng. J., 2015, 272, 92–101 CrossRef CAS.
- H. Knözinger and R. Köhne, J. Catal., 1966, 5, 264–270 CrossRef.
- V. V. Bokade and G. D. Yadav, Appl. Clay Sci., 2011, 53, 263–271 CrossRef CAS.
- A. P. Kagyrmanova, V. A. Chumachenko, V. N. Korotkikh, V. N. Kashkin and A. S. Noskov, Chem. Eng. J., 2011, 176–177, 188–194 CrossRef CAS.
- M. C. H. Clemente, G. A. V. Martins, E. F. de Freitas, J. A. Dias and S. C. L. Dias, Fuel, 2019, 239, 491–501 CrossRef CAS.
- H. Habe, T. Shinbo, T. Yamamoto, S. Sato, H. Shimada and K. Sakaki, J. Jpn. Pet. Inst., 2013, 56, 414–422 CrossRef CAS.
| This journal is © The Royal Society of Chemistry 2023 |

