Lipid droplets alleviate cadmium induced cytotoxicity in Saccharomyces cerevisiae
Selvaraj
Rajakumar
 and
Vasanthi
Nachiappan
*
Biomembrane Lab, Department of Biochemistry, Centre of Excellence in Life Sciences, Bharathidasan University, Tiruchirappalli 620024, Tamil Nadu, India. E-mail: vasanthibch@gmail.com; Fax: +91 431 2407045; Tel: +91 431 2904866
First published on 4th October 2016
Abstract
Cadmium (Cd) induces oxidative stress that generates reactive oxygen species (ROS) and increased lipid accumulation. However, very little is known about the role of oxidative stress in triacylglycerol (TAG) accumulation. TAG accumulation is deleterious to health and may result in obesity-associated metabolic syndrome. Hence TAG accumulation plays an important role in Cd induced cytotoxicity. The exposure of Wild-type (WT) cells to Cd, resulted in TAG accumulation and also enhanced viability when compared to TAG mutants (dga1Δ, lro1Δ and are2Δ). The inhibition of lipolysis also increased the tolerance of the cells to Cd. Fluorescence microscopy observations using acridine orange and DHR123 staining demonstrated that the TAG deficient mutants showed enhanced cell death and ROS production. The over expression of DGA1 and LRO1 rescued the Cd induced cytotoxicity by enhancing the formation of LDs. Results of this study revealed the possible metabolic link between LDs and oxidative stress in S. cerevisiae.
1. Introduction
Lipid imbalance is a collective result of obesity and other metabolic syndromes, including diabetes and atherosclerosis1 that result in cellular dysfunction and eventually cell death. The addition of palmitate induces lipotoxicity through the accumulation of ceramides, membrane lipids and ROS,2,3 while the incorporation of oleate causes unfolded protein responses, necrosis, and apoptosis.4 However the mechanism of lipid metabolism imbalance is poorly understood.Neutral lipids are energy reservoirs and are a source of building blocks needed for membrane formation. The triacylglycerols (TAG) and sterol esters (SE) in S. cerevisiae are stored as lipid droplets (LDs). The LDs are independent organelles surrounded by a monolayer membrane derived from the ER membrane.5–7 The synthesis of LDs in yeast is under the control of four enzymes; two produce TAG (Lro1 and Dga1), and two (Are1 & Are2) make SE.8,9 The acyl-CoA: sterol acyltransferases, Are1p, and Are2p, are polytrophic ER membrane proteins that synthesize SE. The LRO1 encodes for lecithin-cholesterol acyltransferase (LCAT) – that converts diacylglycerol (DAG) to TAG through trans-esterification of a fatty acid from phospholipids, whereas DGA1 (diacylglycerol acyltransferase) catalyzes the acyl-CoA-dependent synthesis of TAG from diacylglycerol.10–13 The LDs are required for cell cycle progress,14 and TAG plays a key role in counteracting FA-induced lipotoxicity.1,15,16 The importance of this organelle under external toxicants remains elusive.
Cadmium (Cd) is an industrial toxicant and an environmental pollutant. It has a biological half-life of more than 20 years in the human body17 and Cd exposure occurs through food, water, cigarette smoke and occupation. Acute and chronic exposure to Cd causes hepatotoxicity and nephrotoxicity and the mechanism of cytotoxicity is yet to be elucidated. Several studies have shown that Cd modulates toxic effects through oxidative stress-associated mechanisms. The excessive reactive oxygen species (ROS) damages the tissues and cells by acting on the proteins or nucleic acids altering their structure and function,18 inhibiting the energy metabolism,19 interfering with thiol proteins,20 and altering the superoxide dismutase and catalase activities.21
In our earlier study, the phospholipids mainly phosphatidylcholine (PC) and phosphatidylethanolamine (PE) were increased in Saccharomyces cerevisiae upon Cd exposure22 and induced endoplasmic reticulum (ER) stress.23 There is a functional link between phospholipid metabolism and TAG formation in Saccharomyces cerevisiae during different phases of growth. The precursors are channeled towards phospholipid synthesis during membrane formation and towards lipid droplets during storage.24 Interestingly, the growth of S. cerevisiae using oil as an energy source in the presence of lipase, leads to mitochondrial necrosis, indicating fatty acid toxicity.25 Furthermore, fatty acid sensitivity is significantly enhanced in yeast cells that were unable to form LDs.1,15 In this study, we are trying to elucidate the role of yeast cells in maintaining the LD/TAG homeostasis during Cd stress. We observed that the mutants affecting the LD/TAG accumulation increased the oxidative stress and cytotoxicity in Saccharomyces cerevisiae.
2. Materials and methods
Chemical and reagents
Yeast extract, peptone, and bacteriological agar were purchased from Difco. Thin-layer silica gel 60 plates were purchased from Merck. BODIPY 493/503 was purchased from Invitrogen. Trizol and all other chemicals were purchased from Sigma unless specifically mentioned. The cDNA synthesizing kit was obtained from Bio-Rad. All solvents were purchased from Merck, and lipid standards were obtained from Avanti Polar Lipids (Alabaster, AL).Strains and growth conditions
Saccharomyces cerevisiae strains used throughout this study are listed in Table 1. Strains were grown aerobically up to the early stationary phase at 30 °C in YPD medium (1% yeast extract, 2% Bacto-Peptone and 2% dextrose). The yeast cells were pre-cultured in 5 ml of YPD medium for 12 h, and then the cells were harvested and transferred to 25 ml of YPD media with or without 50 μM Cd so that the final A600 of 0.1 was achieved. Following this, the cells were agitated at 180 rpm at 30 °C up to the stationary phase.| S. No. | Yeast strain | Genotype | Source |
|---|---|---|---|
| 1. | WT (BY4741) | BY4741 MATa his3Δ1 leu2Δ0 met15Δ0 ura3Δ0 | Prof. Ram Rajasekharan, CFTRI, India |
| 2. | dga1Δ | BY4741 MATa his3Δ1 leu2Δ0 met15Δ0 ura3Δ0 dga1Δ::KanMX4 | Prof. Ram Rajasekharan, CFTRI, India |
| 3. | lro1Δ | BY4741 MATa his3Δ1 leu2Δ0 met15Δ0 ura3Δ0 lro1Δ::KanMX4 | Prof. Ram Rajasekharan, CFTRI, India |
| 4. | areΔ | BY4741 MATa his3Δ1 leu2Δ0 met15Δ0 ura3Δ0 are1Δ::KanMX4 | Prof. Ram Rajasekharan, CFTRI, India |
| 5. | are2Δ | BY4741 MATa his3Δ1 leu2Δ0 met15Δ0 ura3Δ0 are2Δ::KanMX4 | Prof. Ram Rajasekharan, CFTRI, India |
| 6. | W303-1A (WT) | ade2-1 can1-100 his3-11,15 leu2-3 112 trp1-1 ura3-1 | Prof. Sten. Stymne, Germany |
| 7. | H1226 (W303-1A) | MATa dga1::KanMX4 lro1::TRP1 ADE2 met his3 ura3 leu2 | Prof. Sten. Stymne, Germany |
| 8. | H1112 (W303-1A) | MATα are1::HIS3 are2::LEU2 ADE2 met ura3 trp1 | Prof. Sten. Stymne, Germany |
| 9 | YDS10 | QM (dga1Δ, lro1Δ, are1Δ, are2Δ + pGP316 (empty)) | Dr K. Athenstaedt, Austria |
| 10. | YDS11 | QM + pGP316 (bearing DGA1) | Dr K. Athenstaedt, Austria |
| 11. | YDS12 | QM + pGP316 (bearing LRO1) | Dr K Athenstaedt, Austria |
| 12. | tgl3Δtgl4Δ (BY4741)) | his3Δ1; leu2Δ0; lys2Δ0; ura3Δ0; tgl3::kanMX4; tgl4::kanMX4 | Prof. Gunther Daum, Austria |
| 13. | tgl4Δtgl45 (BY4741)) | his3Δ1; leu2Δ0; lys2Δ0; ura3Δ0; tgl4::kanMX4 tgl5::kanMX4 | Prof. Gunther Daum, Austria |
| 14. | tglQiΔ (BY4741) | tgl3Δ::kanMX4; tgl4Δ::kanMX4; tgl5Δ::kanMX4; are1Δ::LEU2; are2Δ::kanMX4 | Prof. Gunther Daum, Austria |
Cell viability and growth
To study the sensitivity against cadmium, wild-type, and mutant strains were diluted (4 fold) and spotted on YPD plates containing 2% agar supplemented with varying concentrations of Cd (0 to 100 μM) and incubated for two days at 30 °C. Minimum inhibition was found at 50 μM and was used for further experimental purposes.Extraction and separation of lipids
Equal numbers of yeast cells were taken, and the yeast lipids were extracted.26 Briefly, to the cell pellet, a 2![[thin space (1/6-em)]](https://www.rsc.org/images/entities/char_2009.gif) :
:![[thin space (1/6-em)]](https://www.rsc.org/images/entities/char_2009.gif) 1 ratio of chloroform and methanol was added followed by vortexing. To this, an equal volume of acidified water (2% phosphoric acid) was added and vigorously vortexed. The neutral lipids were separated by using petroleum ether
1 ratio of chloroform and methanol was added followed by vortexing. To this, an equal volume of acidified water (2% phosphoric acid) was added and vigorously vortexed. The neutral lipids were separated by using petroleum ether![[thin space (1/6-em)]](https://www.rsc.org/images/entities/char_2009.gif) :
:![[thin space (1/6-em)]](https://www.rsc.org/images/entities/char_2009.gif) diethyl ether
diethyl ether![[thin space (1/6-em)]](https://www.rsc.org/images/entities/char_2009.gif) :
:![[thin space (1/6-em)]](https://www.rsc.org/images/entities/char_2009.gif) acetic acid (70
acetic acid (70![[thin space (1/6-em)]](https://www.rsc.org/images/entities/char_2009.gif) :
:![[thin space (1/6-em)]](https://www.rsc.org/images/entities/char_2009.gif) 30
30![[thin space (1/6-em)]](https://www.rsc.org/images/entities/char_2009.gif) :
:![[thin space (1/6-em)]](https://www.rsc.org/images/entities/char_2009.gif) 1, v/v) as the solvent system. Individual lipids were located by comparing the Rf values of the unknown with the Rf values of the standard. For the neutral lipids, the spots were visualized by post-chromatographic staining after dipping TLC plates into a solution containing 0.8 g MnCl2·4H2O, 120 ml water, 120 ml methanol and 9 ml concentrated sulfuric acid and charring at 105 °C for 30 minutes and quantified by a densitometry scanner.
1, v/v) as the solvent system. Individual lipids were located by comparing the Rf values of the unknown with the Rf values of the standard. For the neutral lipids, the spots were visualized by post-chromatographic staining after dipping TLC plates into a solution containing 0.8 g MnCl2·4H2O, 120 ml water, 120 ml methanol and 9 ml concentrated sulfuric acid and charring at 105 °C for 30 minutes and quantified by a densitometry scanner.
Isolation of RNA and reverse transcriptase-polymerase chain reaction (RT-PCR)
Wild-type cells and mutants were cultured as described previously. The total RNA was extracted from control and Cd treated cells using the TRIzol reagent (Sigma, India). The cDNA was synthesized using 2 μg of total RNA with random hexamer primers in a 20 μl reverse transcriptase reaction using a cDNA synthesizing kit (Bio-Rad). Gene-specific primers (Table 2) were used for amplification of the cDNA. PCR was subjected to 30 cycles at 94 °C for 30 seconds, 59 °C for 30 seconds and 72 °C for 30 seconds, followed by a final extension cycle at 72 °C for 5 minutes. The RT-PCR products were analyzed by 1% agarose gel electrophoresis.27 To ensure RNA quality, all preparations were subjected to analysis for β-actin expression. The semi-quantitatively analyzed RT-PCR results were scanned for gel images and the intensity of each PCR product was measured using BIO-RAD Quantity One software version 4.6.9.30 gel documentation.| S. no. | Gene | Primer | Size (bp) |
|---|---|---|---|
| 1. | LRO1 | 5′ AAATGGGTCGAGGCTGAAGG 3′ | 528 |
| 5′ ATTCGACCAGTGCTTGTGGT 3′ | |||
| 2. | DGA1 | 5′ GGAGCGTTTGCAACAGAAGG 3′ | 632 |
| 5′ AATTCTGCATCCGGTACCCC 3′ | |||
| 3. | ARE1 | 5′ TCGAGTTGGCTTTCATCCCC 3′ | 558 |
| 5′ TGTCGAAGAGCAGGTGGAAC 3′ | |||
| 4. | ARE2 | 5′ GATCTGCGCCATCTTCGGTA 3′ | 589 |
| 5′ GACACTTGGTCCCATGCAGA 3′ | |||
| 5. | ACC1 | 5′ GAGCCGGCTTTGGCCTTCCA 3′ | 449 |
| 5′ GCACGCAATGGTACTGGGGCA 3′ | |||
| 6. | FAS1 | 5′ TCGAGAAATGGCAAGCCTGT 3′ | 635 |
| 5′ TAGCCACGTACCCTGGATGA 3′ | |||
| 7. | OLE1 | 5′ AAATGGGTCGAGGCTGAAGG 3′ | 621 |
| 5′ ATTCGACCAGTGCTTGTGGT 3′ | |||
| 8. | ACT1 | 5′ ACGTCGCCTTGGACTTCGAA 3′ | 317 |
| 5′ AGATGGAGCCAAAGCGGTGA 3′ |
Fatty acid analysis
Fatty acids of total lipids were analyzed by gas chromatography. Lipids were extracted by the Bligh and Dyer method and subjected to methanolysis using BF3-methanol for conversion to methyl esters.28 Fatty acid methyl esters were separated by gas chromatography, and quantification was referred to heptadecanoic methyl ester, as an internal standard.Cell staining
Yeast cells in the stationary phase were harvested and washed with phosphate-buffered saline (PBS). The lipid droplets were stained by BODIPY 493/503 (0.5 μg ml−1), and incubated for 20 min at room temperature. After two washes with PBS buffer, the cells were resuspended in 50 μl of PBS and observed with a confocal microscope directly after staining.29 To analyze ROS production and mitochondrial damage, WT and mutant cells were treated with Cd, and collected after reaching the stationary phase and with 5 μg ml−1 of dihydrorhodamine (DHR) 123 in PBS for 30 min at room temperature (RT).30 Further, we assessed the cell death by acridine orange and ethidium bromide (AO/EtBr) staining.31Image acquisition
Samples were fixed with 0.5% (wt/vol) agarose on microscope slides. Fluorescence microscopy images were recorded on an LSM 710 Confocal microscope (Zeiss) equipped with a 100/1.40 oil objective and an AxioCam MRM camera (Zeiss) at room temperature.Statistics
The data analysis was done using the program PRISM 5.6. Each experiment was done thrice, and the data were presented as mean ± SD. Statistical analysis was carried out by a one way analysis of variance (ANOVA) test. The statistical probability of *P < 0.05, **P < 0.01 and ***P < 0.001 was considered to be significant.3. Results
Accumulation of neutral lipids during Cd exposure in wild-type cells
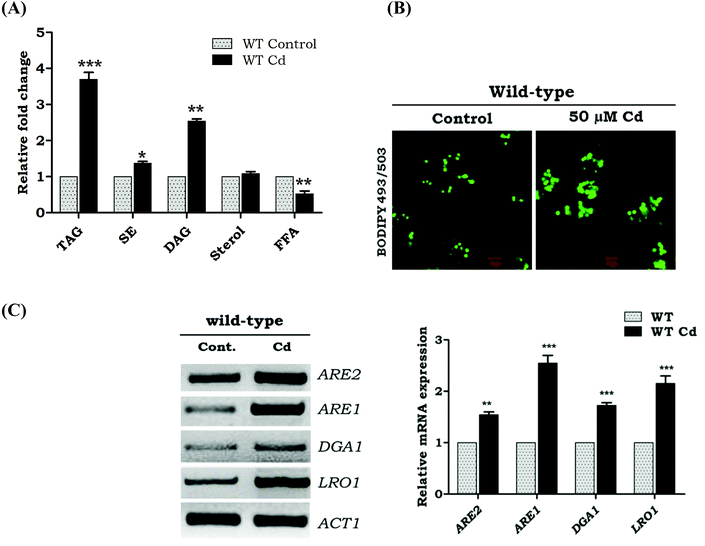
To address the question whether Cd exposure alters the storage of neutral lipids in yeast, we first quantified TAG and SE in Cd treated and untreated wild-type cells (WT) (Fig. 1A). Upon Cd exposure, our results showed a 2.7 fold increase in the TAG levels, 1.6 fold in DAG, but not much change in the sterol level. TAG is efficiently packed into the lipid droplets. Hence the over load of TAG and SE contributes to the increased number of lipid droplets in Cd treated cells. Labeling of lipid droplets with the lipophilic dye BODIPY 493/503 showed LD accumulation with Cd exposure, compared to WT control cells (Fig. 1B). The transcriptional response of genes related to TAG formation was studied during Cd exposure, and the results indicated a higher expression of LRO1 compared to DGA1 (Fig. 1C). The ARE1 was up-regulated significantly while compared to ARE2 (Fig. 1C).Upregulation of fatty acid synthesizing genes during Cd exposure
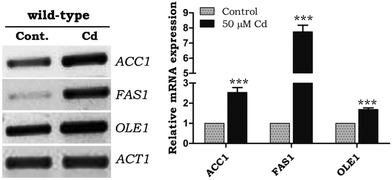
Fatty acids significantly contributed to the lipid composition. Fatty acid synthesis and desaturation play a main role in the lipotoxicity, and excessive FFA can be stored as LDs. The mRNA expression of fatty acid synthesizing genes ACC1 and FAS1 (acetyl-CoA carboxylase1 and fatty acid synthase1) was upregulated under Cd exposure, notably FAS1 showed a 5 fold difference from WT control cells (Fig. 2). There was an up-regulation of OLE1 (fatty acid desaturase) under Cd treatment (Fig. 2).Alteration of fatty acids during Cd exposure
The total cellular fatty acid pattern in WT control and Cd treated cells was measured using GC-MS analysis. The Cd treated cells demonstrated an increased level of C16:1 and C18:2, a decrease in C16:0 and C18:0 and a slight increase in the unsaturated fatty acid/saturated fatty acid ratio (Table 3).| Fatty acid (%) | Control | Cd-Treated |
|---|---|---|
| Total fatty acid profiling: WT (BY4741) cells were treated with (50 μM) and without Cd up to an early stationary phase. Lipids were extracted and separated by TLC. The control and Cd treated cells were methylated by BF3-methanol for conversion to volatile fatty acid methyl esters (FAME). The FAME were analyzed by GC/MS. The fatty acids were quantified using an internal standard heptadecanoic methyl ester. Each set of data represents the mean ± SD of three independent experiments. The control group was compared against the cadmium treated group with a statistical significance of **P < 0.001, *P < 0.01. | ||
| C16:0 | 39.42 ± 0.57 | 36.90 ± 0.56 |
| C16:1 | 23.30 ± 0.15 | 30.63 ± 1.01* |
| C18:0 | 30.90 ± 1.59 | 27.20 ± 1.04* |
| C18:1 | 5.44 ± 0.44 | 2.79 ± 0.65 |
| C18:2 | 0.91 ± 0.04 | 2.46 ± 0.17 |
| SFA | 70.32 | 64.10* |
| UFA | 29.67 | 35.89* |
| UFA/SFA | 0.421 | 0.559 |
Growth pattern of LD mutants under Cd stress
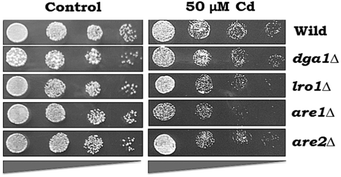
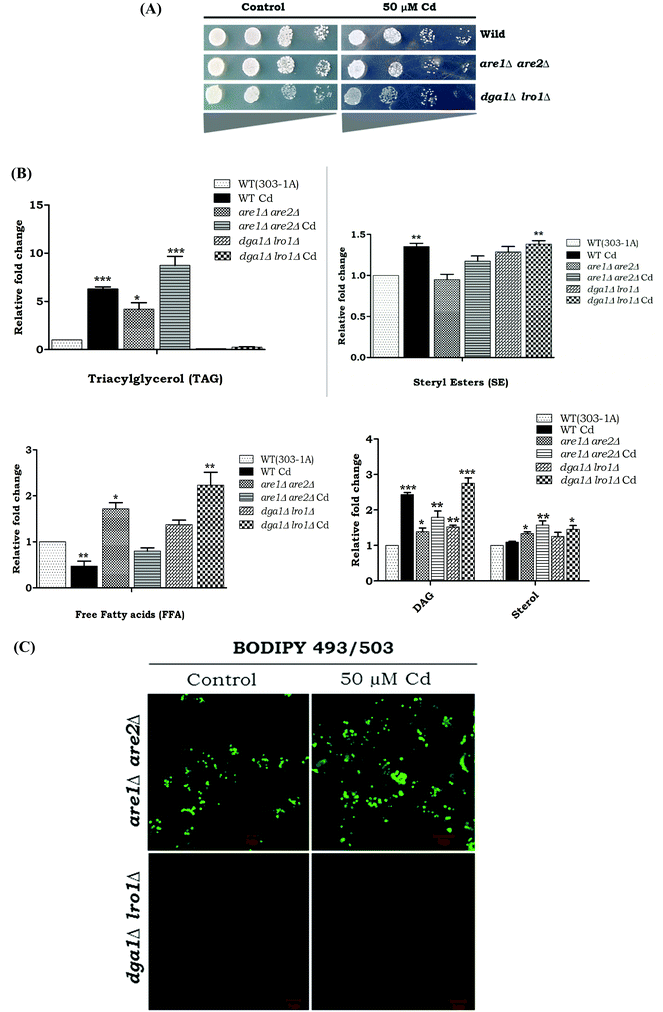
The growth pattern of yeast cells (WT and LD mutants-dga1Δ, lro1Δ, are1Δ and are2Δ) exposed to Cd was monitored by spot test analysis (Fig. 3). WT cells were able to tolerate up to 50 μM Cd. Hence, we used 50 μM Cd for further experiments. Spot test analysis was performed in the TAG synthesizing mutant strains such as dga1Δ, lro1Δ, and SE synthesizing mutant strains such as are1Δ, are2Δ and the double knockouts (dga1Δlro1Δ and are1Δare2Δ). Cd sensitivity was observed in dga1, lro1, are1 and are2 (Fig. 3) deletion strains as well as dga1Δlro1Δ double deletion strains (Fig. 5A). These results indicate that the defects in LD formation reduced the cell viability during Cd exposure.Effects of cadmium on TAG synthesis
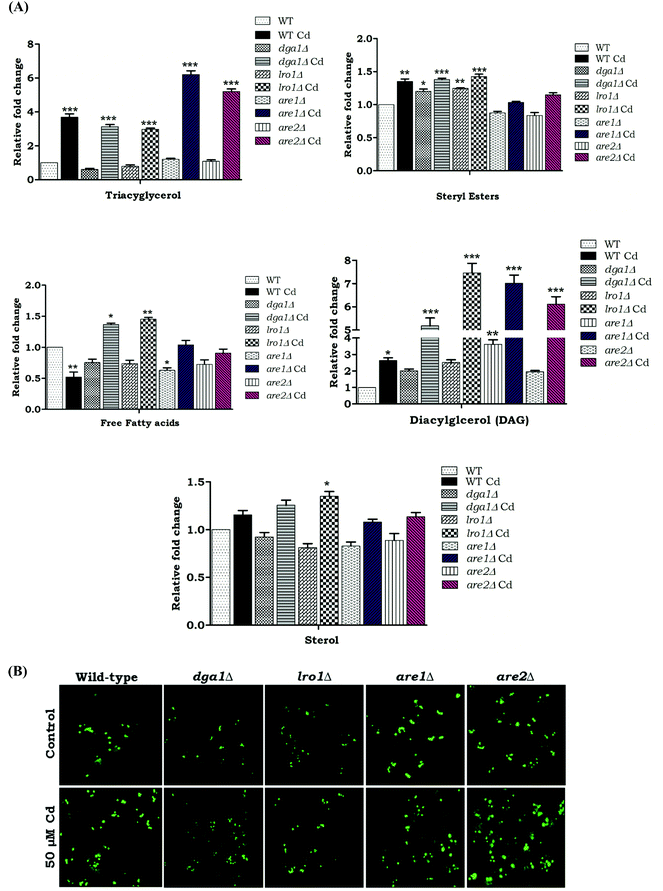
We wanted to determine the effect of Cd exposure on storage lipid synthesis and LD formation in yeast during the deletion of DGA1, LRO1, ARE1, and ARE2. There was about a 5.2 and 4.2 fold increase in the TAG levels in are1Δ and are2Δ strains in the presence of Cd, whereas the dga1Δ and lro1Δ strains only depicted a slight increase in TAG upon Cd exposure (Fig. 4A). The WT cells, are1Δ and are2Δ depicted an increase in LD formation with Cd exposure. In contrast, dga1Δ and lro1Δ strains did not show a significant increase in LD (Fig. 4B). Notably another WT (303-1A background) cell showed a huge (5.2 fold) increase of TAG but did not show significant changes in the SE level during exposure to Cd. Further, the double deletion of TAG synthesizing genes DGA1 and LRO1 reduced the TAG levels significantly whereas the double deletion of the SE synthesizing genes ARE1 and ARE2 increased TAG to 7.7 and 3.2 fold in the presence and absence of Cd respectively (Fig. 5B). Moreover are1Δare2Δ depicted an increase in LD formation that was further increased with Cd exposure (Fig. 5C). dga1Δlro1Δ (1.2 fold) showed an accumulation of free fatty acids and it was slightly reduced in are1Δare2Δ (Fig. 5B). So these results clearly demonstrate that the defect in TAG synthesis caused the accumulation of FFA.Impairment of LD biogenesis induced ROS level during Cd exposure
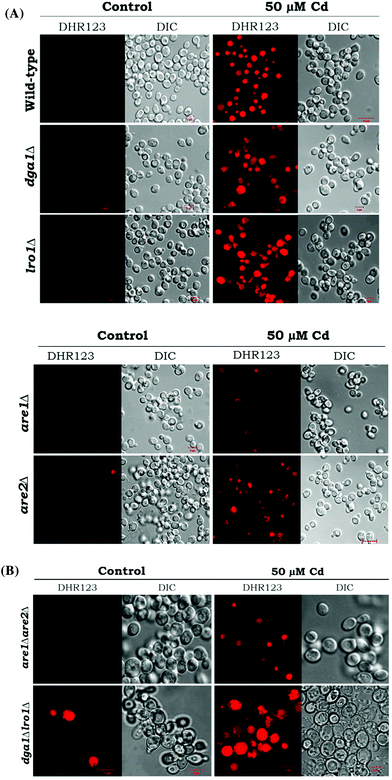
Reactive oxygen species (ROS) are potential mediators of programmed cell death (PCD). We used DHR123 staining for detecting ROS formation. All the deletion strains dga1Δ, lro1Δ, are1Δ, are2Δ and WT cells showed increased ROS accumulation (Fig. 5). We next examined the role of double deletion strains (dga1Δlro1Δ and are1Δare2Δ). Here, dga1Δlro1Δ strains showed more ROS production (Fig. 8A). From these experiments, we conclude that strains that failed to utilize FFA had more ROS formation.TAG deficiency increases apoptosis during Cd toxicity
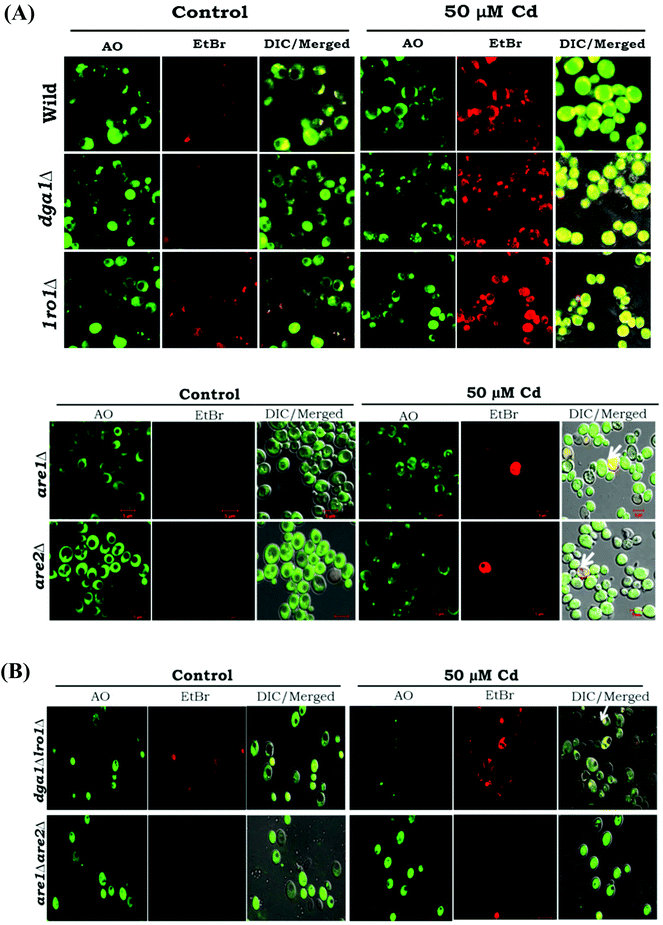
Our data highlight the increased formation of FFA and ROS, and it has been connected to cell death. We studied the acridine orange/ethidium bromide (AO/EB) fluorescent staining and the pivotal role of TAG in the salvage mechanism. The dual AO/EB (acridine orange and ethidium bromide) dyes discriminate the live cells from the dead cells by membrane integrity. Acridine orange (green dye) is a vital dye, and it stains both live and dead cells whereas ethidium bromide (orange dye) is incorporated only in the late apoptotic and necrotic cells. Cd treated WT cells showed a uniform green color, this observation indicating the normal physiology of cells. Furthermore, are1 and are2 mutants showed a similar pattern as with the WT cells (Fig. 6A). The TAG mutants (single and double deletion of dga1Δlro1Δ) resulted in a yellowish green color indicating the signs of early apoptosis and orange-red represents late apoptotic cells, with concentrated and unequally contained nuclear EB staining (Fig. 6B). Thus, apoptosis was confirmed in the TAG deficient cells that are mediated by the overload of FFA and ROS.TAG can ameliorate the effects of cytotoxicity
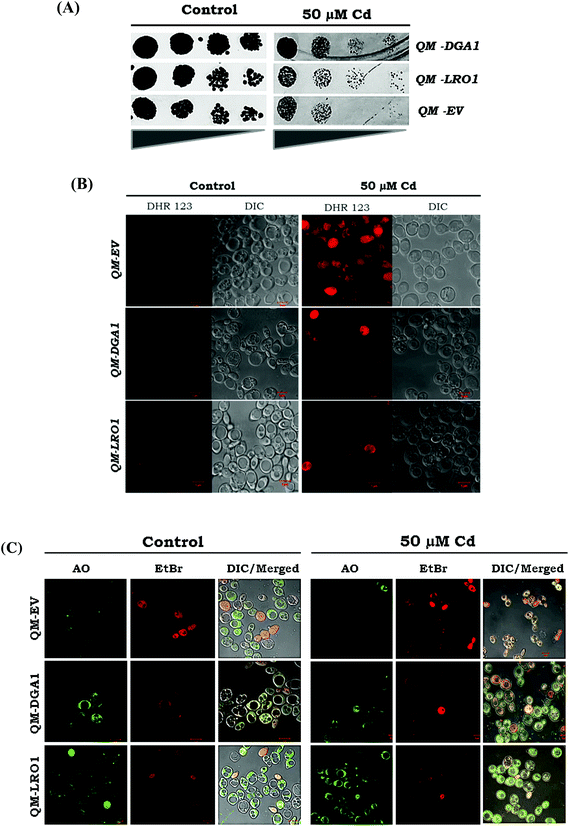
We analyzed the possibility of LDs ameliorating the Cd induced cytotoxicity. We further corroborated our claim in quadruple mutant (QM) backgrounds (dga1Δ, lro1Δ, are1Δ, are2Δ). It has been demonstrated that strains with over-expressed genes (DGA1 & LRO1) QM-DGA1 and QM-LRO1 showed growth improvement with Cd exposure compared to a QM-empty vector (Fig. 8A). Moreover, we found the reduction of ROS in QM-DGA1 and QM-LRO1 with Cd exposure (Fig. 8B). Further to study the mechanism of cell death, we assessed the role of Cd induced lipotoxicity by using viability and cell death stain AO/EtBr. Enhanced red and orange stained cells showed the late stage of apoptosis in a QM empty vector strain during Cd treatment, but the TAG over-expressed strains QM-DGA1 and QM-LRO1 showed yellow green stains indicating an early stage of apoptosis, like WT treated cells (Fig. 8C). This study indicated that the accumulation of TAG has alleviated the detrimental effects of ROS accumulation as well as the lipotoxic effects caused by Cd stress. Notably, we have demonstrated that TAG mediated LD formation alleviates Cd induced cytotoxicity.Defects in TAG hydrolysis rescued Cd toxicity
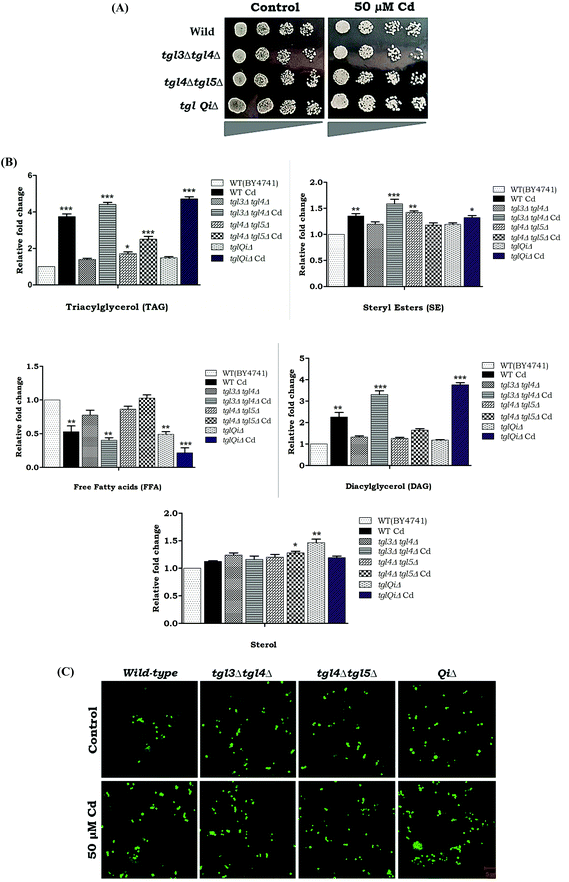
The blockage or defects in TAG hydrolysis rescued the lipotoxicity by the accumulation of the LDs. We analyzed Cd sensitivity in the deletion strains that accumulated TAG, (tgl3Δtgl4Δ, tgl4Δtgl5Δ and tg13Δtgl4Δtgl5Δare1Δare2Δ). Interestingly, our results showed that the above mutants were more resistant in Cd up to 50 μM (Fig. 9A). Hence we analyzed the TAG and SE levels in tgl3Δtgl4Δ, tgl4Δtgl5Δ and quintuple mutants. Our results showed that an above 3 fold increase in TAG and 3 to 3.8 fold accumulation of DAG were observed in tgl3Δtgl4Δ and tglQiΔ during Cd treatment. A significant reduction of FFA was also observed when there was an accumulation of DAG/TAG (Fig. 9B). A significant increase of LDs was observed in tgl3Δtgl4Δ and quintuple mutants under Cd treatment (Fig. 9C). These data collectively demonstrate that TAG accumulated LD reduced Cd induced lipotoxicity and cytotoxicity.4. Discussion
The toxic heavy metal cadmium is associated with a sequence of deteriorating disorders in humans, which also causes programmed cell death (PCD).32,33 A unicellular organism, such as Saccharomyces cerevisiae is used as a model system for PCD, and it is proven to be a valuable tool for the elucidation of several key apoptotic regulators.34–36 Moreover, the mechanism for cadmium induced lipotoxicity has not been defined. In the current study, we investigated the impact of lipid droplets on cadmium induced cytotoxicity.Earlier reports showed that the accumulation of free fatty acids (FFA) led to lipo-apoptosis.1 The saturated palmitic acid does not accumulate TAG but induces cell apoptosis2 whereas the unsaturated fatty acid is incorporated into TAG.15 In our results, we observed an up-regulation of FA synthesizing genes ACC1, FAS1 and the desaturase encoding gene OLE1 in WT cells during Cd exposure (Fig. 2). We studied the TAG pattern and the gene transcription pattern under Cd stress and the gene expression results supported the increased level of UFA (Table 2). Our data showed an upregulation of LD synthesizing genes, LRO1, DGA1, ARE1, ARE2 and the simultaneously increased accumulation of TAG in WT cells (Fig. 1). Next we observed more number of LDs in Cd treated WT cells (Fig. 1D). We observed that the fatty acid esterification and storage into LDs protected the cells against fatty acid-induced lipotoxicity, and similar results were supported by others as well.2
Defects in LD formation render both the saturated and unsaturated fatty acids as equally toxic.1 During Cd exposure, a single knockout of LD synthesizing genes such as dga1Δ and lro1Δ showed a reduction in the TAG level as well as in FFA accumulation, whereas TAG accumulation was observed in are1Δ and are2Δ strains (Fig. 4). A similar trend was observed in double knockout strains during Cd exposure (Fig. 5B). Schizosaccharomyces pombe deficient in TAG synthesis undergoes lipo-apoptosis upon entry into the stationary phase. These cells show promises of an apoptotic cell death subroutine, including reactive oxygen species accumulation.37,38 The impaired LD synthesis in cells with the knockout of dga1, lro1, increased ROS formation during Cd exposure. Significant ROS accumulation was observed in the single and double mutants of dga1Δ and lro1Δ strains (Fig. 6). ROS are not only associated with cell death but also plays essential roles in signaling and adaptation to cellular stress.39 Moreover, ROS is a key regulator of necrotic or apoptotic cell death.40 We analyzed cell death using AO/EtBr staining. Early apoptotic signs were observed in TAG mutants (dga1 and lro1) (Fig. 7). The cells undergo necrosis or apoptosis, and the membrane showed increased permeability to EtBr, demonstrating an increased uptake and fluorescence with EtBr.41 This study revealed that TAG deficiency led to apoptotic cell death under Cd exposure. This was confirmed in LD quadruple mutants (QM) with the over expression of TAG synthesizing genes in QM strains (DGA1 and LRO1). When the TAG synthesizing genes were over expressed, the TAG levels were increased (data not shown), the FFA levels were ameliorated, and the ROS levels decreased (Fig. 8B). Tgl3, Tgl4, and Tgl5 are the key enzymes for TAG hydrolysis in S. cerevisiae and are responsible for TAG degradation from LDs.42,43 Our results depict an increased LD number and accumulation of TAG in TGL mutants (Fig. 9B and C). Double and quintuple knockouts (tgl3Δtgl4Δ, tgl4Δtgl5Δ and tg13Δtgl4Δtgl5Δare1Δare2Δ) demonstrated that the increase in TAG accumulation made the cells more Cd tolerant and increased cell growth (Fig. 9A). Similar results depicted that the increased formation of storage lipids increased the cell viability and the LDs.44
Sheibani et al. reported45 the excessive accumulation of FFA and its incorporation into phospholipids in various cell membranes caused severe cytotoxicity and lipo necrosis, whereas neutral lipid storage shielded the cells and alleviated FFA toxicity. Hence our results clearly indicated that the accumulation of FFA as a TAG and its storage in the form of LDs buffered the excessive FFA and increased the cell survival during external stress, especially Cd exposure.
Abbreviations
| WT | Wild-type |
| Cd | Cadmium |
| TAG | Triacylglycerol |
| LD | Lipid droplet |
| ROS | Reactive oxygen species |
| AO/EtBr | Acridine orange/ethidium bromide |
| FFA | Free fatty acids |
Acknowledgements
Infrastructure facility by DST-FIST, Biochemistry Department and confocal microscopy facility by DST-PURSE at Bharathidasan University is gratefully acknowledged. SR is supported by a fellowship from the Rajiv Gandhi National Fellowship Scheme from UGC, India. We thank Prof. Ram Rajasekharan, CSIR-CFTRI, Mysore, India, Prof. Daum Gunther, Dr K. Athenstaedt, University of Graz, Austria, and Prof. Sten. Stymne, Germany, for providing mutant strains for this work. We also acknowledge Central Instruments Facility and Services (CIFS), CFTRI, Mysore, India for helping us to conduct the GC-MS study.References
- J. Garbarino, M. Padamsee, L. Wilcox, P. M. Oelkers, D. D'Ambrosio and K. V. Ruggles, et al. , J. Biol. Chem., 2009, 284, 30994–31005 CrossRef CAS PubMed.
- L. L. Listenberger, D. S. Ory and J. E. Schaffer, J. Biol. Chem., 2001, 276(18), 14890–14895 CrossRef CAS PubMed.
- W. L. Holland, J. T. Brozinick, L. P. Wang, E. D. Hawkins, K. M. Sargent, Y. Liu, K. Narra, K. L. Hoehn, T. A. Knotts, A. Siesky, D. H. Nelson, S. K. Karathanasis, G. K. Fontenot, M. J. Birnbaum and S. A. Summers, Cell Metab., 2007, 5(3), 167–179 CrossRef CAS PubMed.
- B. Feng, D. Zhang, G. Kuriakose, C. M. Devlin, M. Kockx and I. Tabas, Proc. Natl. Acad. Sci. U. S. A., 2003, 100(18), 10423–10428 CrossRef CAS PubMed.
- T. Fujimoto, Y. Ohsaki, J. Cheng, M. Suzuki and Y. Shinohara, Histochem. Cell Biol., 2008, 130, 263–279 CrossRef CAS PubMed.
- F. Kalantari, J. J. Bergeron and T. Nilsson, Mol. Membr. Biol., 2010, 27, 462–468 CrossRef CAS PubMed.
- C. W. Wang, Cell. Mol. Life Sci., 2014, 72(14), 2677–2695 CrossRef PubMed.
- G. Daum, A. Wagner, T. Czabany and K. Athenstaedt, Biochimie, 2007, 89(2), 243–248 CrossRef CAS PubMed.
- T. Czabany, K. Athenstaedt and G. Daum, Biochim. Biophys. Acta, 2007, 1771, 299–309 CrossRef CAS PubMed.
- A. Dahlqvist, U. Stahl, M. Lenman, A. Banas, M. Lee, L. Sandager, H. Ronne and S. Stymne, Proc. Natl. Acad. Sci. U. S. A., 2000, 97, 6487–6492 CrossRef CAS PubMed.
- P. Oelkers, A. Tinkelenberg, N. Erdeniz, D. Cromley, J. T. Billheimer and S. L. Sturley, J. Biol. Chem., 2000, 275, 15609–15612 CrossRef CAS PubMed.
- P. Oelkers, D. Cromley, M. Padamsee, J. T. Billheimer and S. L. Sturley, J. Biol. Chem., 2002, 277, 8877–8881 CrossRef CAS PubMed.
- D. Sorger and G. Daum, J. Bacteriol., 2002, 184, 519–524 CrossRef CAS PubMed.
- C. F. Kurat, K. Natter, J. Petschnigg, H. Wolinski, K. Scheuringer, H. Scholz, R. Zimmermann, R. Leber, R. Zechner and S. D. Kohlwein, J. Biol. Chem., 2006, 281, 491–500 CrossRef CAS PubMed.
- J. Petschnigg, H. Wolinski, D. Kolb, G. Zellnig, C. F. Kurat, K. Natter and S. D. Kohlwein, J. Biol. Chem., 2009, 284(45), 30981–30993 CrossRef CAS PubMed.
- S. Fakas, C. Konstantinou and G. M. Carman, J. Biol. Chem., 2011, 286, 1464–1474 CrossRef CAS PubMed.
- J. Wang, H. Zhu, X. Liu and Z. Liu, J. Vet. Sci., 2014, 15(4), 485–493 CrossRef PubMed.
- A. A. Newairy, A. S. El-Sharaky, M. M. Badreldeen, S. M. Eweda and S. A. Sheweita, Toxicology, 2007, 242, 23–30 CrossRef CAS PubMed.
- L. Müller, Toxicology, 1986, 40, 285–295 CrossRef.
- E. A. Belyaeva and S. M. Korotkov, Toxicol. Appl. Pharmacol., 2003, 192, 56–68 CrossRef CAS PubMed.
- A. Lemarié, D. Lagadic-Gossmann, C. Morzadec, N. Allain, O. Fardel and L. Vernhet, Free Radicals Biol. Med., 2004, 36, 1517–1531 CrossRef PubMed.
- K. Muthukumar, S. Rajakumar, M. N. Sarkar and V. Nachiappan, Antonie van Leeuwenhoek, 2011, 99, 761–771 CrossRef CAS PubMed.
- K. Muthukumar and V. Nachiappan, Cell Biochem. Biophys., 2013, 67(3), 1353–1363 CrossRef CAS PubMed.
- S. E. Horvath, A. Wagner, E. Steyrer and G. Daum, Biochim. Biophys. Acta, 2011, 1811, 1030–1037 CrossRef CAS PubMed.
- P. Rockenfeller, J. Ring, V. Muschett, A. Beranek, S. Buettner and D. Carmona-Gutierrez, et al. , Cell Cycle, 2010, 9, 2836–2842 CrossRef CAS PubMed.
- E. G. Bligh and W. J. Dyer, Can. J. Biochem. Physiol., 1959, 37, 911 CrossRef CAS PubMed.
- M. Marone, S. Mozzetti, D. De Ritis, L. Pierelli and G. Scambia, Biol. Proced. Online, 2001, 3, 19–25 CrossRef CAS PubMed.
- W. R. Morrison and L. M. Smith, J. Lipid Res., 1964, 5, 600–608 CAS.
- H. Wolinski and S. D. Kohlwein, Methods Mol. Biol., 2008, 457, 151–163 CAS.
- L. N. Nguyen and J. D. Nosanchuk, Cell Cycle, 2011, 10(18), 3159–3167 CrossRef CAS PubMed.
- T. C. Ferreira, L. M. de Moraes and E. G. Campos, FEMS Yeast Res., 2011, 11(5), 408–417 CrossRef CAS PubMed.
- R. C. Duke, D. M. Ojcius and J. D. Young, Sci. Am., 1996, 275(6), 80–87 CrossRef CAS PubMed.
- N. Shivapurkar, J. Reddy, P. M. Chaudhary and A. F. Gazdar, J. Cell. Biochem., 2003, 88, 885–898 CrossRef CAS PubMed.
- F. Madeo, E. Frohlich and K. U. Frohlich, J. Cell Biol., 1997, 139, 729–734 CrossRef CAS PubMed.
- M. Ligr, F. Madeo, E. Frohlich, W. Hilt, K. U. Frohlich and D. H. Wolf, FEBS Lett., 1998, 438, 61–65 CrossRef CAS PubMed.
- S. Manon, Antioxid. Redox Signaling, 2004, 6(2), 259–267 CrossRef CAS PubMed.
- Q. Zhang, H. K. Chieu, C. P. Low, S. Zhang, C. K. Heng and H. Yang, J. Biol. Chem., 2003, 278, 47145–47155 CrossRef CAS PubMed.
- C. P. Low, L. P. Liew, S. Pervaiz and H. Yang, FEMS Yeast Res., 2005, 5(12), 1199–1206 CrossRef CAS PubMed.
- S. S. Vandenabeele, M. Vanderauwera, S. Vuylsteke, C. Rombauts, H. K. Langebartels, M. Seidlitz, M. Zabeau, M. Van Montagu, D. Inzé and F. Van Breusegem, Plant J., 2004, 39, 45–58 CrossRef CAS PubMed.
- D. Carmona-Gutierrez, T. Eisenberg and S. Büttner, et al. , Cell Death Differ., 2010, 17, 763–773 CrossRef CAS PubMed.
- D. Baskíc, S. Popovíc, P. Ristíc and N. N. Arsenijevíc, Cell Biol. Int., 2006, 30, 924–932 CrossRef PubMed.
- K. Athenstaedt and G. Daum, J. Biol. Chem., 2003, 278(26), 23317–23323 CrossRef CAS PubMed.
- K. Athenstaedt and G. Daum, J. Biol. Chem., 2005, 280(45), 37301–37309 CrossRef CAS PubMed.
- C. Schmidt, K. Athenstaedt, B. Koch, B. Ploier, M. Korber, G. Zellnig and G. Daum, Biochim. Biophys. Acta, 2014, 1842(10), 1393–1402 CrossRef PubMed.
- S. Sheibani, V. R. Richard, A. Beach, A. Leonov, R. Feldman, S. Mattie, L. Khelghatybana, A. Piano, M. Greenwood, H. Vali and V. I. Titorenko, Cell Cycle, 2014, 13(1), 138–147 CrossRef CAS PubMed.
| This journal is © The Royal Society of Chemistry 2017 |

