 Open Access Article
Piezoelectric poly(lactide) stereocomplexes with a cholinium organic ionic plastic crystal†
P.
Barbosa
 *a,
J.
Campos
b,
A.
Turygin
 c,
V. Y.
Shur
 c,
A.
Kholkin
 d,
A.
Barros-Timmons
 b and
F. M.
Figueiredo
 *a
*a
aCICECO – Aveiro Institute of Materials, Department of Materials & Ceramic Engineering, U. of Aveiro, Portugal. E-mail: paula.barbosa@ua.pt; lebre@ua.pt
bCICECO – Aveiro Institute of Materials, Department of Chemistry, U. of Aveiro, Portugal
cInstitute of Natural Sciences, Ural Federal University, 620000, Ekaterinburg, Russia
dCICECO – Aveiro Institute of Materials, Department of Physics, U. of Aveiro, Portugal
First published on 3rd November 2017
Abstract
This paper describes a novel method to produce poly(lactic acid) (PLA) stereocomplex (SC) crystallites directly from high molecular weight PLLA by incorporation of small quantities of choline dihydrogen phosphate ([Ch][DHP]), at room temperature. Combined results of X-ray diffraction (XRD), Fourier transform infrared spectroscopy (FTIR) and differential scanning calorimetry (DSC) confirm the formation of the PLA SC crystals. 1H NMR spectroscopy indicates a modification of the short range structural environment of choline in the blend with PLA in good agreement with the major long-range structural changes suggested by XRD, both suggesting a direct role of the choline in the PLA stereocomplexation. The electrical conductivity of these membranes measured using impedance spectroscopy is in the 6 × 10⁻⁷–4 × 10⁻⁶ S cm−1 range, which increases with increasing choline content and with increasing relative humidity (RH). The dependence on RH is weaker than for pure PLA, thus suggesting that the SC enhances the hydrophobic character of PLA, in agreement with contact angle measurements. Atomic force microscopy (AFM) and piezoresponse force microscopy (PFM) reveal a new phase with piezoelectric properties at the microsphere interfaces, with d33 corresponding to ∼60% of d33 of a periodically poled lithium niobate reference, which is directly related to the formation of SC crystalline domains. This first report of intrinsic piezoelectricity in PLA stereocomplexes opens the possibility for the development of new types of bio-based piezoactive polymers.
1. Introduction
Poly(lactic acid) (PLA) is a biodegradable polymer with extensive applications in textiles or packaging.1,2 This biopolymer is also very promising for a number of pharmaceutical and medical applications, including suture, bone fixation material, drug delivery, and tissue engineering, where its piezoelectric activity can be used for bone growth and regeneration or neural recovery.1–3Based on its piezoelectric characteristics, PLA has also been studied for application in pressure-sensitive displays.4,5 Although the piezoelectric constant of PLLA is lower than that of piezoelectric ceramics due to the nonuniform structure in the PLLA film (high-order structure), it is possible to improve the piezoelectricity of PLLA films by adding inorganic nanoparticles.6,7 PDLA/PLLA multilayer films can also be engineered to exhibit strong piezoelectric resonance and a piezoelectric performance equivalent to those of piezoelectric ceramics.8 Piezoelectricity in PLA is related to the ordering of carbonyl group dipoles existing in each repeating unit, either by poling at high temperature to form polar crystals, or by mechanically stretching the material to induce shear piezoelectricity.9,10
PLA displays some disadvantages: it exhibits slow crystallization kinetics and a relatively low heat distortion temperature (∼60 °C), which limits its thermo-mechanical stability, and it is somewhat brittle.1 The latter characteristic may be improved by blending with plasticizers (e.g. oligomeric lactic acid, polyglycerol esters, triacetin or citrate esters).11,12 Ionic liquids (ILs) have also been evaluated as potential plasticizers and/or lubricants for PLA. Park et al. investigated phosphonium type ILs with decanoate and tetrafluoroborate anions, achieving good miscibility in the PLA matrix, improved lubrification for the decanoate anion and an increase in the thermal stability for the tetrafluoroborate anion.13 Chen et al. reported that PLA modified with the [PF6] anion and imidazolium cations with longer carbon chains have enhanced ductility.14
The thermo-mechanical properties of PLA are also improved in blends of poly(L-lactic acid) (PLLA) and poly(D-lactic acid) (PDLA), which result in the formation of stereocomplexes (SCs) due to the strong interaction between L-lactyl and D-lactyl unit sequences.15–17 The crystallization of these SCs was found to enhance the mechanical performance and hydrolytic/thermal degradation-resistance of PLA-based materials.15,16,18 SCs are usually formed in solution during solvent evaporation or precipitation, or in the absence of solvents by direct melt blending or during bulk polymerization.16 Homocrystallization and SC crystallization between complementary enantiomers are competing processes, and while stereocomplexation is thermodynamically more favorable than homocrystallization, it is also associated with a larger kinetic barrier. Thus, homocrystallization prevails over stereocomplexation for high molar weight PLA.16 Repeated casting,19 the use of supercritical CO2 fluid,20 polymorphic phase transition,21 incorporation of fillers and solvents,16 and addition of ionic liquids22 are also effective ways to promote stereocomplexation in PLA. An initial equimolar mixture of PLLA and PDLA generally promotes complete stereocomplexation,16 but SC crystallites tend to form even with a non-equimolar PLLA/PDLA ratio.23 Interestingly, Zhu et al. demonstrated that the presence of an ionic liquid enhances the molecular mobility and mutual diffusion and thus tends to reduce the kinetic barrier for SC crystallization during cooling of the mixed solution.22
In this study, a new approach is demonstrated to produce SC crystallites from high molecular weight PLLA/cholinium-based blends, without the traditional addition of PDLA. Cholinium-based materials are of crescent interest in diverse application areas given their biocompatibility, excellent biodegradability and low toxicity.24,25 Furthermore, choline dihydrogen phosphate ([Ch][DHP]) is an organic plastic ionic crystalline material (OIPC) with good thermal stability and high conductivity in the plastic phase.26,27 Therefore, in addition to studying the crystallization and general properties of high-molecular-weight PLLA/[Ch][DHP] blends, we also report on the electrical conductivity and piezoelectric response of these materials to further help understanding the mechanisms involved and to tap potential applications namely where ionic conductivity and piezoelectricity may be of interest.
2. Experimental
2.1. Materials
Injection molding grade poly(lactic acid) was kindly supplied by Corbion Purac (stereochemical purity: min. 99% L-isomer). This PLA presented Mn ∼ 100![[thin space (1/6-em)]](https://www.rsc.org/images/entities/char_2009.gif) 000 g mol−1 determined by size exclusion chromatography against PS standards and Đ ∼ 1.3.28 Choline dihydrogen phosphate ([Ch][DHP], >98%) was purchased from Iolitec, and methylene chloride (DCM, CH2Cl2, 100%) from VWR Chemicals. All reagents were used without previous purification.
000 g mol−1 determined by size exclusion chromatography against PS standards and Đ ∼ 1.3.28 Choline dihydrogen phosphate ([Ch][DHP], >98%) was purchased from Iolitec, and methylene chloride (DCM, CH2Cl2, 100%) from VWR Chemicals. All reagents were used without previous purification.
2.2. Preparation of PLA/[Ch][DHP] blends
Blends of PLA and [Ch][DHP] (chemical structures in Fig. 1) were prepared by the solution casting technique using DCM as the common solvent. PLA and [Ch][DHP] were dissolved separately in DCM under magnetic stirring at room temperature for 8 h. These solutions were mixed using magnetic stirring for 24 h at room temperature and in an ultrasonic bath for 10 min at intervals of 4 h, in predetermined ratios to obtain blends designated as PLA/[Ch][DHP]x, where x = 0, 5, 10 or 20 is the weight percent of [Ch][DHP] relative to the weight of the polymer matrix.The PLA/[Ch][DHP]20 sample took about 3 weeks for achieving the same homogeneity level of the other compositions, which provides an indication of the slow dissolution kinetics. The solutions were cast onto glass plates and the solvent was allowed to evaporate at room temperature. The obtained membranes were peeled off from the glass and further dried in an oven at 60 °C for several days to completely remove the residual solvent. The pure PLA, PLA/[Ch][DHP]5 and PLA/[Ch][DHP]10 samples were obtained as free-standing membranes (approximately 200 μm thick) and the PLA/[Ch][DHP]20 sample was obtained in the powder form.
2.3. Sample characterization
The morphology and elemental composition of the samples were characterized using scanning electron microscopy (SEM) on a HITACHI SU-70 microscope equipped with a Bruker Quantax 400 detector for energy-dispersive spectroscopy (EDS). The samples were previously coated with a carbon film.X-ray diffraction (XRD) measurements were performed at room temperature on a PANalytical Empyrean powder diffractometer (CuKα1,2 X-radiation, λ1 = 1.540598 Å, λ2 = 1.544426 Å) equipped with a PIXcel 1D detector and a flat-plate sample holder in a Bragg–Brentano para-focusing optic configuration (45 kV, 40 mA). The patterns were collected in transmission mode using the step-counting method (step: 0.026°) in the 5° ≤ 2θ ≤ 40° range.
Infrared spectra were acquired on a Bruker IFS55 FTIR spectrophotometer using a single reflectance ATR cell (Golden Gate, equipped with a diamond crystal). All data were recorded at room temperature in the 4000–350 cm−1 spectral range, by averaging 256 scans at a maximum resolution of 2 cm−1.
The thermal properties of the samples were determined using thermogravimetric analysis (TGA) and differential scanning calorimetry (DSC). The TGA measurements were performed on a Shimadzu TGA-50 thermal analyzer under a nitrogen atmosphere from room temperature to 700 °C at a heating rate of 10 °C min−1 with a flow rate of 20 mL min−1. DSC scans were carried out on a Shimadzu DSC-50 calorimeter under flowing nitrogen from room temperature to 250 °C using a heating rate of 5 °C min−1 and a flow rate of 20 mL min−1 and a cooling rate of 5 °C min−1.
NMR spectra were recorded on Bruker Avance 300 or 500 spectrometers (300.13 for 1H and 75.47 MHz for 13C), using CDCl3, CD2Cl2 and D2O as solvents. All chemical shifts are expressed as parts per million and referenced to the residual solvent signal (CDCl3: δH = 7.26, δC = 77.16; CD2Cl2: δH = 5.32, δC = 53.85; D2O: δH = 4.79).
The through-plane electrical conductivity of the membranes was determined using impedance spectroscopy using an Agilent E4980A precision LCR meter and an ACS DY 110 climatic chamber allowing variable temperature (from 40 °C to 94 °C) and relative humidity (RH) (from 20% to 98%). Circular silver electrodes (∼0.5 cm2) were applied on both sides of the membranes by painting them with a commercial paste (Agar Scientific), which was then placed between two carbon cloth gas diffusion layers and graphite plates with gas channels. The current was collected on top of both plates with platinum foils and connected to the LCR meter by platinum wires and co-axial cables using a pseudo-4-electrode configuration. Impedance spectra were collected between 20 Hz and 2 MHz with a test signal amplitude of 100 mV and analysed with ZView (Version 2.6b, Scribner Associates) to assess the ohmic resistance (R), which is taken as the amplitude of the semicircle in the Nyquist plots. The R values are then normalized to the sample's geometry to calculate the conductivity through the usual formula σ = L(RA)−1, where L is the thickness of the sample (in the dry state) and A is the surface area of the electrodes.
Contact angles (α) were measured at room temperature on a DataPhysics OCA20 instrument using the sessile drop method (drop volume ∼2.0 μL). Measurements were carried out 5 s after deposition of the water droplet to ensure the attainment of equilibrium. Each reported value is the average of more than three independent determinations.
Atomic force microscopy (AFM) and piezoresponse force microscopy (PFM) investigations were performed on an Asylum Research MFP-3D atomic force microscope at room temperature under ambient conditions. NSG01 probes (typical radius curvature of the tip about 10 nm) from NT-MDT were used for imaging the patterned structures. The topography measurements were performed in tapping mode with a typical force constant of 1.5–15 N m−1 and a resonant frequency of 87–230 kHz. The PFM experiments were performed at a frequency of 20 kHz and an applied AC voltage of 10 V, using DPER18 Ti/Pt tips from MikroMasch.
3. Results and discussion
3.1. Composition, structure and microstructure
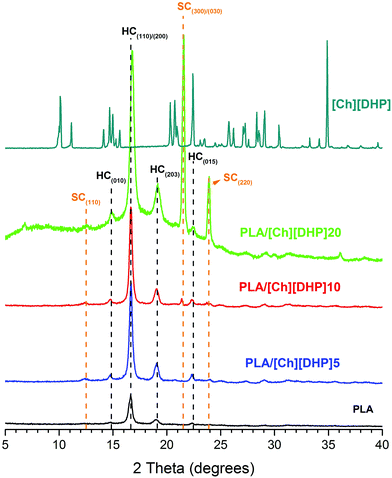
Fig. 2 shows the XRD patterns of the prepared samples. The diffraction peaks of PLA homocrystals (HCs) are observed for PLA and PLA/[Ch][DHP], and can be assigned to the α-form of PLA, which crystallizes in a pseudo-orthorhombic P212121 space group with unit cell dimensions of a = 1.07 nm, b = 0.595 nm and c = 2.78 nm.2,29 Additional reflections at 2θ = 12.3°, 21.3° and 23.9° appear in the patterns of the PLA/[Ch][DHP] blends. These reflections can be indexed to the triclinic cell of PLA stereocomplexes (space group P1, lattice parameters a = b = 0.916 nm, c = 0.870 nm, α = β = 109.2° and γ = 109.8°), in which the L-lactide and D-lactide segments are packed in parallel with a 31 helical conformation.29 It can also be seen that the intensities of these reflections increase with increasing [Ch][DHP] content, which indicates that stereocrystallization in these PLA blends is triggered by the choline.This is particularly evident for PLA/[Ch][DHP]20, where the narrower peaks (at half peak height) of the SC reflections suggest that SC crystallites are larger than the HCs of the initial PLA. The PLA/[Ch][DHP]20 pattern also depicts a broad band indicative of the presence of amorphous matter, which is not apparent in any of the other patterns. This may correspond to an increase of the fraction of amorphous PLA resulting from the extensive crystal reorganization leading to SCs, and to an extensive loss of order in the [Ch][DHP]. Indeed, Fig. 2 shows that the sharp reflections of pure [Ch][DHP] are not matched on the patterns of the blends (noticeably on PLA/[Ch][DHP]20), suggesting the destruction of the long-range order of the choline crystals. Another, yet subtle, feature is apparent upon closer inspection of the PLA reflections, which shows that the intensity ratio between the doublet (110) + (200) and the smaller (203) reflection decreases from about 6 in PLA/[Ch][DHP]10 to 4 in the pattern of PLA/[Ch][DHP]20. This may indicate some sort of preferential orientation of the PLA crystals. While this is difficult to analyze in detail because of the large background shift and especially because PLA/[Ch][DHP]20 is actually in the powder form, it raises the possibility for a cooperative molecular orientation with potential impact on the material piezoelectric behavior.30,31
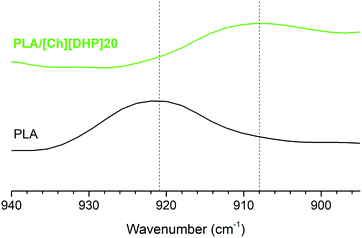
The stereocrystallization could be verified using FTIR-ATR, as illustrated by the spectral region of the skeletal stretching and –CH3 rocking shown in Fig. 3.
The band at 921 cm−1 observed in the spectrum of pure PLA typical of the 103 helix of HCs almost disappears for PLA/[Ch][DHP]20, where a new band emerges at 908 cm−1, confirming the presence of the 31 helix of SCs.32 As the [Ch][DHP] content in PLA/[Ch][DHP]5 and PLA/[Ch][DHP]10 is rather low, this effect is too small to be observed in FTIR-ATR experiments. The complete FTIR-ATR spectra displayed in Fig. S1 of the ESI† additionally show a shift from 1749 cm−1 to 1756 cm−1 of the ν(C![[double bond, length as m-dash]](https://www.rsc.org/images/entities/char_e001.gif) O) band in PLA/[Ch][DHP]20. This band is known to be highly sensitive to the crystal structure, and is a further indication of the formation of PLA stereocomplexes.32
O) band in PLA/[Ch][DHP]20. This band is known to be highly sensitive to the crystal structure, and is a further indication of the formation of PLA stereocomplexes.32
Analyses by 1H and 13C NMR spectroscopy confirmed only the presence of the expected blend components (Fig. S2–S4, ESI†). The 1H NMR spectrum of PLA/[Ch][DHP]20 shows the presence of both PLA and [Ch][DHP] in the blend, which maintained their chemical shifts and relative proportions. The signal at 1.5 ppm (Hb) was assigned to the CH3 protons and the peaks at 5.1 ppm (Ha) were attributed to the CH proton of PLA. The characteristic peaks of [Ch][DHP] were noticeable at 3.2 ppm (Ha), 3.5 ppm (Hb) and 4.0 ppm (Hc). These assignments are in agreement with the literature.33,34 However, the difference in the proton couplings of choline methylene peaks (Hb and Hc) registered for the pure choline and in the blend indicates a significant difference in the short range structural environment. Furthermore, the presence of the peak at 6.87 ppm in the 1H NMR spectrum of PLA/[Ch][DHP]20 was identified as trapped residual water as it disappeared upon exchange with D2O. The presence of bound water in PLA/[Ch][DHP]20 was also confirmed by thermal analysis where a mass loss is detected above 100 °C (Fig. S8, ESI†). The modification of the short range structural environment of the choline in the blend with PLA indicated by the 1H NMR data is in good agreement with the major long-range structural changes displayed by the XRD patterns (Fig. 2). Both results thus suggest a direct role of the choline in the PLLA/PDLA stereocomplexation. The 13C NMR spectroscopy carried out under the conditions used did not bring any complementary information to that available in the literature.
Fig. 4 shows the DSC traces obtained for the pure compounds and the blends.
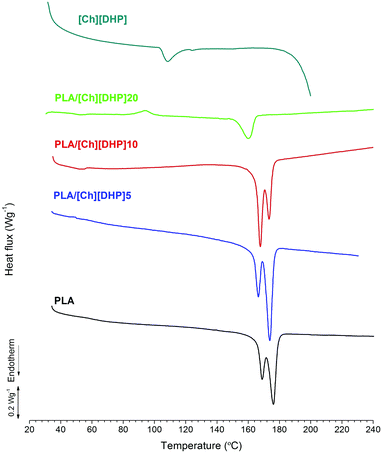 | ||
| Fig. 4 DSC thermograms of pure PLA and [Ch][DHP], and PLA/[Ch][DHP] blends during a second heating run. | ||
Pure [Ch][DHP] shows an endothermic feature at ∼110 °C, which is ascribed to a solid–solid phase transition, while the onset of a strong endothermic event starting above 180 °C is due to melting.35 Pure PLA also behaves as expected, showing a couple of endothermic peaks at 165 °C and 175 °C corresponding to the melting of PLA. The reason for the peak splitting can be traced to the existence of two types of PLLA crystals: one that melts at the lower temperature and is smaller in size and formed at the surface of the stereocomplex crystals, and the other type consisting of larger and more perfect PLLA crystals that melt at the higher temperature.36 The DSC trace of pure PLA indicates the predominance of the second type of larger PLLA crystal, whereas the addition of [Ch][DHP] leads to an increase of the relative area of the low temperature endothermic peak, suggesting an increase of the fraction of smaller PLLA crystals with increasing [Ch][DHP] content. As discussed by Yamane et al.,36 smaller and disordered PLLA crystals are likely to form on the surface of the stereocomplex crystallites, which we have indeed observed to form in the blends (Fig. 1). The PLA/[Ch][DHP]20 sample appears as an extreme case where the single melting endotherm at 160 °C suggests that most of the larger PLLA crystals were dissolved in a process mediated by [Ch][DHP]. In fact, the DSC traces reveal major changes in the [Ch][DHP] blended with the PLA, namely the vanishing of the endothermic solid–solid phase transition, observed at 110 °C in the pure compound, and of the melting above 180 °C. This observation suggests that [Ch][DHP] is predominantly amorphous in the blends, in agreement with the loss of crystallographic order observed using XRD (Fig. 1). Another distinctive feature of the PLA/[Ch][DHP]20 DSC trace is a “cold” crystallization with a peak temperature (Tc) at ∼95 °C. In order to minimize homocrystallization and to gain insight into the thermal and structural behavior of the SC crystals, the PLA/[Ch][DHP]20 sample was rapidly heated to 250 °C and then quenched in liquid nitrogen for subsequent analysis by XRD and DSC. The XRD pattern of the quenched sample displays only the SC reflections (Fig. S6, ESI†), thus indicating the amorphisation of the PLA homocrystals. The DSC exothermic peak at ∼90 °C of the quenched PLA/[Ch][DHP]20 (Fig. S7, ESI†) confirms the cold crystallization of the amorphous PLA fraction, which was already detectable in the XRD pattern collected before the quenching (Fig. S6, ESI†). The melting endotherm of the quenched PLA/[Ch][DHP]20 displays one single peak at ∼175 °C, which indicates that most of the “cold” crystallization of the PLA during DSC heating leads to the formation of large PLLA crystals. These facts may suggest that, for low choline concentrations, SC crystals and [Ch][DHP] have a cooperative effect on the crystallization of PLLA. Over a certain [Ch][DHP] concentration (i.e. higher than 10 wt%), due to the enhanced molecular mobility of the polymer chains, the kinetic barrier for SC formation is eliminated and one observes extensive stereocrystallization.
TGA results of all the samples prepared show that all the membranes are thermally stable up to ∼180 °C, i.e. the thermal stability of pure [Ch][DHP]. This ensures potential applications of these compositions in fields that require reasonably high temperatures, especially if the percentage of [Ch][DHP] used is low. Indeed, below 10 wt% no major signs of weight losses are observed (Fig. S8, ESI†).
Tsuji et al. noted that SC crystallites can be formed from the pair of PDLA and PLLA with a higher molecular weight upon aging the solution at a high constant concentration before casting.37 Taking this fact into account and due to the use of ultrasounds during blend preparation, a new PLA membrane was prepared without addition of [Ch][DHP]. PLA was dissolved in DCM and the solution was aged for 3 weeks, as in the case of the PLA/[Ch][DHP] (20 wt%) sample. Also, ultrasounds were used for ∼4 h in total. FTIR-ATR and XRD results did not show any significant differences between the new PLA membrane and the membrane prepared initially, both with no signs of SC (Fig. S9 in the ESI†). This confirms that the stereocrystallization results obtained exclusively from the addition of choline and not from the solution aging or the intense use of ultrasounds.
Ionic liquids have been used to promote the formation of SCs from PLA starting from an equimolar mixture of high molecular weight enantiomeric PLLA and PDLA.22,38,39 The present contribution shows that the stereocomplexation of PLA can also be promoted by choline on what is essentially just PLLA (we recall that the D-lactide content in the polymer matrix is less than 1%). This may result from an enhanced molecular mobility and mutual diffusion of the enantiomeric polylactides due to the presence of choline ions, which reduce or eliminate the kinetic barrier stereocrystallization, in accordance with Zhu et al.22 The choline may also act as a “local physical crosslinker” as proposed by Mehta et al. for similar interactions in the helical structure of collagen.40 Nevertheless, it should be noted that in this case the medium was different and the strength of interactions should be stronger.
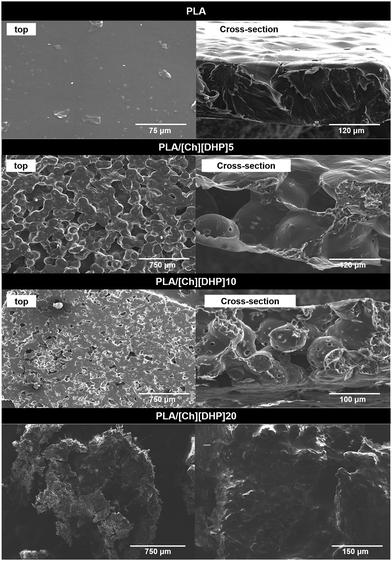
According to the SEM micrographs in Fig. 5, pure PLA shows a homogenous morphology, whereas the blends with [Ch][DHP] display a spherulitic structure, suggesting that phase separation occurs between PLA and the choline.
This is in line with previous reports of precipitation of uniform microspheres of SCs from dispersions of oligomeric PLLA and PDLA, and from linear PDLA, both functionalized with imidazolium end groups.39 The strongly hydrophobic character of PLA may have contributed to forcing the polymer phase to solidify into spherical forms (upon the evaporation of the solvent), thus minimizing the surface area and interfacial tension with the choline, which is highly hydrophilic. The diameter of the microspheres decreases with choline additions, from 100 μm in PLA/[Ch][DHP]5 to 50–60 μm in PLA/[Ch][DHP]10. The addition of 20 wt% destroys the mechanical integrity of the membrane and the SEM analysis of PLA/[Ch][DHP]20 reveals a material in the form of a coarse powder with apparent homogeneity on each particle. Apart from a few tiny micron-sized particles dispersed on the surface, the EDS mapping of phosphorus is not conclusive about the distribution of [Ch][DHP] within the PLA matrix (Fig. S10 and S11 in the ESI†). Obviously, EDS cannot distinguish the SC from the PLLA as detected using XRD.
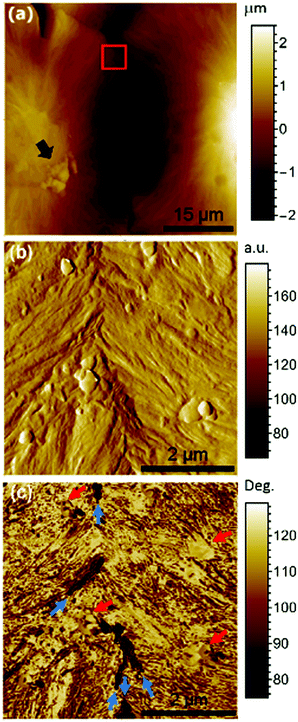
AFM analysis was performed to gain insight into the phase distribution. Fig. 6(a) shows a typical topography image of the surface of the PLA/[Ch][DHP]10 membrane, where the arrow points to a small agglomerate that may be correlated with the phosphorus-rich features observed using SEM/EDS.
Zooming in on a relatively flat region of the interface, the tapping mode reveals small circular entities (highlighted by the red arrows), which again resemble phosphorus-rich particles. The phase shift of the DFL signal also reveals some new features as dark domains preferentially aligned with the interface (blue arrows) that one may tentatively ascribe to the SC crystals.
3.2. Electrical conductivity
To go deeper into the understanding of the mobility of the [Ch][DHP] ions, expectedly in close relation to the structure, the electrical conductivity of the samples was measured assuming that it is essentially of ionic nature. Fig. S12 (ESI†) shows typical impedance spectra and Bode plots for PLA and PLA-based blends obtained at 80% and 98% RH for various temperatures ranging from 40 °C up to 94 °C. The spectra display a dominant semicircle, with their amplitude corresponding to the electrical resistance used to obtain the electrical conductivity of the membranes. These values obtained under variable relative humidity conditions are plotted in Arrhenius coordinates in Fig. 7.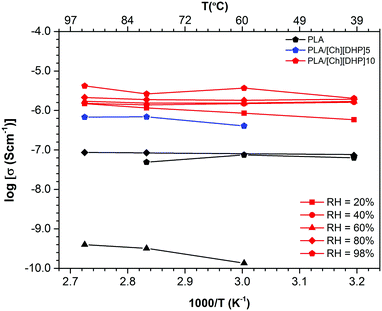 | ||
| Fig. 7 Arrhenius plots for the protonic conductivity of (black) pure PLA, (blue) PLA/[Ch][DHP]5, and (red) PLA/[Ch][DHP]10 measured under variable RH. | ||
As expected, PLA is a poor conductor, having a conductivity under 10−7 S cm−1 even under high relative humidity (80–98%) in agreement with the strong hydrophobic character of this material. The conductivity decreases significantly for 60% RH (less than 10−9 S cm−1), thus suggesting that PLA is essentially a dielectric with the observed conductivity resulting mainly from proton or hydroxyl transport along physisorbed water molecules. The activation energy of ∼10 kJ mol−1 is low and in line with what is expected for proton or hydroxyl conduction in water. Despite the very high electrical resistance of pure PLA at low RH (precluding measurements at RH lower than 60%), one notes an apparent bending of the Arrhenius at 60% RH that may be an indication of Vogel–Fulcher–Tamman (VTF) behavior linked to the glass transition temperature of PLA (about 65 °C).1 In fact, measurements at temperatures below 60 °C (at 60% or less RH) were impossible due to sample resistances well above the mega-Ohm range, which reinforces the possibility of VTF-type behavior at low RH resulting from the viscous flow of PLA chains assisting anionic transport due to the terminal hydroxyl groups of PLA. Nevertheless, the conductivity levels made possible by this mechanism are lower than 10−9 S cm−1, and therefore it should be minor in comparison to transport along adsorbed water expected to be dominant at high RH.
The addition of 5 wt% [Ch][DHP] increases the ionic conductivity at 98% RH of PLA by nearly one order of magnitude, and the sample with 10% [Ch][DHP] sees an additional increment of similar magnitude. Contrary to pure PLA, the conductivity of the PLA/[Ch][DHP] blends shows weak humidity-dependence, which indicates a minor contribution of proton transport along adsorbed water molecules. These results are in agreement with contact angle measurements which show a considerable enhancement of the hydrophobic nature of the PLA surface upon addition of 10 wt% [Ch][DHP], with a concomitant increase in the contact angle (Table S1, in the ESI†). Likewise, evidence for VTF behavior is not apparent in those samples, again suggesting that the contribution of the viscoelastic flow assisting charge transport is negligible also in the case of the composites. These observations suggest that electric transport in PLA/[Ch][DHP] blends is essentially due to the [Ch][DHP], trapped water molecules, or a combination of both. The higher conductivity of [Ch][DHP] at 100 °C is in line with our measurements for the blends with PLA (expectedly with lower conductivity since PLA is a very poor conductor). Yet, the room temperature conductivity of PLA/[Ch][DHP] is higher than that for pure [Ch][DHP] crystals measured by Yoshizawa-Fujita and co-workers (in the 10−6–10−4 S cm−1 range between room temperature and 100 °C26) which is linked to the activation energy found in both cases (∼10 kJ mol−1 for the membranes and 60 kJ mol−1 for pure [Ch][DHP]26). Such an apparent difference in the conduction mechanism may be related to phase transitions in the [Ch][DHP]. In fact, the XRD patterns shown in Fig. 2 suggest a substantial loss of crystallinity of the [Ch][DHP] in the blend at room temperature, which may be correlated with the formation of a liquid-like [Ch][DHP] phase with a higher defect concentration and thus with enhanced conductivity and lower activation energy in comparison to the neat plastic crystal, as observed for other organic ionic plastic crystals.41 The trapped residual water molecules detected by 1H NMR (Fig. S4, ESI†), which are likely to be in the vicinity of the choline molecules, may also play a role in enhancing the conductivity of the [Ch][DHP]/PLA blends (especially for low humidity), either ensuring proton transport themselves or facilitating diffusion of the choline molecules.
3.3. Piezoelectric response
Yoshida et al. reported a slight improvement in the piezoelectric modulus (d′) below Tg (65–70 °C) in a PLLA composite film with only 10% SC crystals.42 We have thus looked at the effect of [Ch][DHP] on the piezoelectric response of the membranes measured using piezoresponse force microscopy (PFM). Fig. 8 compares the PFM results for pure PLA and PLA/[Ch][DHP]10.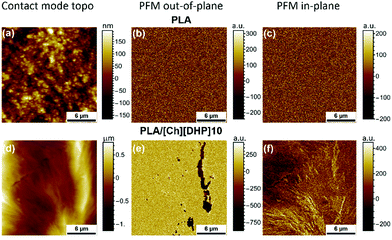 | ||
| Fig. 8 PFM images (both out-of-pane and in-plane) of pure (a)–(c) PLA and (d)–(f) PLA/[Ch][DHP]10 membranes. | ||
No local piezoelectric activity is observed in PLA (Fig. 8b), in line with the absence of a macroscopic piezoelectric response expected for the α-PLLA structure, where the C=O dipoles are oriented in all directions. In contrast, PLA/[Ch][DHP]10 shows well defined piezoactive areas at the interfaces between microspheres (Fig. 8e), possibly due to a different crystallographic structure associated with the formation of SC domains confirmed by the AFM topography mapping shown in Fig. 6. The data are supported by the piezoresponse histograms (Fig. S13, ESI†).43 Table S2 (ESI†) shows the values of effective piezoelectric coefficients in comparison with a standard periodically poled lithium niobate (PPLN) sample (d33 = 7.5 pm V−1), with the PLA/[Ch][DHP]10 sample attaining quite a significant d33 of 4.1 pm V−1.
These results suggest that at a mesoscopic level the observed piezoelectric activity depends mainly on the local degree of orientation of SC crystallites, since the volume of SC crystals in PLA/[Ch][DHP]10 is not expected to be too high.44 Nevertheless, contrast variations in the in-plane and out-of-plane PFM images are possible due to the presence of oriented domains with an average size of approximately 100 μm and height over 6 μm (above the AFM z range), which is in agreement with the results presented above. These piezoactive regions are thus likely to correspond to the SC crystallite domains. Unfortunately, since the sample using 20 wt% [Ch][DHP] was in the powder form it was not possible to measure its piezoresponse.
To the best of our knowledge this is the first report of intrinsic piezoelectricity in PLA SCs, which may explain the aforementioned enhancement of macroscopic piezoelectricity in PLA reported by Yoshida et al.42 The origin of the piezoactivity of the SC domains in PLA/[Ch][DHP] blends is still unclear, but it is probably related to the fact that PLLA chains and the residual PDLA chains crystallize via intermolecular interactions triggered by the presence of choline (and water), which seems to have a double role as a plasticizer and as a “local physical cross-linker”. In this case, choline cations oriented and confined within the SC structure in a cooperative manner could originate from the observed nanoscale polarization, as recently suggested for ferroelectric ionic plastic crystals of quinuclidinium perrhenate.45 A recent report of the incipient ferroelectricity of oriented water molecules confined to the nano-channels of a crystal raises the possibility that also the residual water trapped by choline in the stereocomplex structures could contribute to the observed PFM signal.46 The piezoresponse could also result from a local distortion of the PLLA and PDLA molecules in the SC, which could have a stretching effect similar to changes in the orientation of the C![[double bond, length as m-dash]](https://www.rsc.org/images/entities/char_e001.gif) O dipoles occurring in the shear ferroelectricity of PLA,9,10 or a confinement-induced cooperative molecular orientation,30,31 given the particular location of the SC at the spherulitic interfaces. Further detailed studies of the composition, structure and local piezoresponse of samples with large SC crystalline domains are necessary in order to clarify the underlying mechanism behind the observed PFM data, and, if possible, to fully exploit the potential of PLA SCs to produce new materials with the controlled piezoelectric performance for biomedical applications. These include, for example, wearable devices47 or piezoelectric scaffolds.48 A strong vertical piezoresponse shown in Fig. 8e suggests the great potential of PLA SCs for these applications.
O dipoles occurring in the shear ferroelectricity of PLA,9,10 or a confinement-induced cooperative molecular orientation,30,31 given the particular location of the SC at the spherulitic interfaces. Further detailed studies of the composition, structure and local piezoresponse of samples with large SC crystalline domains are necessary in order to clarify the underlying mechanism behind the observed PFM data, and, if possible, to fully exploit the potential of PLA SCs to produce new materials with the controlled piezoelectric performance for biomedical applications. These include, for example, wearable devices47 or piezoelectric scaffolds.48 A strong vertical piezoresponse shown in Fig. 8e suggests the great potential of PLA SCs for these applications.
4. Conclusions
A novel method to obtain SC crystallites by blending high molecular weight PLLA with small quantities of [Ch][DHP] is described. This simple and sustainable synthetic procedure is potentially cost-effective when compared to conventional melt blending procedures, and it does not involve mixing with PDLA. The stereocrystallization was confirmed by XRD, FTIR-ATR and DSC. AFM phase images suggest that domains of PLA stereocomplexes are localized at the interface of PLA spherulites. Choline is likely to have a role as a plasticizer and as a “local physical cross-linker”, promoting the stereocomplexation of PLA, as suggested by XRD and 1H NMR data revealing major structural differences in the choline blended with PLA. The incorporation of 10 wt% choline ionic plastic crystals into PLA also increases the electrical conductivity by approximately two orders of magnitude, with the blend membrane reaching ∼4 × 10⁻⁶ S cm−1 at 98% RH and 94 °C. On the other hand, the weaker humidity-dependence of the conductivity of the blends suggests that the PLA stereocomplex enhances the hydrophobicity of PLA, in agreement with contact angle measurements. AFM topography and PFM data reveal well defined piezoactive regions at the interfaces between PLA spherulites, which are thus correlated with the SC domains localized at those interfaces. To the best of our knowledge this is the first report of intrinsic piezoelectricity in PLA SC and may represent an opportunity to develop new types of bio-based piezoelectric polymers. The underlying mechanism for piezoelectricity in PLA stereocomplexes remains to be studied.Conflicts of interest
There are no conflicts to declare.Acknowledgements
FCT/MEC is acknowledged for the financial support to the CICECO-Aveiro Institute of Materials (Ref. FCT UID/CTM/50011/2013, POCI-01-0145-FEDER-007679) and to project UniRCell (Ref. SAICTPAC/0032/2015, POCI-01-0145-FEDER-016422), through national funds and when applicable co-financed by FEDER under the PT2020 Partnership Agreement. FCT also supports the individual grants IF/01174/2013, SFRH/BPD/96665/2013 and SFRH/BPD/85811/2012. The choline dihydrogen phosphate, [Ch][DHP], was kindly supplied by João A. P. Coutinho's research group at the CICECO-Aveiro Institute of Materials, Portugal. The authors would like to appreciate Artur Silva from the Chemistry Department of the University of Aveiro for the helpful discussion of the 1H NMR spectra.Notes and references
- Poly(Lactic Acid): Synthesis, Structures, Properties, Processing, and Applications, ed. R. Auras, L.-T. Lim, S. E. M. Selke and H. Tsuji, John Wiley & Sons, Inc., Hoboken, NJ, USA, 2010 Search PubMed.
- R. Auras, B. Harte and S. Selke, Macromol. Biosci., 2004, 4, 835–864 CrossRef CAS PubMed.
- V. Sencadas, C. Ribeiro, A. Heredia, I. K. Bdikin, A. L. Kholkin and S. Lanceros-Mendez, Appl. Phys. A: Mater. Sci. Process., 2012, 109, 51–55 CrossRef CAS.
- M. Ando, H. Kawamura, H. Kitada, Y. Sekimoto, T. Inoue and Y. Tajitsu, Jpn. J. Appl. Phys., 2013, 52, 09KD17 CrossRef.
- S. Ito, K. Imoto, K. Takai, S. Kuroda, Y. Kamimura and T. Kataoka, Jpn. J. Appl. Phys., 2012, 51, 09LD16 CrossRef.
- V. A. Online, K. May, A. Eremin, R. Stannarius, S. Klein, K. Neyts and J. Harden, RSC Adv., 2014, 4, 44223–44228 RSC.
- M. Varga, J. Morvan, N. Diorio and J. Harden, Appl. Phys. Lett., 2013, 102, 153903 CrossRef.
- J. Takarada, T. Kataoka, K. Yamamoto and Y. Tajitsu, Jpn. J. Appl. Phys., 2016, 55, 04EA07 CrossRef.
- Q. Y. Pan, S. Tasaka and N. Inagaki, Jpn. J. Appl. Phys., 1996, 35, L1442–L1445 CAS.
- E. Fukada, IEEE Trans. Electr. Insul., 2006, 13, 1110–1119 CrossRef CAS.
- R. M. Rasal, A. V. Janorkar and D. E. Hirt, Prog. Polym. Sci., 2010, 35, 338–356 CrossRef CAS.
- K. Anderson, K. Schreck and M. Hillmyer, Polym. Rev., 2008, 48, 85–108 CrossRef CAS.
- K. Park, J. U. Ha and M. Xanthos, Polym. Eng. Sci., 2010, 50, 1105–1110 CAS.
- B. K. Chen, T. Y. Wu, Y. M. Chang and A. F. Chen, Chem. Eng. J., 2013, 215–216, 886–893 CrossRef CAS.
- Y. Jing, C. Quan, B. Liu, Q. Jiang and C. Zhang, Polym. Rev., 2016, 56, 262–286 CrossRef CAS.
- H. Tsuji, Adv. Drug Delivery Rev., 2016, 107, 97–135 CrossRef CAS PubMed.
- B. H. Tan, J. K. Muiruri, Z. Li and C. He, ACS Sustainable Chem. Eng., 2016, 4, 5370–5391 CrossRef CAS.
- S. R. Andersson, M. Hakkarainen, S. Inkinen, A. Södergård, A.-C. C. Albertsson, A. Sö and A.-C. C. Albertsson, Biomacromolecules, 2010, 11, 1067–1073 CrossRef CAS PubMed.
- H. Tsuji and S. Yamamoto, Macromol. Mater. Eng., 2011, 296, 583–589 CrossRef CAS.
- P. Purnama and S. H. Kim, Macromolecules, 2010, 43, 1137–1142 CrossRef CAS.
- J. Zhang, K. Tashiro, H. Tsuji and A. J. Domb, Macromolecules, 2007, 40, 1049–1054 CrossRef CAS.
- J. Zhu, B. Na, R. Lv and C. Li, Polym. Int., 2014, 63, 1101–1104 CrossRef CAS.
- R. Y. Bao, W. Yang, W. R. Jiang, Z. Y. Liu, B. H. Xie, M. B. Yang and Q. Fu, Polymer, 2012, 53, 5449–5454 CrossRef CAS.
- F. A. e Silva, F. Siopa, B. F. H. T. Figueiredo, A. M. M. Gonçalves, J. L. Pereira, F. Gonçalves, J. A. P. Coutinho, C. A. M. Afonso and S. P. M. Ventura, Ecotoxicol. Environ. Saf., 2014, 108, 302–310 CrossRef PubMed.
- U. A. Rana, I. Shakir, R. Vijayraghavan, D. R. MacFarlane, M. Watanabe and M. Forsyth, Electrochim. Acta, 2013, 111, 41–48 CrossRef CAS.
- M. Yoshizawa-Fujita, K. Fujita, M. Forsyth and D. R. MacFarlane, Electrochem. Commun., 2007, 9, 1202–1205 CrossRef CAS.
- J. M. Pringle, P. C. Howlett, D. R. MacFarlane and M. Forsyth, J. Mater. Chem., 2010, 20, 2056–2062 RSC.
- J. M. Campos, A. M. Ferraria, A. M. Botelho Do Rego, M. R. Ribeiro and A. Barros-Timmons, Mater. Chem. Phys., 2015, 166, 122–132 CrossRef CAS.
- H. Tsuji, Macromol. Biosci., 2005, 5, 569–597 CrossRef CAS PubMed.
- D. Guo and N. Setter, Macromolecules, 2013, 46, 1883–1889 CrossRef CAS.
- D. Guo, I. Stolichnov and N. Setter, J. Phys. Chem. B, 2011, 115, 13455–13466 CrossRef CAS PubMed.
- J. Zhang, H. Sato, H. Tsuji, I. Noda and Y. Ozaki, Macromolecules, 2005, 38, 1822–1828 CrossRef CAS.
- T. Kida, K. Kondo and M. Akashi, Chem. Commun., 2012, 48, 2319–2321 RSC.
- S. C. Matias, A. Rocha, R. Teixeira, L. J. P. Fonseca and N. M. T. Lourenco, RSC Adv., 2014, 4, 15597–15601 RSC.
- U. A. Rana, R. Vijayaraghavan, D. R. MacFarlane and M. Forsyth, J. Mater. Chem., 2012, 22, 2965–2974 RSC.
- H. Yamane and K. Sasai, Polymer, 2003, 44, 2569–2575 CrossRef CAS.
- H. Tsuji, S. H. Hyon and Y. Ikada, Macromolecules, 1991, 24, 5651–5656 CrossRef CAS.
- L. Gardella, D. Furfaro, M. Galimberti and O. Monticelli, Green Chem., 2015, 17, 4082–4088 RSC.
- T. Biedroń, M. Brzeziński, T. Biela and P. Kubisa, J. Polym. Sci., Part A: Polym. Chem., 2012, 50, 4538–4547 CrossRef.
- A. Mehta, J. Raghava Rao and N. N. Fathima, J. Phys. Chem. B, 2015, 119, 12816–12827 CrossRef CAS PubMed.
- M. Forsyth, F. Chen, L. A. O’Dell and K. Romanenko, Solid State Ionics, 2016, 288, 160–166 CrossRef CAS.
- T. Yoshida, K. Imoto, K. Tahara, K. Naka, Y. Uehara, S. Kataoka, M. Date, E. Fukada and Y. Tajitsu, Jpn. J. Appl. Phys., 2010, 49, 09MC11 Search PubMed.
- Q. N. Chen, Y. Ou, F. Ma and J. Li, Appl. Phys. Lett., 2014, 104, 1–5 Search PubMed.
- X. Chen, X. Chu, F. Zeng, J. Huang and D. Guo, Sci. Adv. Mater., 2013, 5, 915–920 CrossRef CAS.
- J. Harada, T. Shimojo, H. Oyamaguchi, H. Hasegawa, Y. Takahashi, K. Satomi, Y. Suzuki, J. Kawamata and T. Inabe, Nat. Chem., 2016, 8, 946–952 CrossRef CAS PubMed.
- B. P. Gorshunov, V. I. Torgashev, E. S. Zhukova, V. G. Thomas, M. A. Belyanchikov, C. Kadlec, F. Kadlec, M. Savinov, T. Ostapchuk, J. Petzelt, J. Prokleška, P. V. Tomas, E. V. Pestrjakov, D. A. Fursenko, G. S. Shakurov, A. S. Prokhorov, V. S. Gorelik, L. S. Kadyrov, V. V. Uskov, R. K. Kremer and M. Dressel, Nat. Commun., 2016, 7, 12842 CrossRef CAS PubMed.
- S. Jung, J. Lee, T. Hyeon, M. Lee and D. H. Kim, Adv. Mater., 2014, 26, 6329–6334 CrossRef CAS PubMed.
- P. J. Gouveia, S. Rosa, L. Ricotti, B. Abecasis, H. V. Almeida, L. Monteiro, J. Nunes, F. S. Carvalho, M. Serra, S. Luchkin, A. L. Kholkin, P. M. Alves, P. J. Oliveira, R. Carvalho, A. Menciassi, R. P. das Neves and L. S. Ferreira, Biomaterials, 2017, 139, 213–228 CrossRef CAS PubMed.
Footnote |
| † Electronic supplementary information (ESI) available. See DOI: 10.1039/c7tc03484a |
| This journal is © The Royal Society of Chemistry 2017 |


