
 Open Access Article
 This Open Access Article is licensed under a
 Creative Commons Attribution 3.0 Unported Licence
Blue-emitting cationic iridium(III) complexes featuring pyridylpyrimidine ligands and their use in sky-blue electroluminescent devices†‡
Adam F.
Henwood
 a,
Amlan K.
Pal
a,
David B.
Cordes
a,
Alexandra M. Z.
Slawin
a,
Thomas W.
Rees
b,
Cristina
Momblona
c,
Azin
Babaei
c,
Antonio
Pertegás
c,
Enrique
Ortí
c,
Henk J.
Bolink
*c,
Etienne
Baranoff
*b and
Eli
Zysman-Colman
*a
a,
Amlan K.
Pal
a,
David B.
Cordes
a,
Alexandra M. Z.
Slawin
a,
Thomas W.
Rees
b,
Cristina
Momblona
c,
Azin
Babaei
c,
Antonio
Pertegás
c,
Enrique
Ortí
c,
Henk J.
Bolink
*c,
Etienne
Baranoff
*b and
Eli
Zysman-Colman
*a
aOrganic Semiconductor Centre, EaStCHEM School of Chemistry, University of St Andrews, St Andrews, Fife, KY16 9ST, UK. E-mail: eli.zysman-colman@st-andrews.ac.uk; Web: http://www.zysman-colman.com Fax: +44-1334 463808; Tel: +44-1334 463826
bSchool of Chemistry, University of Birmingham, Edgbaston, B15 2TT, Birmingham, UK
cInstituto de Ciencia Molecular, Universidad de Valencia, José Beltrán 2, 46980 Paterna, Spain
First published on 29th August 2017
Abstract
The synthesis and structural and photophysical characterisation of four novel, cationic iridium(III) complexes are reported. These complexes were designed to emit in the blue region of the visible spectrum without employing sp2 carbon–fluorine bonds, which have been shown to be electrochemically unstable. Two different C∧N (where C∧N is a bidentate cyclometalating ligand possessing a nitrogen–carbon chelate) ligands [5-(4-methylpyridin-2-yl)-2,4-dimethoxypyrimidine (Mepypyrm) and 5-(5-(trifluoromethyl)pyridine-2-yl)-2,4-dimethoxypyrimidine (CF3pypyrm)] combine electron-withdrawing pyrimidyl nitrogen atoms (in a para relationship with respect to the metal) with methoxy groups in a meta relationship with respect to the metal, which both inductively withdraw electron density from the metal centre, stabilizing the highest occupied molecular orbital. The result is highly efficient (ΦPL = 73–81%) green to blue (λPL = 446–515 nm) emission for complexes 1–4 in MeCN solution. Complex 1 exhibits a broad, unstructured charge transfer (CT) emission profile, while complexes 2–4 exhibit structured, vibronic emission profiles. Density Functional Theory (DFT) calculations corroborate these findings with spin density calculations predicting a T1 state that is metal-to-ligand and ligand-to-ligand (C∧N to N∧N) charge transfer (3MLCT/3LLCT) in nature for complex 1, while complexes 2–4 are predicted to exhibit ligand-centred (3LC) states with spin density localised exclusively on the C∧N ligands. These complexes were used as emitters in sky-blue and blue-green light-emitting electrochemical cells (LEECs). The bluest of these devices (CIE: 0.23, 0.39) is among the bluest reported for any iridium-based LEEC. It is noteworthy that although the electroluminescence intensity decreases rapidly with time (t1/2 = 0.1–20 min), as is typical of blue-green LEECs, for devices L1, L3 and L4 we have observed for the first time that this decay occurs without an accompanying red-shift in the CIE coordinates over time, implying that the emitter does not undergo any chemical degradation process in the non-doped zones of the device.
Introduction
Light-emitting electrochemical cells (LEECs) are simple solid-state lighting devices composed of only one or two organic layers sandwiched between two electrodes.1 The emissive layer is composed of charged compounds that are typically either a conjugated fluorescent polymer with an ionic salt additive,1b,2 or a phosphorescent ionic transition metal complex (iTMC),3 although more recently quantum dot4 and perovskite5 based devices have emerged as well. The iTMCs have been the most widely studied class of emissive materials as the phosphorescent nature of the emitter enables all the excitons generated in the device to be converted into light. Among iTMCs, iridium(III) complexes of the form [Ir(C∧N)2(N∧N)]+ (where C∧N is a bidentate cyclometalating ligand such as 2-phenylpyridinato, ppy, and N∧N is a bidentate diimine ligand such as 2,2′-bipyridine, bpy) are the most popular, due to their short phosphorescence lifetimes, wide range of accessible colours, high photoluminescence quantum yields and high photo- and chemostabilities.3a,bUpon application of an external bias to the LEEC there is a redistribution of ions in the emissive layer, lowering the barrier to charge injection and facilitating light emission.6 The smaller charge injection barrier thereby permits the use of air-stable electrodes to operate the LEEC while the charged nature of the emissive layer mitigates the need for additional charge transport layers that are normally required for conventional organic light-emitting devices (OLEDs). Thus, these devices are structurally simple and can be fabricated using solution-processing techniques onto a variety of substrates, making them an attractive cost-effective technology for large area displays and lighting.1b,7
For all the potential of LEECs, the biggest limiting factors impeding their widespread adoption so far are: (1) their inferior stability compared to OLEDs and (2) the near complete absence of blue emitters. So far, the bluest iTMC LEEC reported,8 as determined by the device's Commission Internationale de l'Éclairage (CIE) x, y coordinates (CIE: 0.20, 0.28), does not come close to the ideal blue CIE coordinates (CIE: 0.14, 0.08)9 and shows poor external quantum efficiency (EQE = 0.28%). Higher device efficiencies (EQE = 3.4–7.6%) have been reported, but these values are limited to blue-green devices with significantly red-shifted CIE y coordinates (CIEx = 0.20–0.25; CIEy = 0.40–0.46), which means that they cannot be considered as ‘true-blue’ devices.10 Among the devices reported with electroluminescence maxima less than 500 nm, the longest device lifetime reported is only 2.17 h.11
One of the most common strategies for blue-shifting the emission of cationic iridium complexes is to modify the cyclometalating ring of the C∧N ligands with electron-withdrawing fluorine atoms [making ligands like 2-(2,4-difluorophenyl)pyridine, dFppy12] that stabilise the HOMO orbitals localised on the phenyl ring and the metal atom. However, it has been demonstrated that the Caryl–F bonds on the C∧N ligands are inherently unstable in the device, with defluorination a known degradation pathway in both LEECs and OLEDs.13 Thus, there is interest in designing C∧N ligands that can mediate a blue-shift in the emission of the iridium complex without the presence of Caryl–F bonds. One promising avenue is to replace the phenyl ring of the C∧N ligands with an electron-poor heterocycle. The incorporation of a nitrogen atom within the phenyl ring of the C∧N ligands, such as with 2′,6′-difluoro-2,3′-bipyridine,14 resulted in an enhanced blue-shifted character of the complex compared to dFppy. These complexes utilise the electron-withdrawing properties of the cyclometalated pyridine to stabilise the HOMO energy in concert with the fluorine atoms on the pyridine ring. The fluorine atoms can be replaced with ambivalent methoxy groups (inductively electron-withdrawing when meta-substituted, σm = +0.12, and electron-donating when para-substituted, σp = −0.27)15 that blue-shift the emission when situated at the 2′,6′-positions of the cyclometalating ring, and provide an effective fluorine-free alternative to the difluorophenyl moiety of dFppy as a strategy for blue-shifting the emission of these complexes.16
Other fluorine-free cyclometalating heterocycles have also recently been explored. For example, cyclometalated 1-methyl-2-(2′-pyridyl)pyridinium and 1-methyl-3-(2′-pyridyl)pyridinium ligands have been employed to generate blue-green cationic iridium complexes.17 Cyclometalated pyridylpyrimidines, which incorporate two nitrogen atoms into the cyclometalating ligand framework, have also been shown to be effective in blue-shifting the emission of neutral iridium complexes but so far no cationic examples have been reported.18
Four complexes were investigated in this study by employing combinations of four different ligands (Chart 1). For the C∧N ligands, the same cyclometalating pyrimidyl ring (2,4-dimethoxypyrimidine) was chosen, wherein the non-coordinating carbon atoms of the pyrimidine ring were substituted with methoxy groups. The pyridyl ring of the C∧N ligand was varied either to contain a methyl group para to the metal centre [5-(4-methylpyridin-2-yl)-2,4-dimethoxypyrimidine, Mepypyrm] or to contain a trifluoromethyl group para to the pyrimidyl ring [5-(5-(trifluoromethyl)pyridine-2-yl)-2,4-dimethoxypyrimidine, CF3pypyrm]. For the N∧N ligands, 4,4′-di-tert-butyl-2,2′-bipyridine (dtBubpy) and the rigid biimidazole ligand 1,1′-(α,α′-o-xylylene)-2,2′-biimidazole (o-Xylbiim) were investigated. dtBubpy was used as a reference ancillary ligand, as it is one of the most commonly used N∧N ligands for LEECs, forming complexes in combination with both Mepypyrm (complex 1) or CF3pypyrm (complex 2). We also employed o-Xylbiim in combination with Mepypyrm (complex 3) and CF3pypyrm (complex 4), as we have previously shown that it is effective in blue-shifting the emission properties of [Ir(C∧N)2(N∧N)]+ complexes while also enhancing their photoluminescence quantum yields, ΦPL.19
 | ||
| Chart 1 Complexes synthesised and characterised in this study. | ||
Given the paucity of cationic iridium complexes bearing cyclometalated heterocycles, it is helpful to compare complexes 1–4 to reference complexes with well-characterised photophysical properties (Chart 2). Complex R1 employs the most commonly used C∧N ligand, dFppy, to blue-shift the emission of iridium(III) complexes and thus serves as a benchmark complex. Complex R2, like complexes 2 and 4, has a –CF3 substituent incorporated into the pyridine ring of the C∧N ligand [2-(2,4-difluorophenyl)-5-(trifluoromethyl)pyridine, dFCF3ppy] and thus is useful to understand the influence of this substituent. Complex R3 is structurally very similar to 1 except that the cyclometalating heterocycle is a pyridine and not a pyrimidine (2′,6′-dimethoxy-4-methyl-2,3′-bipyridine, 5-Mepypy). The comparison between R3 and 1 provides a basis to understand the effects of the additional nitrogen atom contained within the pyrimidine ring on the optoelectronic properties of the complex. Finally, complex R4, a very efficient blue emitter recently reported by us,19b contains the o-Xylbiim N∧N ligand (λPL = 459 nm, ΦPL = 90% in MeCN). The C∧N ligand for R4, [2-(2,4-difluorophenyl)-4-mesitylpyridine, dFMesppy], is electronically indistinct from dFppy, since the orthogonal conformation of the mesityl ring effectively deconjugates this group from the C∧N chromophore; we and others have shown that the mesityl group can enhance the ΦPL of the complex.19b,20
 | ||
| Chart 2 Reference complexes for this study. | ||
Results and discussion
Synthesis
The two C∧N ligands were each synthesised in two steps (Scheme 1). Lithiation of 5-bromo-2,4-dimethoxypyrimidine with n-BuLi and quenching with trimethylborate afforded, after hydrolysis with HCl, the corresponding boronic acid. Both C∧N ligands were then obtained through a Suzuki–Miyaura21 cross-coupling reaction with the appropriate substituted halopyridine. The o-Xylbiim N∧N ligand was synthesised as previously reported.19a The synthesis of the chloro-bridged dimers proceeded by refluxing the C∧N ligand in 2-ethoxyethanol with [Ir(COD)(μ-Cl)]2 as the iridium source.15a,22 Complexes 1–4 were obtained following cleavage of the isolated crude dimers with an excess of N∧N ligand in refluxing DCM/MeOH solution. The anion metathesis step was initially carried out using NH4PF6, but to avoid protonation of the pyrimidine rings on the complexes (vide infra) KPF6 was used subsequently instead (Scheme 2). | ||
Scheme 1 Synthesis of C∧N ligands. Reagents and conditions: a (i) n-BuLi (1.3 equiv., 2.5 M in hexanes), THF, N2, −78 °C, 1 h; (ii) B(OMe)3 (1.5 equiv.), rt, 16 h; (iii) HCl, 16 h, rt. b K2CO3 (3.0 equiv.), 1,4-dioxane/water (2![[thin space (1/6-em)]](https://www.rsc.org/images/entities/char_2009.gif) :1 v/v), Pd(PPh3)4 (5 mol%), 80 °C, 16 h. :1 v/v), Pd(PPh3)4 (5 mol%), 80 °C, 16 h. | ||
 | ||
| Scheme 2 Synthesis of 1–4. Reagents and conditions: a 2-EtOC2H4OH, 110 °C, N2, 3 h. b (i) CH2Cl2/MeOH (1:1 v/v), 40 °C, 19 h, N2; (ii) excess KPF6 (aq.). | ||
Structural characterisation
All complexes were comprehensively characterised using 1H, 13C and, for complexes 2 and 4, 19F NMR spectroscopy, along with high resolution mass spectrometry (HRMS) and elemental analysis (EA). Additionally, the structures of 1–4 were determined by single crystal X-ray diffraction.In the solid-state, all four complexes show the expected distorted octahedral geometry about the iridium centre,19b,23 with two C∧N ligands coordinating through the pyridyl nitrogen atoms in a mutually trans configuration and the cyclometalating carbon atoms of the pyrimidine rings mutually cis to each other. The coordination sphere is completed by coordination through the nitrogen atoms of the N∧N ligands (Fig. 1). We were surprised to observe that in contrast to complexes 1 and 2, the crystal structures of 3 and 4 are not monocationic. In both cases one of the pyrimidyl nitrogen atoms of each of the complexes is protonated, which is hypothesized to arise from the initial use of NH4PF6 as the anion metathesis reagent. In the case of 3, the complex is a dication (3-H+) with two PF6− anions present for charge balance and a hydrogen bond [N⋯N 2.14(6) Å] between the protonated pyrimidine ring and an acetonitrile solvent molecule. Complex 4 crystallises as a dimeric pair of protonated (4-H+) and non-protonated (4) complexes, which form a tight hydrogen bond [N⋯N 1.98(5) Å] between the protonated pyrimidine ring of 4-H+ and the non-protonated pyrimidine ring of 4. Thus, in the crystal structure there are three PF6− anions for charge balance: one for each cyclometalated complex, and one for the additional proton.
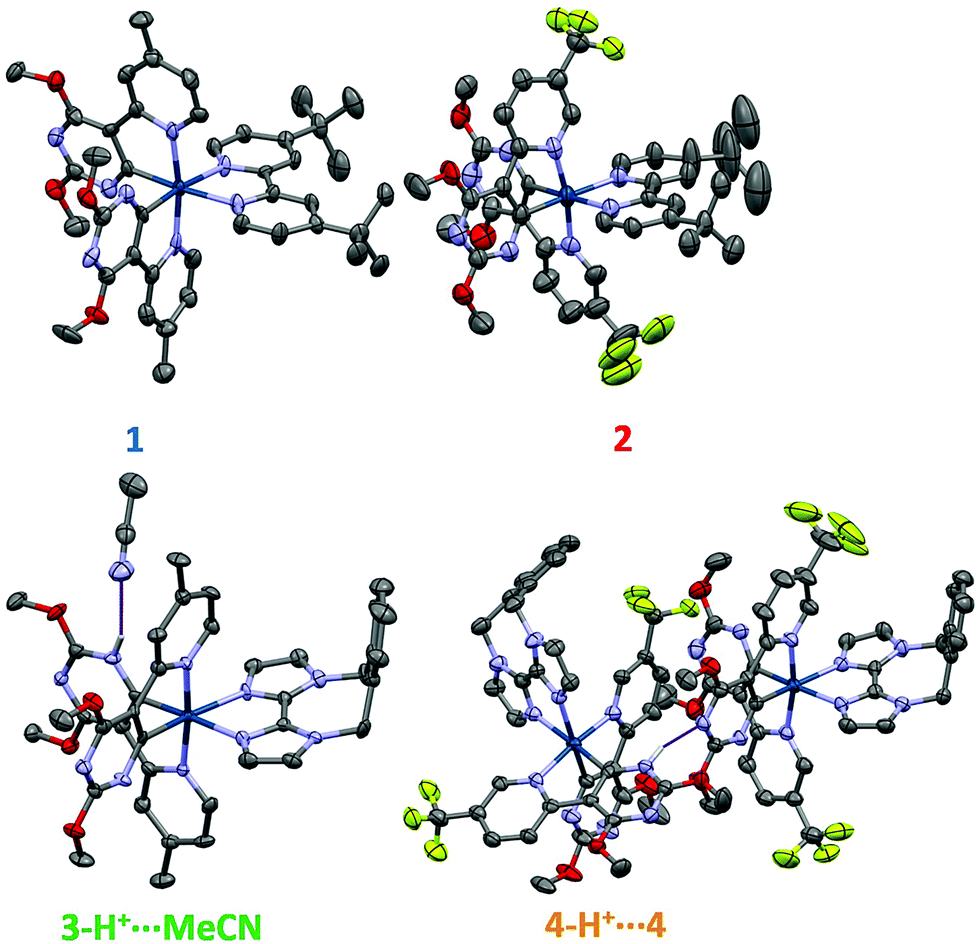 | ||
| Fig. 1 X-ray crystal structures of complexes 1–4, thermal ellipsoids are drawn at the 50% probability level. Counterions, C–H hydrogen atoms and non-hydrogen bonding solvent molecules have been removed for clarity. Atom labelling: hydrogen (light grey), carbon (grey), nitrogen (blue), oxygen (red), fluorine (yellow), and iridium (dark blue). Hydrogen bonding of the protonated pyrimidine rings in 3 and 4 is denoted with a purple line. | ||
For complexes 1 and 2, an unusual structural feature is observed, where only one of the Ir–CC∧N bond lengths is shorter than the Ir–NC∧N bond lengths from the same C∧N ligand (Table 1). This is not typical of cyclometalated iridium complexes as the Ir–CC∧N bonds are generally considered to be stronger than the Ir–NC∧N bonds, and thus they would all be expected to be shorter. By contrast, complexes 3-H+, 4 and 4-H+ show more conventional behaviour.
| Complex | Bond length (Å) | Bond angle (°) | |||
|---|---|---|---|---|---|
| Ir–C | Ir–NC∧N | Ir–NN∧N | N–Ir–C | N–Ir–N | |
| 1 | 1.993(19) | 2.030(19) | 2.134(16) | 79.5(8) | 75.6(6) |
| 2.014(17) | 1.949(19) | 2.146(14) | 79.5(8) | ||
| 2 | 1.997(15) | 1.98(2) | 2.138(13) | 80.7(8) | 76.6(5) |
| 1.950(17) | 2.04(2) | 2.119(15) | 80.7(8) | ||
| 3-H+ | 1.968(7) | 2.049(6) | 2.109(6) | 79.9(3) | 75.5(2) |
| 1.998(5) | 2.059(6) | 2.153(4) | 78.9(3) | ||
| 4-H+ | 1.980(6) | 2.051(5) | 2.099(5) | 80.2(2) | 75.85(19) |
| 1.970(6) | 2.040(5) | 2.138(5) | 79.9(2) | ||
| 4 | 1.964(6) | 2.029(5) | 2.118(5) | 79.8(2) | 75.6(2) |
| 1.989(6) | 2.035(5) | 2.136(5) | 79.7(2) | ||
In solution, batches of 1 and 2 prepared using NH4PF6 as the anion metathesis reagent gave unusually broad and featureless 1H NMR spectra, which were attributed to the protonation of the pyrimidine rings, a feature observed in the crystal structures of 3 and 4. Fig. 2 shows a comparison of the 1H NMR spectra of batches of complex 2 prepared using NH4PF6 and KPF6, showing the sharper features present for the batch prepared using KPF6.
 | ||
| Fig. 2 Aromatic region of the 1H NMR spectra for 2 in CD3CN prepared using NH4PF6 (top) and KPF6 (bottom) as the anion metathesis reagent. | ||
In order to ensure valid comparison across the series of complexes, all photophysical measurements were carried out on samples prepared using KPF6. Elemental analysis confirmed that they are in their monocationic forms.
The 1H NMR spectra of non-protonated samples of complexes 3 and 4 are broadened, as a result of the expected fluxional motion of the o-Xylbiim ligand, which is slow on the NMR timescale. Heating the samples resulted in simplification of the spectra due to the dynamic pseudo C2-symmetric geometry (Fig. S15 and S17 in the ESI†). Eyring analysis on the barrier to inversion for 3 and 4 gave similar activation energies to each other (ΔG‡ = 82.9 and 83.2 kJ mol−1 for complexes 3 and 4, respectively) as well as to the previously reported complexes (ΔG‡ = 72.2–82.3 kJ mol−1).19
Electrochemical properties
Electrochemical measurements on 1–4 were carried out in MeCN. The cyclic voltammetry (CV) traces are shown in Fig. 3 while the relevant electrochemical data are given in Table 2. The first oxidation wave in 1 was found to be quasi-reversible while those of 2–4 were found to be irreversible. The DFT calculations point to HOMOs that reside on both the Ir(III) ion and the aryl ring of the C∧N ligands. Thus, the oxidation of all the complexes is inferred as the removal of an electron from the admixture of the Ir(III) metal centre and the pyrimidine rings of the C∧N ligands (Fig. 4). The oxidation potential for 1 [E(ox)pa = 1.53 V] is cathodically shifted compared to 2 [E(ox)pa = 1.70 V] indicating that the –CF3 group is exerting a stabilising influence on the HOMO of 2. This is consistent with the analogous comparison of complexes R1 [E(ox)1/2 = 1.60 V] and R2 [E(ox)1/2 = 1.69 V] though the effect is more pronounced in 2 compared to 1 due to the concomitant removal of the electron-donating methyl group, which is not present in R1. The higher energy calculated for the HOMO of 1 (EHOMO = −5.93 eV) compared to that of 2 (EHOMO = −6.25 eV) is in good agreement with the measured 0.17 V cathodic shift of the energy of the oxidation wave of 1 with respect to that of 2 (Table 2). A slightly less positive oxidation potential (difference of 0.07 V) is observed for 1 compared to R1, which indicates that dFppy stabilises the HOMO in a similar manner to the Mepypyrm C∧N ligand, with the difference in the oxidation potential being attributed to the presence of the electron donating methyl group on the pyridine. Indeed, similar small differences in the oxidation potential have been found in changing the C∧N ligands in heteroleptic iridium complexes from dFppy to dFMeppy where the only difference is the presence of a methyl group at the 4-position of the pyridine ring.24 There is only a small difference in the oxidation potential measured for R3 [E(ox)1/2 = 1.51 V] compared to 1, demonstrating that the additional nitrogen atom in the pyrimidine has only a modest influence on the HOMO. In contrast to 1 and R1, complex 2 has a virtually identical oxidation potential to R2 [E(ox)1/2 = 1.69 V], demonstrating the importance of the influence of the –CF3 substitution on the C∧N ligand design. | ||
| Fig. 3 CV traces of complexes 1–4 in MeCN solution, reported versus SCE (Fc/Fc+ = 0.38 V in MeCN).26 Scan rates were at 100 mV s−1 and are in the positive scan direction. | ||
| Cmpd | E pa(ox) (V) | E pc(ox) (V) | E pc(red) (V) | E pa(red) (V) | E HOMO (eV) | E LUMO (eV) | ΔEredox (V) | E HOMO (eV) | E LUMO (eV) | |ELUMO–HOMO|c (eV) |
|---|---|---|---|---|---|---|---|---|---|---|
| a Measurements were carried out in MeCN at a scan rate of 100 mV s−1 with Fc/Fc+ employed as an internal standard, and data are reported vs. SCE (Fc/Fc+ = 0.38 V in MeCN).26 Reported potentials are referenced to the Fc/Fc+ redox couple. b E HOMO/LUMO = −[Eox/red vs. Fc/Fc+ + 4.8] eV.27 c DFT calculated energy in eV. d Quasi-reversible redox wave. e Reversible redox wave. f Irreversible redox wave. g Reported refer to E1/2 values. | ||||||||||
| 1 | 1.53d | 1.73d | −1.39e | −1.45e | −5.95 | −3.03 | 2.92 | −5.93 | −2.33 | 3.60 |
| 2 | 1.70f | — | −1.38e | −1.45e | −6.12 | −3.04 | 3.08 | −6.25 | −2.48 | 3.77 |
| 3 | 1.46f | — | −2.00f | — | −5.88 | −2.42 | 3.46 | −5.81 | −1.55 | 4.26 |
| 4 | 1.65f | — | −1.74f | — | −6.07 | −2.68 | 3.39 | −6.12 | −2.00 | 4.12 |
| R1 19b | 1.60g | — | −1.36 | — | −6.02 | −3.06 | 2.96 | — | — | — |
| R2 25 | 1.69g | — | −1.37 | — | −6.11 | −3.05 | 3.06 | — | — | — |
| R3 16a | 1.51g | — | −1.41 | — | −5.93 | −3.01 | 2.92 | — | — | — |
| R4 19b | 1.37g | — | −1.99 | — | −5.79 | −2.43 | 3.36 | — | — | — |
 | ||
| Fig. 4 Calculated frontier MO energies of [1]+, [2]+, [3]+ and [4]+, obtained from DFT [B3LYP/SBKJC-VDZ for Ir(III) and 6-31G** for C, H, N, O, and F] with CPCM(MeCN) and 0.5 eV threshold of degeneracy (orbitals with an isocontour value of 0.03). Kohn–Sham MOs of [1]+, [2]+, [3]+ and [4]+ are also shown. | ||
As was observed for 1 and 2, the oxidation potential of 3 [E(ox)pa = 1.46 V] is cathodically shifted compared to 4 [E(ox)pa = 1.65 V]. Similar to the trends predicted for 1 and 2, the DFT predicted HOMO energies of 3 (EHOMO = −5.81 eV) and 4 (EHOMO = −6.12 eV) are in line with their oxidation potentials where there is a good agreement with the measured 0.19 V cathodic shift of the energy of the oxidation wave of 3 with respect to that of 4 (Table 1). Both the o-Xylbiim complexes 3 and 4 show marginally cathodically shifted oxidation waves compared to their corresponding dtBubpy analogues 1 and 2, which is a consequence of the electron-releasing nature of the biimidazole N∧N ligand. This behaviour is corroborated by the DFT calculated energies of the HOMOs of 1vs.3 and 2vs.4 (Table 2). A similar comparison exists with complexes R1 and R4 [E(ox)1/2 = 1.37 V].
Determining trends for the observed reduction potentials is less straightforward. For complexes 1 and 2, a reversible reduction at virtually the same potential [E(red)pc = −1.39 V for 1 and −1.38 V for 2] was attributed to the reduction of the dtBubpy ligand, an assignment supported by DFT calculations. By contrast, the LUMO is predicted by DFT to be on the biimidazole (biim) part of the o-Xylbiim ligand for 3 and on the CF3pypyrm moiety for 4 (Fig. 4). The destabilisation of the LUMO of complex 1 (ELUMO = −2.33 eV) explains the small cathodic shift of 10 mV measured for its first reduction wave [E(red)pc = −1.39 V] in comparison with those of complex 2 [ELUMO = −2.48 eV; E(red)pc = −1.38 V]. Complexes R1–R3 likewise show reversible reduction waves in a similar range [E(red)1/2 = −1.36 V for R1, −1.37 for R2 and −1.41 for R3]. For complexes 3 and 4, the reduction waves are observed at significantly lower potentials [E(red)pc = −2.00 V for 3, −1.74 V for 4] and are irreversible in nature. The nature of the reductions in 3 and 4 can be inferred by scanning beyond the reduction potentials of the dtBubpy ligand for complexes 1 and 2 (Fig. S18 in the ESI†). Complex 1 exhibits a second irreversible reduction at the same potential [E(red)pc = −2.00 V] as the reduction for 3, which strongly suggests reduction of the pyridine ring of the C∧N ligand. However, it is worth noting that the reduction wave in R4, which was attributed to the reduction of the o-Xylbiim ligand, is also at almost the same potential [E(red)1/2 = −1.99 V]. It is therefore plausible that the reduction wave of 3 is due to the reduction of the N∧N ligand, which is supported by the DFT calculations, where the LUMO is predicted to be on the biim moiety of the o-Xylbiim ligand (Fig. 4). For complex 4, there are at least two observable reduction processes that can be attributed to either or both the reduction of the o-Xylbiim ligand and/or the pyridyl ring of the C∧N ligand. A similar set of multi-electron reductions is observed for complex 2 [E(red)pc = −1.86 V], and these are anodically shifted compared to the second reduction observed for 1. This behaviour mirrors the anodic shift observed in the first reduction of 4 compared to 3 and is consistent with the direct reduction of a more electron deficient CF3-substituted pyridine ring, an assignment corroborated by DFT calculations. The predicted destabilisation of the LUMO (ELUMO = −1.55 eV) explains the measured cathodic shift of 260 mV in the CV of 3 [E(red)pc = −2.00 V] compared to that of 4 [ELUMO = −2.00 eV; E(red)pc = −1.74 V]. Finally, complex R2 is reported to have a second reduction [E(red)1/2 = −1.68 V] that was attributed to the reduction of the dFCF3ppy ligand in a similar regime to the first reduction of 4. The electrochemically observed redox gap, ΔEredox, follows the order of 1 (2.92 V) < 2 (3.08 V) < 4 (3.39 V) < and 3 (3.46 V), and this trend is also in good agreement with the DFT predicted HOMO–LUMO energy gap, |EHOMO–LUMO|; 1 (3.60 eV) < 2 (3.77 eV) < 4 (4.12 eV) < and 3 (4.26 eV) (Table 2).
UV-vis absorption
The UV-vis absorption spectra for 1–4 are shown in Fig. 5 and the molar absorptivity data are given in Table 3. The predicted transitions obtained by TD-DFT calculations are tabulated for each complex in Tables S2–S5 (ESI†). In the high-energy region of the spectrum (250–325 nm), π–π* transitions for all complexes dominate and the features of the spectra are determined by the nature of the N∧N ligand. The principal π–π* bands for complexes 1 and 2 are blue-shifted (λabs = 264 nm for 1 and 261 nm for 2, ε ∼ 60000 M−1 cm−1) and are more absorptive than that for 3 and 4 (λabs = 268 nm for 3 and 276 nm for 4, ε ∼ 40000 M−1 cm−1), which is in accordance with what was observed previously between complexes containing dtBubpy and o-Xylbiim as the N∧N ligand. This trend is perfectly in line with the TD-DFT predicted principal π–π* transition energies for complexes 1 (259 nm) and 2 (255 nm) compared to those of complexes 3 (262 nm) and 4 (277 nm). Except for complex 4, these transitions consist primarily of π–π* transitions localized on the C∧N ligand mixed, to a small degree, with some ligand-to-ligand charge transfer from the C∧N ligands to the N∧N ligand, and Ir(dπ) to both C∧N and the ancillary ligands (metal-to-ligand charge transfer, 1MLCT). In addition, two bands are observed for 1 and 2 (λabs = 300 and 311 nm for 1 and 297 and 311 nm for 2) that are not present for 3 and 4, which suggest that these bands involve uniquely the dtBubpy N∧N ligand. However, TD-DFT calculations predict that these transitions are mostly 1LC transitions on the C∧N ligands with some 1MLCT Ir(dπ) to C∧N transition; the 1MLCT character is more dominant for 2 (Tables S2 and S3, ESI†).
 | ||
| Fig. 5 UV-vis absorption spectra of complexes 1–4 in MeCN solution. | ||
| Complex | λ abs (nm) [ε (×104 M−1 cm−1)] |
|---|---|
| a Measurements were carried out in MeCN. | |
| 1 | 264 [6.49], 300 [3.45], 311(sh) [3.08], 335 [1.71], 361 [0.90] |
| 2 | 261 [5.61], 275(sh) [4.63], 297(sh) [3.10], 311 [2.50], 350 [1.53], 384 [0.69] |
| 3 | 268 [3.94], 322(sh) [1.46], 339 [1.23], 369 [0.41] |
| 4 | 276 [4.05], 315(sh) [1.84], 352 [1.16], 388 [0.42] |
At lower energies, the trends are reversed, with the absorption features insensitive to the nature of the N∧N ligand but strongly affected by the nature of the C∧N ligand. Complexes 1 and 3 have a pair of poorly resolved absorption bands (λabs = 335 and 361 nm for 1 and 339 and 369 nm for 3). Complexes 2 and 4 have a similar pair of absorption bands but these bands are well resolved and red-shifted (λabs = 350 and 384 nm for 2 and 352 and 388 nm for 4). The similarity of the absorption spectra suggests that these bands are constituted of transitions localised on the C∧N ligands. However, their much lower absorptivity values compared to the higher energy absorption bands imply that they are not likely to be comprised of significant π–π* transitions. Instead, the lower absorptivities of these bands for the four complexes are indicative of 1MLCT charge transfer contributions from the metal to the pyridine of the C∧N ligand, as well as possibly from the methoxy substituents into the pyridyl rings (intra-ligand charge transfer, 1ILCT). However, TD-DFT calculations point to a predominant 1LCC∧N transition mixed with some 1MLCT from Ir(dπ) to the C∧N ligands for complexes 1 and 4. Likewise, the transitions at 357 nm and 339 nm of 2 and 3, respectively, mainly possess 1LCC∧N character with again some 1MLCT character from Ir(dπ) to the C∧N ligands. The transition at 380 nm in 2 involves mainly a ligand-to-ligand charge transfer (1LLCT) contribution from the C∧N ligands to dtBubpy, along with 1MLCT from Ir(dπ) to the N∧N ligand (Tables S3 and S4, ESI†). The transition at 369 nm in 3 is rather complicated and consists mostly of an 1LLCT from the C∧N ligands to the o-Xylbiim ligand and 1MLCT from Ir(dπ) to both the ligands (Table S4, ESI†). The red-shift observed for complexes 2 and 4 corroborates this charge transfer assertion, due to the stabilisation of orbitals on the pyridyl ring by the electron-withdrawing –CF3 group, and is in accordance with an anodic shift in the second reduction potentials of 2 compared to 1 and the first reduction potential of 4 compared to 3. Although the principal bands for complexes 1 and 3 are blue-shifted, there is weak absorption present in these two complexes beyond the onset of absorption for complexes 2 and 4, suggesting that the lowest energy transition is in fact higher in energy for complexes 2 and 4 than for 1 and 3.
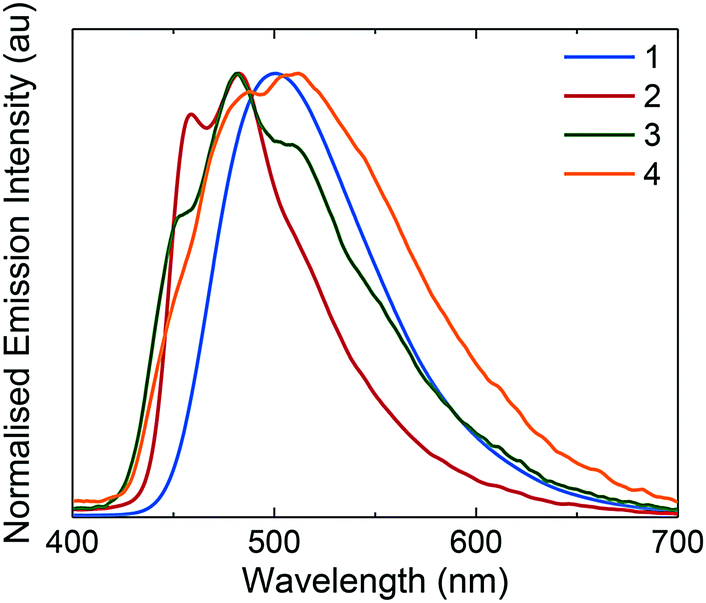
Emission spectroscopy
The photophysical properties of these complexes were studied in MeCN solution at 298 K. Their emission profiles are shown in Fig. 6, and the relevant photophysical data are given in Table 4. Complex 1 is a green emitter, with broad, unstructured emission that is characteristic of a mixed charge transfer state between both the metal to the N∧N ligand (3MLCT) and the C∧N ligands to the N∧N ligand (3LLCT). The mixed charge transfer nature of the emission spectrum of 1 is also supported by the DFT predicted T1 spin density distribution, where the spin density was found to be well distributed over the entire complex, (Fig. 7). The photophysical properties of 1 (λPL = 515 nm, ΦPL = 81%) are remarkably similar to R1 (λPL = 515 nm, ΦPL = 72%) and R3 (λPL = 517 nm, ΦPL = 53%), suggesting that the additional nitrogen in the pyrimidyl ring in this instance does not have a significant influence on the energy of the T1 state. | ||
| Fig. 6 Normalised emission spectra for complexes 1–4 in deaerated MeCN solution. λexc: 360 nm. Inset: MeCN solutions of complexes 1–4 illuminated under UV (365 nm) irradiation. | ||
| Solution | Thin film | |||||||
|---|---|---|---|---|---|---|---|---|
| Complex | λ em (nm)b,c | CIE (x, y) | Φ PL (%) | τ e (μs) | k r × 105 s−1 | k nr × 105 s−1 | λ em , (nm) | Φ PL , (%) |
|
a Measurements at 298 K in deaerated MeCN.
b
λ
exc: 360 nm.
c Numbers in brackets denote relative weightings for each emission band.
d Quinine sulfate used as the reference (ΦPL = 54.6% in 0.5 M H2SO4 at 298 K).28
e
λ
exc: 375 nm.
f Thin film composition: complex:1-butyl-3-methylimidazolium hexafluorophosphate 4:1 molar ratio.
g
λ
exc: 320 nm.
|
||||||||
| 1 | 515 | 0.20, 0.41 | 81 | 1.36 | 5.96 | 1.40 | 500 | 65 |
| 2 | 454 (1.00), 481 (0.98) | 0.14, 0.19 | 77 | 4.21 | 1.82 | 0.55 | 458 (0.90), 482 (1.00) | 17 |
| 3 | 446 (0.69), 475 (1.00), 510 (0.83) | 0.16, 0.23 | 80 | 9.01 | 0.89 | 0.22 | 451 (0.66), 481 (1.00), 513 (0.82) | 15 |
| 4 | 457 (1.00), 483 (0.96) | 0.15, 0.23 | 73 | 4.77 | 1.53 | 0.57 | 486 (0.95), 512 (1.00) | 9 |
| R1 | 515 | — | 72 | 1.36 | 5.29 | 2.06 | ||
| R2 | 470 | — | 68 | 2.30 | 2.96 | 1.39 | ||
| R3 | 517 | — | 53 | 1.30 | 4.08 | 3.62 | ||
| R4 | 459, 487 | — | 90 | 2.19 | 4.11 | 0.46 | ||
 | ||
| Fig. 7 Triplet spin density distributions of complexes 1–4, obtained from TD-DFT [UB3LYP/SBKJC-VDZ for Ir(III) and 6-31G** for C, H, N, O, and F] with CPCM(MeCN). Contours at an isovalue of 0.02. | ||
By contrast, 2 displays structured 3LC emission localized on the C∧N ligands, that is significantly blue-shifted (λPL = 454, 481 nm, ΦPL = 77%) compared to 1. The 3LC nature of the emission is further supported by the predicted spin-density distribution. Analogously, complex R2 is blue-shifted (λPL = 470 nm, ΦPL = 68%) compared to complex R1, demonstrating that the –CF3 group exerts a significant blue-shifting effect on the emission energy. However, the blue-shifted emission of 2 compared to R2 implies a synergistic blue-shifting effect between the –CF3 moiety and the pyrimidine compared to the dFCF3ppy ligand.
While complex 1 showed emission from a mixed 3MLCT/3LLCT state, the use of the o-Xylbiim ligand in 3 and 4 renders the N∧N ligand non-chromophoric and thus the emission of 3 originates from a blue-shifted, highly vibronic 3LC state (λPL = 446, 475, 510 nm, ΦPL = 80%). These 3LC assignments are corroborated by the C∧N-localised spin density distributions (Fig. 7). The principal vibronic bands in 3 virtually coincide with those of complex 2, but the relative intensities differ; for complex 3, the most intense band is at 475 nm, while the band at 446 nm appears as a less intense shoulder. In the case of 2, the emission intensities of both bands are very similar, with the band at 454 nm being only marginally more intense than that at 481 nm. Finally, complex 3 has a third shoulder at 510 nm that is almost totally suppressed in the case of 2. Thus, 2 appears bluer than 3 due to a smaller contribution to the emission from the blue-green region of the spectrum. The blue-shift in emission observed for 3 compared with 1 is not mirrored in the analogous comparison between 4 and 2. In this instance, the emission profile of 4 (λPL = 457, 483 nm, ΦPL = 73%), overlaps almost coincidentally with 2, albeit with a small red-shift in the former. It is therefore apparent that when the –CF3 group is incorporated into the C∧N ligand, the emission becomes totally localised on the cyclometalating ligand and the ancillary ligand exerts almost no influence.
The relatively long excited state lifetimes (>4 μs) and small radiative constants kr (<2 × 10⁵ s−1) further support the predominant 3LC character of the emissive triplet state in complexes 2–4. By contrast, complex 1 displays a shorter τe (1.36 μs) and a larger kr (5.96 × 10⁵ s−1), which is in line with the 3CT-based triplet excited state. The optoelectronic properties of complex 2 are therefore remarkable: although the LUMO of the complex resides on the N∧N ligand (see electrochemistry section), which is expected to result in a dπ–π*N∧N MLCT/LLCT state of lower energy than the πC∧N–π*C∧N LC state, emission appears instead to originate from the higher energy LC state.
We can take this into consideration further if we consider the comparison of 1 with R1. Photophysically, these complexes are almost indistinct with both exhibiting green emission from the 3MLCT/3LLCT state and showing similar excited state lifetime and photoluminescence quantum yields. We can therefore conclude that in this instance the optoelectronic properties exerted by the Mepypyrm C∧N ligand on complex 1 compared to the dFppy C∧N ligand on complex R1 are essentially the same. By contrast, the analogous comparison of the photophysical properties does not hold between complexes 2 (containing the CF3pypyrm C∧N ligand) and R2 (containing the dFCF3ppy C∧N ligand). Complex R2 is blue-shifted compared to R1 but nevertheless emits from the predominant 3LLCT/3MLCT state implicating a chromophoric contribution from the dtBubpy N∧N ligand. The CF3pypyrm C∧N ligand, on the other hand, renders the dtBubpy ancillary ligand in complex 2 non-chromophoric, which is highly unusual for iridium(III) complexes bearing dtBubpy N∧N ligands.
This unusual feature of the CF3pypyrm C∧N ligand is mirrored in complex 4, which has virtually identical photophysical properties to complex 2 (similar emission maximum, profile, ΦPL, τe) despite the presence of the o-Xylbiim ancillary ligand that has a much higher energy LUMO compared to dtBubpy (see the more negative reduction potential of 4 compared to 2). The reasons behind such unexpected behaviour are currently not understood but are most likely due to uncommon branching of events at very short time scales (ns and below), which is beyond the scope of this manuscript.
The highest energy emission maxima, E0–0, are blue-shifted and in the order 3 (22421 cm−1, 446 nm) > 2 (22026 cm−1, 454 nm) ∼ 4 (21882 cm−1, 457 nm) > 1 (19417 cm−1, 515 nm) (Table 4). The predicted emission maxima, EAE = E(T1) − E(S0) at the T1 optimized geometry (adiabatic electronic emission) obtained by DFT calculations for 1–4 are, respectively, at 482, 441, 422 and 440 nm. These values match closely with those observed experimentally with relative errors of 6.8%, 6.0%, 9.1% and 6.8%, respectively for complexes 1–4. Crucially, these calculations predict essentially no change in emission energy between complexes 2 and 4, corroborating the feature observed for these complexes in solution. This overall trend is generally mimicked by the measurements pertaining to the ground state, with a gradually increasing HOMO–LUMO gap across the series calculated from the electrochemistry data [ΔEredox: 3 (3.46 V) > 4 (3.39 V) > 2 (3.08 V) > 1 (2.92 V)] and the DFT calculations [|ELUMO–HOMO|: 3 (4.26 eV) > 4 (4.12 eV) > 2 (3.77 eV) > 1 (3.60 eV)] (Table 2). However, these values also predict a much larger energy difference between complexes 2 and 4, which is not observed in the PL spectrum or predicted by the T1 spin density DFT calculations. This highlights the difference in excited state vs. ground sate measurements, as well as reflects the unusual photophysical features of the CF3pypyrm C∧N ligand in the excited state.
Complex R4 is the bluest among the reference complexes (λPL = 459, 487 nm, ΦPL = 90%) due to the adoption of the o-Xylbiim ligand as the N∧N ligand. Although it is moderately more emissive, complexes 2 and 4 are modestly blue-shifted in emission, showing that it is possible to achieve significantly blue-shifted emission without employing C–Faryl bonds.
The complexes were also evaluated in light-emitting electrochemical cells (LEECs). In this application the complexes are processed into amorphous thin films. In order to understand the photoluminescence properties in an analogous environment, samples of 1–4 were fabricated by depositing the complexes onto quartz substrates following the same composition and coating conditions as were used for LEEC preparation. The neat thin-film photoluminescence spectra for each complex 1–4 are displayed in Fig. 8. All four emitters preserve the same spectral shape as observed in acetonitrile solution, although the peak position is shifted for 1 and 4. The emission maximum of 1 is centred at 500 nm, slightly blue-shifted from what is observed in MeCN. The structured emission profiles of 2 and 3 are essentially identical (λmax = 458 and 482 nm for 2 and 451, 481 and 513 nm for 3) to those measured in MeCN. The photoluminescence of 4 on the other hand is modestly red-shifted compared to that in solution (λmax = 486 and 512 nm). Due to the fact that the photoluminescence spectra are comparable between solution and thin film, it is not unexpected that 1 (3MLCT/3LLCT) has the highest emission quantum yield in a thin film (ΦPL = 65%) while 2, 3 and 4 (3LC) show lower ΦPL values in a thin film (ΦPL < 20%).
 | ||
| Fig. 8 Neat thin-film photoluminescence spectra for 1–4 (λexc = 320 nm). | ||
Device characterization
The electroluminescence properties of 1–4 were evaluated by preparing LEECs with a sandwich architecture, as illustrated in Fig. 9d. The devices were fabricated on an ITO-patterned, cleaned glass substrate, where first a poly(3,4-ethylenedioxythiophene):poly(styrenesulfonate) (PEDOT:PSS) layer was deposited by spin-coating. The LEEC active layer was deposited from an acetonitrile solution, which consisted of the emitter mixed with the ionic liquid (IL) 1-butyl-3-methylimidazolium hexafluorophosphate, [Bmim][PF6], in a 4:1 molar ratio (complex:IL). After deposition of the active layer, aluminium was thermally evaporated as the top electrode.
 | ||
| Fig. 9 Time-dependence luminance under average pulsed current driving of 100 A m−2 for: (a) LEEC 1 and (b) LEEC 2, 3 and 4; (c) evolution of the driving voltage versus time for the LEECs based on complexes 1–4; (d) schematic of the LEEC architecture. | ||
For simplicity, the LEECs containing complexes 1–4 are referred to as L1–L4. The devices were characterized under an inert atmosphere by applying a pulsed current (1 kHz, 50% duty cycle). The resulting applied average current density was 100 A m−2 due to the duty cycle of 50%. LEECs driven by this operational mode typically show instantaneous luminance, while the voltage needed to maintain the applied current drops rapidly over time to reach a minimum value. This behaviour is explained by taking into account the presence of ions, which dissociate and move towards the electrodes, forming an electric double layer thereby reducing the injection barrier and finally contributing to the formation of p and n electrochemically doped regions within the emitting layer. The luminance and voltage versus time is depicted in Fig. 9 and key parameters are summarized in Table 5.
| Device | Lummaxa (cd m−2) | t 50cd (s) | t 1/2 (min) | Efficacymaxd (cd A−1) | PEmaxe (lm W−1) | EQEmaxf (%) | λ EL (nm) | CIEh (x, y) |
|---|---|---|---|---|---|---|---|---|
| a Maximum luminance. b Time to reach 50 cd m−2. c Time to reach one-half of the maximum luminance. d Maximum efficacy. e Maximum power efficiency. f Maximum external quantum efficiency. g Emission maximum in electroluminescence. h CIE coordinates obtained from the electroluminescence spectrum at the beginning of operation. | ||||||||
| L1 | 1060 | <5 | 20 | 10.5 | 4.6 | 3.8 | 492, 521 | 0.34, 0.49 |
| L2 | 101 | <5 | 2 | 1.0 | 0.4 | 0.4 | 485, 535 (sh) | 0.23, 0.39 |
| L3 | 29 | — | 0.2 | 0.3 | <0.1 | 0.1 | 486, 553 | 0.31, 0.45 |
| L4 | 8 | — | 0.1 | <0.1 | <0.1 | <0.1 | 492(sh), 549 | 0.32, 0.48 |
| O1 | 72 | — | — | 5.7 | 5.3 | 2.1 | 490, 554 | 0.34, 0.46 |
All LEECs exhibit instantaneous luminance, although with different coloured emissions (Fig. 10). While initially L1, L3 and L4 exhibit blue-green emission, L2 emits sky-blue light. The electroluminescence of L1, L3 and L4 consists of two peaks centred at 492 and 521 nm for L1, 486 and 553 nm for L3, and 492 and 549 nm for L4. However, L2 presents a maximum at 485 nm with a shoulder at 535 nm, which confirms the observed sky-blue colour (CIE: 0.23, 0.39). Nevertheless, this value is among the bluest iTMC LEECs reported employing ionic liquids, with the bluest being only moderately bluer (CIE: 0.20, 0.34) than our own.29
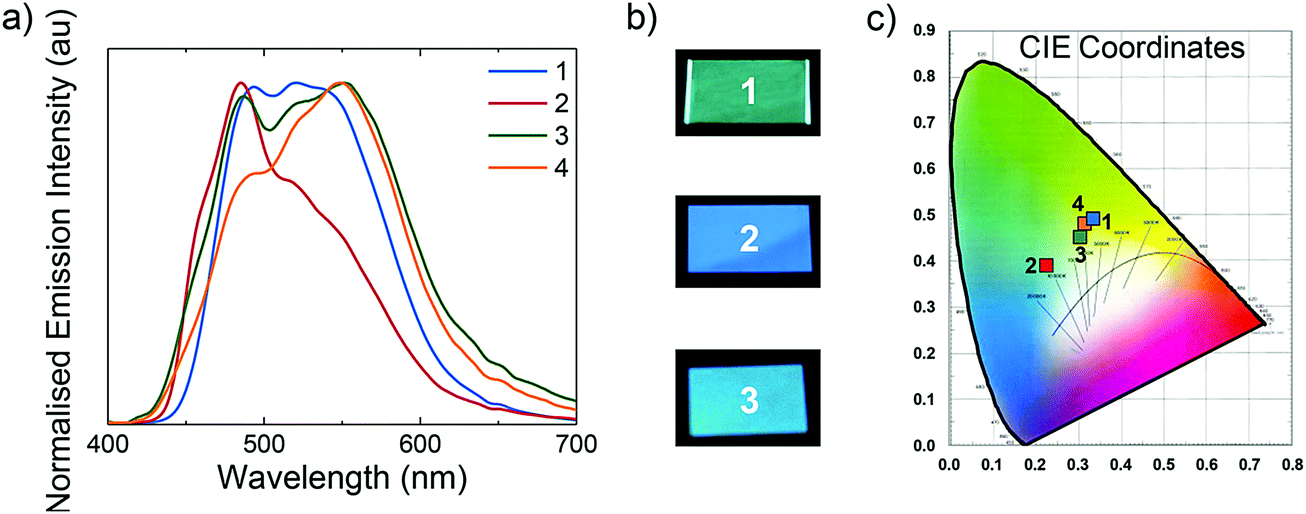 | ||
| Fig. 10 (a) Normalised electroluminescence spectra for L1–L4. (b) Photographs of L1–L3 under operation. (c) CIE coordinate chart. | ||
In the case of L1 and L2, the luminance initially rises during the first 12 and 40 seconds, respectively, and then decreases. In the case of L3 and L4 the luminance initially drops. The device performance of L1–L4 is typically dependent on the electrochemical and thin film photophysical properties discussed above. On the one hand, the voltage applied to L1 and L2 remains constant once efficient charge injection is achieved (∼1 minute to reach the minimum voltage in both cases), which is indicative of an electrochemically stable system. However, for L3 and L4 the voltage increases after 1 and 12 minutes, respectively, clearly demonstrating the instability of these devices, which must be due to the presence of the o-Xylbiim ancillary ligand and its irreversible electrochemistry upon reduction. This behaviour could be related to the chemical degradation of the active material leading to an increase in the layer resistance. The observed device efficiencies follow trends observed in the thin-film photoluminescence quantum yield, with L1 (complex 1 has a ΦPL = 65%) a bright and efficient device with a maximum luminance of 1060 cd m−2 and 10.5 cd A−1. Device L2 (complex 2 has ΦPL = 17%) shows moderately blue emissive efficiency, achieving 101 cd m−2 and 1 cd A−1, whereas L3 and L4 display lower luminance values than 40 cd m−2 (0.3 cd A−1) due to their lower thin-film ΦPL values.
As previously reported for other blue-green LEECs,10b,16a,30 the device lifetimes presented here are not very long (in the range of 8 seconds to 20 minutes). In general, the colour stability of blue-green LEECs is rarely described. In 2013, Meier et al. reported an example of a blue-emitting iridium complex that suffers a red shift of the electroluminescence, which led to a blue-greenish emission during the LEEC operation. Hence, the importance of studying the colour stability during the electroluminescence operation in blue-green emitters is of particular interest.10a Although the origin of this behaviour is unclear, one hypothesis is that the degradation of the emitter is the main reason. To verify whether emitter degradation is the cause of poor device lifetime in L1–L4, the electroluminescence spectra of the four LEECs versus operation time was investigated (Fig. 11). With the exception of L3, the colour emission remains reasonably stable throughout the operation of the device. The fact that L3 is colour unstable is also supported by the steeper voltage increase observed during the LEEC operation (Fig. 9c), likely due to the chemical degradation of the complex. The stable sky-blue electroluminescence of L2 is of particular interest because this LEEC shows good colour quality and stability with comparable performance to blue LEECs.1a,3b Hence, these experiments appear to identify for the first time that the decrease in light emission in these LEECs is not related to the direct emitter degradation, implying that the emitters located in the non-doped light-emitting zone of the device are unaffected. It is still possible that the emitters in the doped zones (where they are oxidized or reduced) do react and degrade. Further studies on emission angle-dependent experiments are needed to try and identify the emission zone in the thin film and to see if these zones move over time.
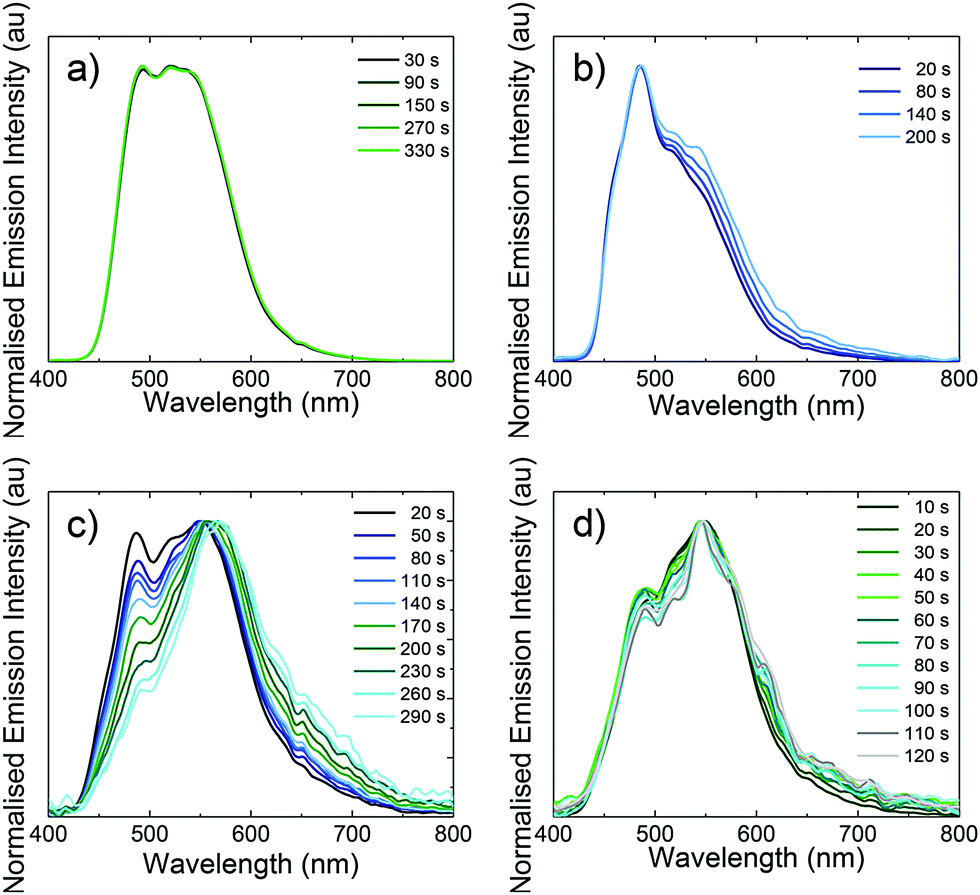 | ||
| Fig. 11 Normalised electroluminescence spectra versus time for (a) L1; (b) L2; (c) L3; and (d) L4. | ||
In general, many blue-green LEECs are reported to exhibit poor performance, probably due to exciton–exciton quenching.31 An attempt to improve the device efficiency was explored by integrating the most highly emissive complex, 1, in an OLED architecture. The device was prepared by sequential deposition of a 30 nm PEDOT:PSS layer as the hole injection layer (HIL), 35 nm of N4,N4′-di(naphthalen-1-yl)-N4,N4′-bis(4-vinylphenyl)biphenyl-4,4′-diamine (VNPB) as the hole transport layer (HTL), a 30 nm emissive layer (EML), 40 nm of 1,3-bis[3,5-di(pyridin-3-yl)phenyl]benzene (BmPyPhB) as an electron transport material (ETM) and barium (5 nm)–silver (70 nm) as the cathode. The HIL was coated in air whereas the HTL and EML were coated under an inert atmosphere. Before the emissive layer coating, the HTL was thermally treated in order to make the VNPB resistant to toluene.32 The emissive layer was deposited from a 10 mg mL−1 anisole solution, which consists of a mixture of 4,4′,4′′-tris(carbazol-9-yl)triphenylamine (TcTa), 2,7-bis(diphenylphosphoryl)-9,9′-spirobifluorene (SPPO13) and complex 1. The concentration of 1 was 10 wt% with respect to solids. The OLED, O1, was characterized by a voltage scan and by simultaneously measuring the luminance and current (I–V–L curve) and their characteristics are depicted in Fig. 12. The OLED showed a greener electroluminescence (CIE: 0.34, 0.46) than the corresponding LEEC L1 (0.34, 0.49), as the peak at 490 nm had lower intensity than the peak at 554 nm. The turn-on voltage for both current and luminance was at approximately 2.4–2.5 V, indicating balanced carriers in the device. The power efficiency was slightly improved (5.3 lm W−1), although the efficacy (5.7 cd A−1) is lower compared to L1 (10.5 cd A−1). Hence, this lower efficacy should be not related to the exciton–exciton quenching but more related to the different device architecture in O1.
 | ||
| Fig. 12 Luminance (solid blue line) and current density (red dotted line) versus voltage for the OLED containing 1 (a); its normalised electroluminescence spectra (b); the device architecture and the corresponding energy level diagram (c); the chemical structure of the components used for the OLED preparation (d). | ||
Conclusions
The first examples of cationic iridium(III) complexes bearing cyclometalating pyrimidine rings are reported. Combining electron-withdrawing pyrimidyl nitrogen atoms with ambivalent methoxy substituents gives C∧N ligands with blue-shifted emission properties comparable to fluorinated C∧N ligands such as dFppy. The four complexes are the bluest cationic iridium(III) complexes reported to date (λPL = 464–515 nm; ΦPL = 73–81% in MeCN solution) that do not contain sp2 carbon–fluorine bonds. In particular, complexes 2 and 4, bearing the more electrochemically resilient –CF3 group on the pyridine moiety of the C∧N ligands exhibit ligand-centred emission that is independent of the nature of the N∧N ligand completing the coordination sphere. To that end, complex 2 is particularly remarkable as it is a rare example of a complex bearing a non-chromophoric dtBubpy ancillary ligand. In LEECs, the emitters show stabilities (t1/2 = 0.1–20 min) and efficiencies (EQE = 0.1–3.8%) similar to the previously reported LEECs employing sp2-fluorinated iridium(III) complexes. However, the unique and remarkable colour stability of these emitters in the device, even as the devices die, has allowed us to show for the first time that emitter degradation in the non-doped light-emitting zone is not an implicating factor in the stability of LEEC devices. Further studies pertaining to the chemical integrity of the emitters localised at the electrode interfaces are ongoing to determine if the redox processes in the doped zones contribute to the degradation of these devices.Conflicts of interest
There are no conflicts to declare.Acknowledgements
The St Andrews team acknowledges the University of St Andrews and the Engineering and Physical Sciences Research Council for financial support (EP/M02105X/1; EP/J500549/1; EP/K503162/1; EP/L505097/1) and Johnson Matthey and Umicore AG for the gift of materials. The Birmingham team acknowledges the European Research Council (HetIridium, CIG-322280). We thank the EPSRC UK National Mass Spectrometry Facility at Swansea University for analytical services. The Valencian team acknowledges the financial support from the Spanish Ministry of Economy and Competitiveness (MINECO) via the Unidad de Excelencia María de Maeztu MDM-2015-0538 and MAT2014-55200, PCIN-2015-255 and CTQ2015-71154-P and the Generalitat Valenciana (PROMETEO/2016/135). C. M. thanks MINECO for her predoctoral contract.References
- (a) A. F. Henwood and E. Zysman-Colman, Top. Curr. Chem., 2016, 374, 36 CrossRef PubMed; (b) S. Tang and L. Edman, Top. Curr. Chem., 2016, 374, 40 CrossRef PubMed; (c) T. Hu, L. He, L. Duan and Y. Qiu, J. Mater. Chem., 2012, 22, 4206–4215 RSC; (d) R. D. Costa, E. Ortí, H. J. Bolink, F. Monti, G. Accorsi and N. Armaroli, Angew. Chem., Int. Ed., 2012, 51, 8178–8211 CrossRef CAS PubMed.
- Q. Pei, G. Yu, C. Zhang, Y. Yang and A. J. Heeger, Science, 1995, 269, 1086–1088 CrossRef CAS PubMed.
- (a) A. F. Henwood and E. Zysman-Colman, Chem. Commun., 2017, 53, 807–826 RSC; (b) D. Ma, T. Tsuboi, Y. Qiu and L. Duan, Adv. Mater., 2017, 29, 1603253 CrossRef PubMed; (c) P. Li, Q.-Y. Zeng, H.-Z. Sun, M. Akhtar, G.-G. Shan, X.-G. Hou, F.-S. Li and Z.-M. Su, J. Mater. Chem. C, 2016, 4, 10464–10470 RSC; (d) Q. Zeng, F. Li, T. Guo, G. Shan and Z. Su, Sci. Rep., 2016, 6, 27613 CrossRef CAS PubMed.
- (a) A. J. Bader, A. A. Ilkevich, I. V. Kosilkin and J. M. Leger, Nano Lett., 2011, 11, 461–465 CrossRef PubMed; (b) G. Qian, Y. Lin, G. Wantz, A. R. Davis, K. R. Carter and J. J. Watkins, Adv. Funct. Mater., 2014, 24, 4484–4490 CrossRef CAS.
- (a) M. F. Aygüler, M. D. Weber, B. M. D. Puscher, D. D. Medina, P. Docampo and R. D. Costa, J. Phys. Chem. C, 2015, 119, 12047–12054 CrossRef; (b) H. Zhang, H. Lin, C. Liang, H. Liu, J. Liang, Y. Zhao, W. Zhang, M. Sun, W. Xiao, H. Li, S. Polizzi, D. Li, F. Zhang, Z. He and W. C. H. Choy, Adv. Funct. Mater., 2015, 25, 7226–7232 CrossRef CAS.
- S. van Reenen, P. Matyba, A. Dzwilewski, R. A. J. Janssen, L. Edman and M. Kemerink, J. Am. Chem. Soc., 2010, 132, 13776–13781 CrossRef CAS PubMed.
- (a) A. Asadpoordarvish, A. Sandström, C. Larsen, R. Bollström, M. Toivakka, R. Österbacka and L. Edman, Adv. Funct. Mater., 2015, 25, 3238–3245 CrossRef CAS; (b) A. Sandström, A. Asadpoordarvish, J. Enevold and L. Edman, Adv. Mater., 2014, 26, 4975–4980 CrossRef PubMed.
- L. He, L. Duan, J. Qiao, R. Wang, P. Wei, L. Wang and Y. Qiu, Adv. Funct. Mater., 2008, 18, 2123–2131 CrossRef CAS.
- X. Yang, X. Xu and G. Zhou, J. Mater. Chem. C, 2015, 3, 913–944 RSC.
- (a) S. B. Meier, W. Sarfert, J. M. Junquera-Hernández, M. Delgado, D. Tordera, E. Ortí, H. J. Bolink, F. Kessler, R. Scopelliti, M. Grätzel, M. K. Nazeeruddin and E. Baranoff, J. Mater. Chem. C, 2013, 1, 58–68 RSC; (b) L. He, L. Duan, J. Qiao, G. Dong, L. Wang and Y. Qiu, Chem. Mater., 2010, 22, 3535–3542 CrossRef CAS . For representative of white-emitting LEECs see: ; (c) L. He, J. Qiao, L. Duan, G. Dong, D. Zhang, L. Wang and Y. Qiu, Adv. Funct. Mater., 2009, 19, 2950–2960 CrossRef CAS; (d) A. B. Tamayo, S. Garon, T. Sajoto, P. I. Djurovich, I. M. Tsyba, R. Bau and M. E. Thompson, Inorg. Chem., 2005, 44, 8723–8732 CrossRef CAS PubMed.
- H.-B. Wu, H.-F. Chen, C.-T. Liao, H.-C. Su and K.-T. Wong, Org. Electron., 2012, 13, 483–490 CrossRef CAS.
- (a) H. J. Bolink, E. Coronado, R. D. Costa, P. Gavina, E. Ortí and S. Tatay, Inorg. Chem., 2009, 48, 3907–3909 CrossRef CAS PubMed; (b) M. S. Lowry and S. Bernhard, Chem. – Eur. J., 2006, 12, 7970–7977 CrossRef CAS PubMed; (c) S. Ladouceur and E. Zysman-Colman, Eur. J. Inorg. Chem., 2013, 2985–3007 CrossRef CAS.
- (a) V. Sivasubramaniam, F. Brodkorb, S. Hanning, H. P. Loebl, V. van Elsbergen, H. Boerner, U. Scherf and M. Kreyenschmidt, J. Fluorine Chem., 2009, 130, 640–649 CrossRef CAS; (b) Y. Zheng, A. S. Batsanov, R. M. Edkins, A. Beeby and M. R. Bryce, Inorg. Chem., 2012, 51, 290–297 CrossRef CAS PubMed; (c) D. Tordera, J. J. Serrano-Pérez, A. Pertegás, E. Ortí, H. J. Bolink, E. Baranoff, M. K. Nazeeruddin and J. Frey, Chem. Mater., 2013, 25, 3391–3397 CrossRef CAS.
- M. L. P. Reddy and K. S. Bejoymohandas, J. Photochem. Photobiol., C, 2016, 29, 29–47 CrossRef CAS.
- (a) J. Frey, B. F. E. Curchod, R. Scopelliti, I. Tavernelli, U. Rothlisberger, M. K. Nazeeruddin and E. Baranoff, Dalton Trans., 2014, 43, 5667–5679 RSC; (b) C. Hansch, A. Leo and R. W. Taft, Chem. Rev., 1991, 91, 165–195 CrossRef CAS.
- (a) S. Evariste, M. Sandroni, T. W. Rees, C. Roldan-Carmona, L. Gil-Escrig, H. J. Bolink, E. Baranoff and E. Zysman-Colman, J. Mater. Chem. C, 2014, 2, 5793–5804 RSC; (b) H. Oh, K.-M. Park, H. Hwang, S. Oh, J. H. Lee, J.-S. Lu, S. Wang and Y. Kang, Organometallics, 2013, 32, 6427–6436 CrossRef CAS; (c) J. Lee, H. Oh, J. Kim, K.-M. Park, K. S. Yook, J. Y. Lee and Y. Kang, J. Mater. Chem. C, 2014, 2, 6040 RSC.
- (a) B. J. Coe, M. Helliwell, J. Raftery, S. Sanchez, M. K. Peers and N. S. Scrutton, Dalton Trans., 2015, 44, 20392–20405 RSC; (b) B. J. Coe, M. Helliwell, S. Sanchez, M. K. Peers and N. S. Scrutton, Dalton Trans., 2015, 44, 15420–15423 RSC.
- (a) Y.-T. Chang, J.-K. Chang, Y.-T. Lee, P.-S. Wang, J.-L. Wu, C.-C. Hsu, I. W. Wu, W.-H. Tseng, T.-W. Pi, C.-T. Chen and C.-I. Wu, ACS Appl. Mater. Interfaces, 2013, 5, 10614–10622 CrossRef CAS PubMed; (b) T. Duan, T.-K. Chang, Y. Chi, J.-Y. Wang, Z.-N. Chen, W.-Y. Hung, C.-H. Chen and G.-H. Lee, Dalton Trans., 2015, 44, 14613–14624 RSC; (c) Q.-L. Xu, X. Liang, L. Jiang, Y. Zhao and Y.-X. Zheng, Dalton Trans., 2016, 45, 7366–7372 RSC.
- (a) A. F. Henwood, S. Evariste, A. M. Z. Slawin and E. Zysman-Colman, Faraday Discuss., 2014, 174, 165–182 RSC; (b) A. F. Henwood, A. K. Bansal, D. B. Cordes, A. M. Z. Slawin, I. D. W. Samuel and E. Zysman-Colman, J. Mater. Chem. C, 2016, 4, 3726–3737 RSC.
- (a) D. Rota Martir, A. K. Bansal, V. Di Mascio, D. B. Cordes, A. F. Henwood, A. M. Z. Slawin, P. C. J. Kamer, L. Martinez-Sarti, A. Pertegas, H. J. Bolink, I. D. W. Samuel and E. Zysman-Colman, Inorg. Chem. Front., 2016, 3, 218–235 RSC; (b) V. N. Kozhevnikov, Y. Zheng, M. Clough, H. A. Al-Attar, G. C. Griffiths, K. Abdullah, S. Raisys, V. Jankus, M. R. Bryce and A. P. Monkman, Chem. Mater., 2013, 25, 2352–2358 CrossRef CAS.
- N. Miyaura, T. Yanagi and A. Suzuki, Synth. Commun., 1981, 11, 513–519 CrossRef CAS.
- E. Baranoff, B. F. E. Curchod, J. Frey, R. Scopelliti, F. Kessler, I. Tavernelli, U. Rothlisberger, M. Grätzel and M. K. Nazeeruddin, Inorg. Chem., 2011, 51, 215–224 CrossRef PubMed.
- R. D. Costa, E. Ortí, H. J. Bolink, S. Graber, S. Schaffner, M. Neuburger, C. E. Housecroft and E. C. Constable, Adv. Funct. Mater., 2009, 19, 3456–3463 CrossRef CAS.
- (a) Y.-Y. Lyu, Y. Byun, O. Kwon, E. Han, W. S. Jeon, R. R. Das and K. Char, J. Phys. Chem. B, 2006, 110, 10303–10314 CrossRef CAS PubMed; (b) A.-F. Ma, H.-J. Seo, S.-H. Jin, U.-C. Yoon, M.-H. Hyun, S.-K. Kang and Y.-I. Kim, Bull. Korean Chem. Soc., 2009, 30, 2754–2758 CrossRef CAS.
- M. S. Lowry, J. I. Goldsmith, J. D. Slinker, R. Rohl, R. A. Pascal, G. G. Malliaras and S. Bernhard, Chem. Mater., 2005, 17, 5712–5719 CrossRef CAS.
- V. V. Pavlishchuk and A. W. Addison, Inorg. Chim. Acta, 2000, 298, 97–102 CrossRef CAS.
- C. M. Cardona, W. Li, A. E. Kaifer, D. Stockdale and G. C. Bazan, Adv. Mater., 2011, 23, 2367 CrossRef CAS PubMed.
- W. H. Melhuish, J. Phys. Chem., 1961, 65, 229–235 CrossRef CAS.
- (a) C.-H. Yang, J. Beltran, V. Lemaur, J. Cornil, D. Hartmann, W. Sarfert, R. Fröhlich, C. Bizzarri and L. De Cola, Inorg. Chem., 2010, 49, 9891–9901 CrossRef CAS PubMed; (b) A. F. Henwood and E. Zysman-Colman, Iridium(III) in Optoelectronic and Photonics Applications, John Wiley & Sons, Ltd, 2017, pp. 275–357 Search PubMed.
- (a) D. Tordera, A. M. Bünzli, A. Pertegás, J. M. Junquera-Hernández, E. C. Constable, J. A. Zampese, C. E. Housecroft, E. Ortí and H. J. Bolink, Chem. – Eur. J., 2013, 19, 8597–8609 CrossRef CAS PubMed; (b) L. He, L. Duan, J. Qiao, D. Zhang, L. Wang and Y. Qiu, Chem. Commun., 2011, 47, 6467–6469 RSC; (c) B. Chen, Y. Li, W. Yang, W. Luo and H. Wu, Org. Electron., 2011, 12, 766–773 CrossRef CAS.
- S. B. Meier, D. Hartmann, D. Tordera, H. J. Bolink, A. Winnacker and W. Sarfert, Phys. Chem. Chem. Phys., 2012, 14, 10886–10890 RSC.
- J. Xu, O. Voznyy, R. Comin, X. Gong, G. Walters, M. Liu, P. Kanjanaboos, X. Lan and E. H. Sargent, Adv. Mater., 2016, 28, 2807–2815 CrossRef CAS PubMed.
Footnotes |
| † Electronic supplementary information (ESI) available: Synthesis, CIF of the crystal structures. CCDC 1546695–1546698. For ESI and crystallographic data in CIF or other electronic format see DOI: 10.1039/c7tc03110f |
| ‡ The data supporting this study are available at http://dx.doi.org/10.17630/54ffbbef-f259-4a45-894b-b67a0f99039b. |
| This journal is © The Royal Society of Chemistry 2017 |