 Open Access Article
Creative Commons Attribution 3.0 Unported Licence
Probing the local structure of the near-infrared emitting persistent phosphor LiGa5O8:Cr3+†
Olivier Q.
De Clercq
 ab,
Lisa I. D. J.
Martin
 ab,
Katleen
Korthout
 ab,
Jevgenij
Kusakovskij
 c,
Henk
Vrielinck
 c and
Dirk
Poelman
 *ab
*ab
aLumiLab, Department of Solid State Sciences, Ghent University, Ghent, Belgium. E-mail: Dirk.Poelman@UGent.be
bCenter for Nano- and Biophotonics (NB-Photonics), Ghent University, Ghent, Belgium
cEMR group, Department of Solid State Sciences, Ghent University, Ghent, Belgium
First published on 26th September 2017
Abstract
Near-infrared emitting persistent phosphors have promising applications in the field of in vivo medical imaging. In this paper, we prepared the persistent phosphor LiGa5O8:Cr3+ (LGO:Cr) which exhibits emission in the tissue transparency window and shows afterglow for multiple hours after excitation. Addition of Si or Ge improves the persistent luminescence. X-ray diffraction and electron microscopy, coupled with elemental analysis, revealed that there is a maximum amount of Si or Ge that can be incorporated in the host. Via X-ray absorption spectroscopy and electron paramagnetic resonance experiments, we studied the local environment of chromium in the LGO spinel host. The presence of both Cr3+ and Cr4+ on octahedral sites in LGO was confirmed. Electron paramagnetic resonance showed that Cr3+ resides in a rhombically distorted octahedral lattice site and that the Cr3+ local environment is sensitive to variation in point defects in the surrounding.
Introduction
Persistent phosphors are luminescent materials that keep emitting light long after the optical excitation has stopped. Since the discovery of the efficient green emitting phosphor SrAl2O4:Eu,Dy by Matsusawa et al. in 1996, these materials have found uses in a wide range of applications such as toys, displays and safety signage.1–4 In 2007, Le Masne de Chermont and coworkers showed in their proof-of-principle experiments that near-infrared emitting long persistent phosphors (NIR LPP) can also be used in bio-imaging applications as an alternative to radioactive probes.5 This application requires an emission spectrum in a wavelength region where absorption and scattering of light by blood and tissue components is minimal. Two wavelength ranges were identified: one between 650 and 950 nm, and one between 1000 and 1350 nm. These are known as the first and second tissue transparency window, respectively.6Persistent phosphors have several advantages with regard to this application, in comparison with other optically active particles, such as upconversion nanoparticles, quantum dots or organic fluorophores.7–10 For instance, autofluorescence effects can be greatly reduced, which enhances the signal to background ratio of measurements. Local heating effects as a consequence of high-power laser excitation, which is typically needed for upconversion, can also be avoided.
First generation NIR LPP were based on Eu2+ emission,11,12 as the europium ion shows the most efficient visible light persistent luminescence, in phosphors such as SrAl2O4:Eu,Dy (green), Sr2MgSi2O7:Eu,Dy (blue) and CaAl2O4:Eu,Nd (violet-blue). However, the Eu2+ emission needs to be significantly redshifted if one wants to use the LPP for imaging purposes. This limits the types of host that can be used for medical imaging purposes. Therefore, transition metals such as manganese or chromium that have longer emission wavelengths in a large variety of hosts have been investigated as alternative luminescent centers for this application.7
Second generation NIR LPP based on broad Cr3+ emission around 700 nm have gained interest since the development of Cr-doped ZnGa2O4 (ZGO:Cr) and other similar gallate hosts.7,8,13 The afterglow efficiency of ZGO:Cr can be greatly enhanced by incorporation of Ge ions.14–17 A model for the mechanism of persistent luminescence in ZGO:Cr has been developed throughout the years by a combined analysis of data obtained via different techniques.18–21 The currently accepted model attributes the afterglow behavior to the interaction between the Cr3+ ion and nearby anti-site defects in ZGO spinel.
In this paper, we investigate the structural properties of the persistent phosphor LiGa5O8:Cr3+ (LGO:Cr) that was reported to exhibit very efficient NIR persistent luminescence.22 The LGO:Cr phosphor has excellent properties for potential bioimaging applications, as it combines emission around 718 nm with good chemical stability in water and low toxicity.22,23
The overall structure of the LGO host was investigated using X-ray diffraction (XRD), and the effects of the addition of Si(IV) and Ge(IV) were studied. The latter tetravalent ions introduce charge mismatch in the lattice, which promotes the formation of compensating defects. The resulting defects were found to strongly increase the persistent luminescence time and intensity of LGO:Cr. Extended X-ray absorption fine structure (EXAFS) and electron paramagnetic resonance (EPR) measurements were conducted to probe the local environment of the Cr ions. From the X-ray absorption near edge structure (XANES) analysis, Cr3+ and Cr4+ species were identified, both located in octahedrally coordinated sites of the spinel lattice. EPR was used to confirm the coordination of Cr3+, and allowed to study the deformation of the site upon incorporation of the tetravalent Si or Ge ions in the host.
The present work thus extends previous investigations on LGO:Cr by combining PL, EXAFS and EPR to investigate the dopant incorporation of the Cr ions in LGO. In addition, the effects of codoping LGO:Cr with tetravalent ions were studied for the first time.
Experimental
LGO:Cr powder samples were prepared via solid state reaction. Stoichiometric amounts of Li2CO3 (99.998%, Alfa Aesar) and Ga2O3 (99.99%, Alfa Aesar) were ground in an agate mortar and transferred to open alumina crucibles. Cr was added as Cr2O3 (99.97%, Alfa Aesar) with a molar concentration of 1% with respect to the Ga content. M(IV) (M = Ge or Si) was added as GeO2 (99.999%, Alfa Aesar) or SiO2 (99.9%, Alfa Aesar), respectively, to the LGO spinel structure according to the substitution LiGa5−xMxO8:Cr3+ (x = 0.2, 0.4 or 1).This starting mixture was heated in ambient air to 800 °C for 2 h in order to remove the carbon content in the precursors, and subsequently to 1300 °C for 4 h to form the final host.22 The employed heating rate was 300 °C h−1.
Crystallographic phases of the obtained powders were checked using X-ray diffraction (XRD) with a Bruker D5000 θ–2θ diffractometer using Cu-Kα radiation (40 kV, 40 mA, λ = 0.154 nm) and compared with literature data (PDF-2 database of the ICDD).
SEM-EDX measurements were performed using a Hitachi S-3400 N scanning electron microscope (SEM), equipped with a Thermo Scientific Noran 7 energy-dispersive X-ray detector (EDX).
Photoluminescence emission and excitation spectra of the samples were measured with a fluorescence spectrometer (FS920, Edinburgh Instruments) using a monochromated 450 W Xe-arc as the excitation source. Afterglow decay profiles were measured using a Centronic OSD100-5T silicon photodiode, calibrated in absolute radiometric units and connected to a Hamamatsu C9329 photosensor amplifier. Prior to afterglow measurements, the samples were excited for 5 min by 1000 lx light of an unfiltered xenon arc lamp.
EPR spectra were recorded at the X band frequency (9.42 GHz) on a Bruker ESP300E spectrometer and at the Q band frequency (34.0 GHz) on a Bruker Elexsys E500 spectrometer. All EPR spectra were recorded at room temperature and with a microwave power of typically 2 mW.
EXAFS and XANES measurements were performed at the Cr K edge at the Dutch-Belgian beam line (DUBBLE, BM26A), ESRF, Grenoble, France.24,25 Reference measurements were done on Cr foil and pressed pellets of Cr2O3 (99.97%, Alfa Aesar) and CrO2 (99.97%, Alfa Aesar). All spectra were recorded at room temperature. The atomic positions in the first coordination shells of the Mn atom were fitted by means of the FEFF6 code using the Athena and Artemis software by Ravel and Newville.26
Results and discussion
X-ray diffraction and crystal structure
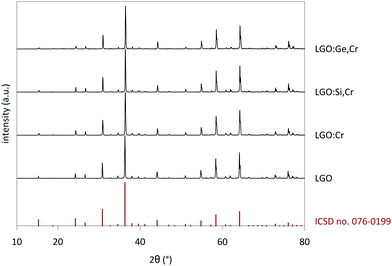
Measured XRD patterns show a crystalline structure with good correspondence with the reference pattern for LiGa5O8 (ICSD file 076-0199) (Fig. 1). The lattice constant was determined as a = 8.208 Å for the undoped powders, after correcting for small height displacements during the positioning of the sample holder.28 The reference pattern corresponds to a crystal with space group P4332, which is a derivative of the Fd3m space group of spinel crystals.29,30LGO has a cubic crystal structure with four formula units in the unit cell. Oxygen anions form a sublattice with a fcc framework, with cations occupying interstitial sites. 1/8 of the possible tetrahedral and 1/2 of the possible octahedral cation lattice sites are occupied in an ordered fashion. Tetrahedral sites are occupied by Ga3+ on the 8c Wyckoff positions; the remaining Ga3+ occupies 12d sites and Li+ occupies 4b sites. The resulting crystal structure is that of an inverse spinel, and LiGa5O8 can thus also be written as (Ga2)T(LiGa3)OO8, where the subscripts ‘T’ and ‘O’ refer to tetrahedral and octahedral coordination respectively. It was reported that there is a slight mixing between Li and Ga on their respective Wyckoff positions, resulting in a deviation from the ordered LGO crystal structure.29,31
M(IV) (M = Si or Ge) was added to the LGO spinel structure according to the substitution LiGa5−xMxO8:Cr3+. Note that this formula unit is not charge neutral, so the substitution should lead to the formation of charge compensation point defects in the host that could be beneficial to the persistent luminescence.
Upon doping LGO with Cr3+ and M(IV), the lattice parameter shifted a few 0.1%, which is within the experimental errors of determination of the peak positions. The negligible change in a indicates good incorporation of the dopants in the host, which is expected in view of the similar effective ionic radii of the cations (see Table 1).27 The lattice shifts were determined from the most intense peaks in the XRD patterns. Fig. S1–S3 (ESI†) show detailed XRD patterns of selected LGO samples. Contrary to previously reported work,32 no impurities from a LiGaO2 side phase could be measured, which is an advantage of the solid state synthesis route employed here. When the M(IV) content is increased to x = 1 (Fig. S2–S3, ESI†), traces of Si- and Ge-containing side phases appear in the measured XRD patterns, which suggests that there is a maximum M(IV) concentration that can be incorporated in the LGO lattice.
| Element | Charge | Tetrahedral | Octahedral |
|---|---|---|---|
| Li | 1+ | 0.59 | 0.76 |
| Si | 4+ | 0.26 | 0.4 |
| Cr | 3+ | — | 0.615 |
| 4+ | 0.41 | 0.55 | |
| Ga | 3+ | 0.47 | 0.62 |
| Ge | 4+ | 0.39 | 0.53 |
SEM-EDX
A discrepancy between nominal and actual M(IV) content is evident from elemental analysis by SEM-EDX. The values from EDX were obtained via semi-quantitative analysis and not via the measurement of metal standards. Nominal and measured ratios of M/Ga are provided in Table 2. The incorporation of M(IV) ions in the host is less than the nominal content for every value of x. The higher the M(IV) content, the closer the measured ratios tend to the nominal ratios. However, elemental mapping images and XRD patterns show that an important fraction of M(IV) is not incorporated in LGO but present in side phases at higher concentrations. Fig. S4–S8 (ESI†) show the microstructure of several LGO powder samples. For M(IV) codoped samples with x = 1, it is clear that the Ga and M(IV) EDX signals do not fully overlap, but are separated in the SEM image in specific regions. For codoped samples with x = 0.4, there is a good overlap between the Ga and M(IV) signals. Ge or Si are thus not fully incorporated in the LGO lattice at higher concentrations, despite the similar ionic radii of Ge4+, Si4+ and Ga3+. This is most probably a result of the non-isovalent M(IV)-for-Ga(III) substitution, which requires charge compensation.| LGO:Si,Cr | Si/Ga ratio | Cr/Ga ratio | |
|---|---|---|---|
| Nominal | EDX | EDX | |
| x = 0.2 | 0.04 | 0.018 | 0.012 |
| x = 0.4 | 0.09 | 0.037 | 0.011 |
| x = 1 | 0.25 | 0.181 | 0.015 |
| LGO:Ge,Cr | Ge/Ga ratio | Cr/Ga ratio | |
|---|---|---|---|
| Nominal | EDX | EDX | |
| x = 0.2 | 0.04 | 0.017 | 0.009 |
| x = 0.4 | 0.09 | 0.062 | 0.016 |
| x = 1 | 0.25 | 0.222 | 0.013 |
Measured chromium quantities correspond with nominal values within the error margins for semi-quantitative analysis for all samples, except x = 0.4 samples. Concentrations were determined using EDX, with a relative error up to 20% (combined error due to sample inhomogeneity and intrinsic EDX errors). Due to the low Cr concentration in the sample, the EDX signal is low, but seems homogeneous. Mappings show no appreciable sign of clustering inside the material and the Cr signal nicely overlaps with other cation signals, indicating that Cr is well-incorporated.
X-ray absorption spectroscopy
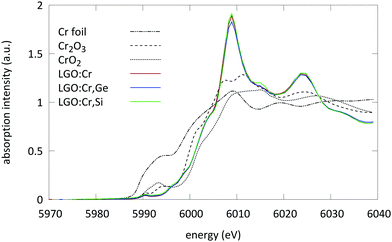
The XANES spectra of the samples under study are displayed in Fig. 2. All spectra were aligned and merged using the Athena software to improve the S/N ratio.26From these spectra two things can be observed: first, the pre-edge region of the measured samples shows a weak pre-edge which is typical for Cr ions in an octahedral coordination. XANES spectra of Cr ions which are tetrahedrally coordinated exhibit a single intense pre-edge peak which can be assigned to a dipole allowed transition of a 1s electron to an unoccupied antibonding t2* tetrahedral orbital.33 This intense peak is absent here.
Secondly, the absorption edge position of the measured samples is located between the absorption step of Cr2O3 and CrO2. This suggests the presence of Cr ions in both trivalent and tetravalent oxidation state.
In order to confirm these assumptions, EXAFS spectra were collected at the Cr K edge. The EXAFS spectra were analysed using the Artemis software (Fig. 3).26 The spectra of the samples were analysed together using multiple data set fitting (MDS). This approach is often used if parameters are expected to be the same in different data sets. As such the number of parameters used can be maintained low.
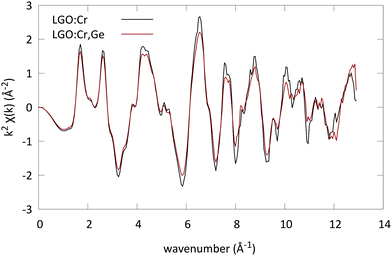 | ||
| Fig. 3 EXAFS spectra of LGO:Cr and LGO:Ge,Cr (x = 0.4) converted to k-space. The spectra were recorded at the Cr K edge, and accumulated for 4 scans. | ||
For all spectra a Hanning window was used (k-range: [2.683 Å−1, 10.84 Å−1], and R-range: [1 Å, 4.236 Å]). The structure of LGO was introduced to generate the scattering paths; both the octahedral and the tetrahedral Ga sites were used as possible locations for the Cr ion in the lattice. The scattering paths were calculated up to 4.5 Å in R-space. Next to the possible substitution on two sites, the possible presence of two oxidation states was evaluated as well.
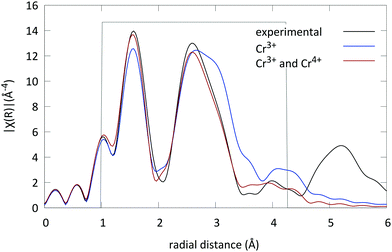
First all four virtual spectra (combining two coordinations and two valence states) were calculated to evaluate if one of the possibilities was preferential. The best match was found when the Cr ions occupy the octahedral Ga sites in the lattice. Subsequently the spectra were fitted using MDS with only this site and one oxidation state for the Cr ions (3+). An R-factor of R = 0.03 was found (see Fig. 4).
Subsequently the presence of another Cr absorber on the octahedral Ga site was introduced. The fit significantly improved and an energy shift of 0.82 eV was found. This energy shift indicates a different oxidation state for both Cr absorbers, i.e. Cr3+ and Cr4+. Furthermore it was found that (69 ± 1)% of the Cr ions are in the trivalent state and the remaining (31 ± 1)% in the tetravalent state (the exact values of all fitting parameters are tabulated in Table 3 with their respective errors). The R factor of the fit was in this case well below 0.020. The resulting fit is shown in Fig. 4 and compared to the experimental LGO:Cr EXAFS spectrum.
| Cr3+ (%) | Cr4+ (%) | |
|---|---|---|
| ΔR(O21)/R(O21) | −4.03(11) | −4.41(26) |
| ΔR(O22)/R(O22) | 5.21(28) | −1.48(52) |
| ΔR(O23)/R(O23) | −1.35(19) | −2.94(47) |
| ΔR(Ga11)/R(Ga11) | 1.945(53) | −0.62(12) |
| ΔR(Ga21)/R(Ga21) | 0.01(4) | 3.57(10) |
| Oxygen | Gallium | |
|---|---|---|
| σ 2 | 0.00456(24) | 0.00103(21) |
All the spectra are similar within the error margins, so no direct indication for the presence of M(IV) ions in the direct neighbourhood (within 4.5 Å from the absorber) could be found for the codoped samples. There are two possible reasons for this phenomenon: (1) there is no incorporation of M(IV) in the direct neighbourhood of the Cr ions, or (2) the similar atomic scattering factors of Ge and Ga do not allow us to differentiate between them.
Besides the preferential substitution of the Cr ions on the octahedral sites, it is also observed that the Cr–O distance is smaller than the Ga–O distance. This effect can be caused by the shorter natural bond length for Cr–O bonds (e.g. in Cr2O3 and CrO2) compared to the Ga–O bond.
Electron paramagnetic resonance
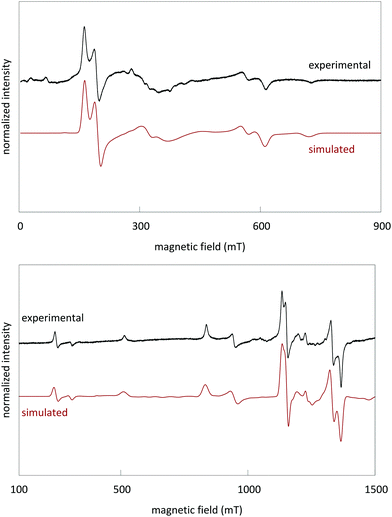
Powder EPR spectra were measured both at X-band (9.42 GHz) and Q-band (34.0 GHz) frequencies (Fig. 5). Spin Hamiltonian parameters for Cr3+ in LGO were extracted by simultaneous simulation of the X- and Q-band spectra with identical parameters, using Easyspin in Matlab.34The following effective spin Hamiltonian for the Cr3+ ion (S = 3/2, ground state 4A2), consisting of a Zeeman and a zero-field splitting (ZFS) term, was used:35,36
The simulated spectra and the values of the ZFS parameters point to Cr3+ being present at rhombically distorted octahedral sites. This is in accordance with the results from XAS. The values for g, D and E are determined as
| g = 1.98 ± 0.01 |
| D = 0.332 ± 0.005 cm−1 |
| E/D = 0.057 ± 0.009 |
D arises due to an axial deviation from cubic symmetry along the 〈111〉 direction of the unit cell. In regular spinel, only this axial component is present and will contribute to the EPR spectrum of Cr3+. However, in LGO, the partial occupation of octahedral lattice sites by Li+ ions in the second nearest neighbor cation shell causes a reduction of the trigonal D3d local symmetry (found in regular spinel) to the rhombic C2 symmetry. This is the origin of the small rhombic ZFS parameter E. The Cr3+ ground state is split into two Kramers doublets. The total ZFS between the Kramers doublets at B = 0 mT is 2(D2 + 3E2)1/2 = 0.665 cm−1.37
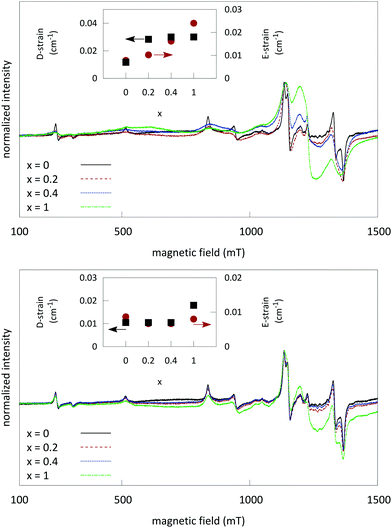
Fig. 6 shows an overlay of the EPR spectra of LGO:Ge,Cr and LGO:Si,Cr for varying values of x. The results show a variation in experimental EPR linewidth, depending on x. The linewidths can be modeled by strains on the ZFS parameters (shown in the insets of Fig. 6). These strains reflect slightly different surroundings of the Cr3+ ions, experiencing varying magnitudes in crystal field.
At x = 1 for LGO:Ge,Cr, a broad feature becomes prominent around 1200 mT, corresponding to an effective g-value of 1.99, which could be attributed to Cr clustering and interaction between Cr ions via dipole–dipole exchange coupling or Cr incorporation in GeO2 side phases.18,39,40 For the LGO:Si,Cr samples, the same feature around g = 1.99 becomes prominent, but the linewidths do not vary as much between the other samples, thus implying that introducing Si4+ does not lead to strong distortion of the Cr3+ sites.
Different LGO:Cr samples show a small distribution in the EPR linewidth. This reflects for instance slight variations in local Cr content or a different distribution of surrounding defects between samples.
Photoluminescence and afterglow
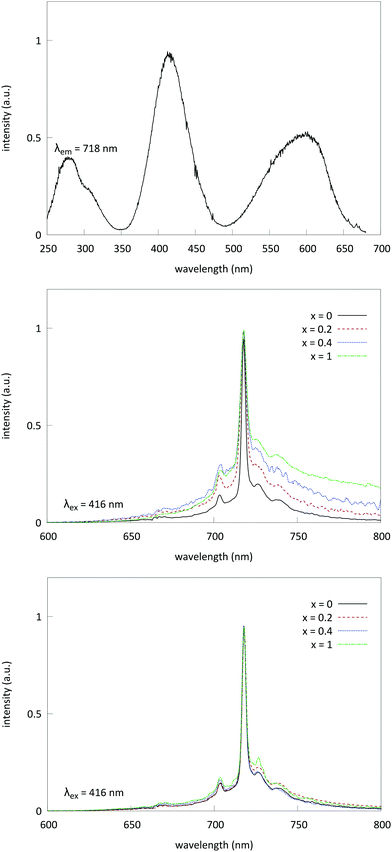
Fig. 7 shows the PL excitation and emission spectrum for Cr3+-doped LGO samples. The emission profile centers around a sharp line at 718 nm. This line corresponds to the zero-phonon emission of Cr3+ from the 2E level to the 4A2 ground state (known as the R transition41). The broad underlying feature from 650 nm to 750 nm corresponds to the 4T2 → 4A2 spin allowed transition. R1 phonon side bands (both Stokes and anti-Stokes) are situated on top of the broad emission band. Separation of the phonon side bands is of the order of 200–400 cm−1, which is well in the range of phonon frequencies of LGO, as reported by Keramidas et al.42As the Ge content is increased in the samples, the local disorder around the Cr3+ ions increases and consequently the R-line broadens and, proportionally, broad band emission from the 4T2 state increases in intensity. These results are in line with the EPR data that show significant broadening of the Cr3+ EPR signal, due to incorporation of Ge. In samples codoped with Si, there is no significant change in the emission profile of chromium, which is again in line with the results obtained from EPR.
Excitation bands arise at 280 nm, 410 nm (4A2 → 4T1 [4F2] transition) and 600 nm (4A2 → 4T2 transition), when monitoring the emission at 718 nm. The excitation band at 280 nm can be attributed to either the 4A2 → 4T1 [4P] transition or possibly charge-transfer from Cr3+ to a nearby oxygen. The optical bandgap of undoped LGO (derived from diffuse reflectance measurements, not shown) is about 4.9 eV. Low temperature measurements show no reduction of intensity of the excitation band in the UV, which indicates a higher contribution of d–d transitions compared to charge transfer.
No afterglow could be induced by excitation in the visible range. Only excitation in the lowest excitation band around 280 nm induces persistent luminescence in LGO.
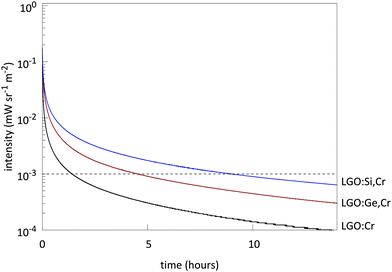
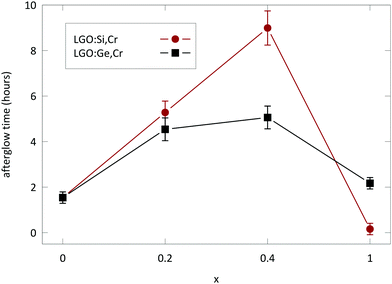
Measuring afterglow in radiometric units provides useful comparisons between persistent phosphors.2,4 Afterglow for LGO:Cr could be measured for over 1 h (Fig. 8), before the intensity drops below 10−3 mW sr−1 m−2. Afterglow is enhanced significantly by the addition of M(IV) to the host (Fig. 9). The optimal nominal x-value for the afterglow is x = 0.4 according to the formula LiGa5−xMxO8:Cr3+. If x exceeds the nominal x = 1 value, both PL and afterglow intensity decrease in comparison to the non-codoped samples.
Discussion
The results obtained from XAS, EPR and PL all point to Cr being incorporated in the octahedral sites of the LGO lattice. The afterglow intensity significantly increases due to codoping with Si and Ge, but only Ge seems to induce strong additional disorder around the Cr site.Seeing how the strains on the ZFS parameters D and E are intrinsically linked to disorder along the axial 〈111〉 direction (tetrahedral sites) and rhombic 〈110〉 direction (octahedral sites), respectively,37 the significant effect of Ge codoping on both the D-strain and E-strain of the Cr EPR signal could indicate that Ge is stochastically incorporated on both tetrahedral and octahedral sites.18 The small measured effect of Si, on the other hand, indicates that it is mainly incorporated on octahedral sites without much structural distortion. However, since Si codoping has the largest effect on the afterglow and M(IV) incorporation is limited, it seems that M(IV) incorporation indirectly induces additional host defects in the LGO lattice.
From XAS measurements, it is clear that Cr is present in both trivalent and tetravalent state. During the collection of the XAS spectra, no significant reduction of the Cr intensity or shift in absorption edge was found. This indicates that no valence changes of Cr are induced by the X-ray irradiation itself. Additional radioluminescence measurements, utilizing full spectrum Cu-anode X-ray excitation, also did not show any appreciable degradation of the Cr3+ intensity over the course of several hours (Fig. S10, ESI†). The presence of Cr4+ could not be verified via any of the other employed experimental techniques. Cr4+ has a spin state of S = 1; in low-symmetry environments, it is not evident to detect EPR signal for such a system. Optical transitions of Cr4+ were not detected by diffuse reflectance measurements (Fig. S9, ESI†).
Nonetheless, tetravalent chromium is clearly present in the LGO lattice. There is thus a charge mismatch between the Cr4+ species and the 3+ charge of the Ga sites, which means that chromium doping induces positive point defects at the doping sites, which need to be compensated by additional defects. In this way, Cr itself is partly responsible for the persistent behavior of the LGO phosphor. Codoping with M(IV), then, will only enhance the number of positive point defects and thus cause an increase of the persistent luminescence. Furthermore, tetravalent chromium can possibly act as an electron trap during the charging of the persistent phosphor.43,44
Additionally, concentration quenching and increase of Cr clusters with the concentration will impede the persistent behavior, whereas codoping with M(IV) ions only leads to the increase of traps and not to the reduction of PL properties.
Conclusions
We successfully prepared the NIR persistent phosphor LiGa5O8:Cr3+ and were able to improve the persistent behavior by codoping with M(IV) ions (M = Si, Ge), according to the formula LiGa5−xMxO8:Cr3+ (x = 0.2, 0.4 or 1). The afterglow profile is strongest for x = 0.4, for both Si and Ge. From SEM-EDX measurements it is clear that there is a discrepancy between nominal and actual M(IV) content. The improvement in persistent behavior is thus likely related to the occurrence of charge compensation effects during the synthesis.The local environment of Cr3+ was investigated via XAS and EPR. Both types of measurements agree that Cr3+ is found on rhombically distorted octahedral sites in the LGO lattice. The Cr EPR signal is significantly broadened by the inclusion of Ge4+, revealing the additional disorder around Cr due to codoping. The increased local disorder is also reflected in the broadening of the emission peaks in the PL spectra.
XAS measurements show that chromium is present in the host lattice in two valence states: III and IV. Tetravalent chromium will induce charge compensation point defects and possibly act as electron trap during the charging of the persistent phosphor.
Conflicts of interest
There are no conflicts to declare.Acknowledgements
O. Q. De Clercq and J. Kusakovskij gratefully acknowledge the financial support of the Ghent University's Special Research Fund (BOF). The authors would like to acknowledge Dipanjan Banerjee and the rest of the staff at DUBBLE for experimental support and useful discussions.References
- T. Matsuzawa, Y. Aoki, N. Takeuchi and Y. Murayama, J. Electrochem. Soc., 1996, 143, 2670–2673 CrossRef CAS.
- K. Van den Eeckhout, P. F. Smet and D. Poelman, Materials, 2010, 3, 2536–2566 CrossRef CAS.
- K. Van den Eeckhout, D. Poelman and P. F. Smet, Materials, 2013, 6, 2789–2818 CrossRef CAS PubMed.
- P. F. Smet, K. Van den Eeckhout, O. Q. De Clercq and D. Poelman, in Handbook on the Physics and Chemistry of Rare Earths, ed. B. Jean-Claude and K. P. Vitalij, Elsevier, 2015, vol. 48, pp. 1–108 Search PubMed.
- Q. le Masne de Chermont, C. Chaneac, J. Seguin, F. Pelle, S. Maitrejean, J. P. Jolivet, D. Gourier, M. Bessodes and D. Scherman, Proc. Natl. Acad. Sci. U. S. A., 2007, 104, 9266–9271 CrossRef CAS PubMed.
- J. Frangioni, Curr. Opin. Chem. Biol., 2003, 7, 626–634 CrossRef CAS PubMed.
- Y. Zhuang, Y. Katayama, J. Ueda and S. Tanabe, Adv. Opt. Mater., 2014, 36, 1907–1912 CrossRef CAS.
- B. Viana, S. K. Sharma, D. Gourier, T. Maldiney, E. Teston, D. Scherman and C. Richard, J. Lumin., 2016, 170, 879–887 CrossRef CAS.
- R. Wang and F. Zhang, J. Mater. Chem. B, 2014, 2, 2422 RSC.
- S. K. Singh, RSC Adv., 2014, 4, 58674–58698 RSC.
- K. Van den Eeckhout, P. F. Smet and D. Poelman, J. Lumin., 2009, 129, 1140–1143 CrossRef CAS.
- T. Maldiney, G. Sraiki, B. Viana, D. Gourier, C. Richard, D. Scherman, M. Bessodes, K. Van den Eeckhout, D. Poelman and P. F. Smet, Opt. Mater. Express, 2012, 2, 261–268 CrossRef CAS.
- A. Bessière, S. Jacquart, K. Priolkar, A. Lecointre, B. Viana and D. Gourier, Opt. Express, 2011, 19, 10131–10137 CrossRef PubMed.
- M. Allix, S. Chenu, E. Véron, T. Poumeyrol, E. A. Kouadri-Boudjelthia, S. Alahraché, F. Porcher, D. Massiot and F. Fayon, Chem. Mater., 2013, 25, 1600–1606 CrossRef CAS.
- Z. Pan, Y. Y. Lu and F. Liu, Nat. Mater., 2011, 11, 58–63 CrossRef PubMed.
- F. Shen, C. Deng, X. Wang and C. Zhang, Mater. Lett., 2016, 178, 185–189 CrossRef CAS.
- F. Shen, C. Deng, X. Wang, C. Zhang and W. Liu, J. Mater. Sci.: Mater. Electron., 2016, 27, 9067–9072 CrossRef CAS.
- D. Gourier, A. Bessière, S. K. Sharma, L. Binet, B. Viana, N. Basavaraju and K. R. Priolkar, J. Phys. Chem. Solids, 2014, 75, 826–837 CrossRef CAS.
- L. Binet, S. K. Sharma and D. Gourier, J. Phys.: Condens. Matter, 2016, 28, 385501 CrossRef PubMed.
- S. K. Sharma, A. Bessière, N. Basavaraju, K. R. Priolkar, L. Binet, B. Viana and D. Gourier, J. Lumin., 2014, 155, 251–256 CrossRef CAS.
- N. Basavaraju, K. R. Priolkar, A. Bessiere, S. K. Sharma, D. Gourier, L. Binet, B. Viana and S. Emura, Phys. Chem. Chem. Phys., 2017, 19, 1369–1377 RSC.
- F. Liu, W. Yan, Y. J. Chuang, Z. Zhen, J. Xie and Z. Pan, Sci. Rep., 2013, 3, 1554 CrossRef PubMed.
- X. Fu, C. Liu, J. Shi, H. Man, J. Xu and H. Zhang, Adv. Opt. Mater., 2014, 36, 1792–1797 CrossRef CAS.
- M. Borsboom, W. Bras, I. Cerjak, D. Detollenaere, D. Glastra van Loon, P. Goedtkindt, M. Konijnenburg, P. Lassing, Y. K. Levine, B. Munneke, M. Oversluizen, R. van Tol and E. Vlieg, J. Synchrotron Radiat., 1998, 5, 518–520 CrossRef CAS PubMed.
- W. Bras, S. Nikitenko, G. Portale, A. Beale, A. V. D. Eerden and D. Detollenaere, J. Phys.: Conf. Ser., 2010, 247, 012047 CrossRef.
- B. Ravel and M. Newville, J. Synchrotron Radiat., 2005, 12, 537–541 CrossRef CAS PubMed.
- R. Shannon, Acta Crystallogr., Sect. A: Cryst. Phys., Diffr., Theor. Gen. Crystallogr., 1976, 32, 751–767 CrossRef.
- B. H. O'Connor, D. Y. Li and B. A. Hunter, Adv. X-Ray Anal., 2001, 44, 96–102 Search PubMed.
- J. Ahman, G. Svensson and J. Albertsson, Acta Chem. Scand., 1996, 50, 391–394 CrossRef.
- K. E. Sickafus and J. M. Wills, J. Am. Ceram. Soc., 1999, 82, 3279–3292 CrossRef CAS.
- R. K. Datta, J. Am. Ceram. Soc., 1971, 54, 262 CrossRef CAS.
- V. Singh, R. V. S. S. N. Ravikumar, G. Sivaramaiah, J. L. Rao and S. H. Kim, Mater. Res. Bull., 2015, 61, 183–188 CrossRef CAS.
- F. M. F. de Groot, J. Electron Spectrosc. Relat. Phenom., 1994, 67, 529–622 CrossRef CAS.
- S. Stoll and A. Schweiger, J. Magn. Reson., 2006, 178, 42–55 CrossRef CAS PubMed.
- A. Abraham and B. Bleaney, Electron Paramagnetic Resonance of Transition Ions, Oxford University Press, 2 edn, 2012 Search PubMed.
- C. Rudowicz and S. K. Misra, Appl. Spectrosc. Rev., 2001, 36, 11–63 CrossRef CAS.
- T. J. Glynn, J. Chem. Phys., 1971, 55, 2925 CrossRef CAS.
- Y. Mei, C. Liu and W.-C. Zheng, Optik, 2017, 131, 183–187 CrossRef CAS.
- B. V. Padlyak and A. Gutsze, Appl. Magn. Reson., 1998, 14, 59–68 CrossRef CAS.
- R. J. Landry, J. T. Fournier and C. G. Young, J. Chem. Phys., 1967, 46, 1285–1290 CrossRef CAS.
- H. Szymczak, M. Warddzynska and I. E. Mylnikova, J. Phys. C: Solid State Phys., 1975, 8, 3937–3943 CrossRef CAS.
- V. G. Keramidas, B. A. Deangelis and W. B. White, J. Solid State Chem., 1975, 15, 233–245 CrossRef CAS.
- Y. Zhuang, J. Ueda and S. Tanabe, Appl. Phys. Express, 2013, 6, 052602 CrossRef.
- J. Xu, J. Ueda, Y. Zhuang, B. Viana and S. Tanabe, Appl. Phys. Express, 2015, 8, 042602 CrossRef.
Footnote |
| † Electronic supplementary information (ESI) available. See DOI: 10.1039/c7tc02699d |
| This journal is © The Royal Society of Chemistry 2017 |

