 Open Access Article
Creative Commons Attribution 3.0 Unported Licence
Nanoscale interfacial electroactivity in PVDF/PVDF-TrFE blended films with enhanced dielectric and ferroelectric properties†
Nan
Meng
,
Xiaojing
Zhu
,
Rui
Mao
,
Michael John
Reece
and
Emiliano
Bilotti
 *
*
School of Engineering and Materials Science, Queen Mary University of London, Mile End Road, E1 4NS, UK. E-mail: e.bilotti@qmul.ac.uk
First published on 28th February 2017
Abstract
The typical limitations of ferroelectric polymers like poly(vinylidene fluoride) (PVDF) – low crystallinity and indirect ferroelectric β-phase crystallization – and poly(vinylidene fluoride-trifluoroethylene) (PVDF-TrFE) – high materials and processing costs and a low Curie point – are tackled by a simple and industrially viable melt blending approach. Despite the immiscible nature of PVDF and PVDF-TrFE, strong interactions exist between the two polymers, which substantially affect the morphology and texture of the blends as well as their dielectric and ferroelectric properties. Surprisingly, minor amounts of PVDF-TrFE lead to a significant increase in the β-phase content and preferred orientation of PVDF, well beyond the rule-of-mixtures. Moreover, the blends exhibit maximum increases in the dielectric constant of 80% and 30%, respectively, compared with pure PVDF and PVDF-TrFE. The ferroelectric remnant polarization increases from 0.040 to 0.077 C m−2, while the coercive field decreases from 75 to 32 kV mm−1 with increasing PVDF-TrFE content from 0 to 40 wt%. The enhancement of properties is explained by the strong interactions at the interfaces between PVDF and PVDF-TrFE, which also suppress the Curie transition of PVDF-TrFE, providing a potentially increased working temperature range for blended films, which is important in applications like non-volatile energy storage devices, ferroelectric field-effect transistors and touch sensors.
Introduction
Polymer-based ferroelectric materials have low processing temperatures, high electrical resistivity and excellent flexibility compared to ceramic materials, which make them of interest for flexible electronic devices, such as memory devices and sensors.1–6 Poly(vinylidene fluoride) (PVDF) and its copolymers with trifluoroethylene (PVDF-TrFE) can be easily fabricated into films with good ferroelectric properties. Unlike ferroelectric ceramics, whose polar properties originate from ion displacement inside the crystal unit cell, the polar properties of ferroelectric polymers are due to the polar groups in the crystalline polymer structure. As a consequence of this, the coercive field of ferroelectric polymers is high (>50 kV mm−1).7PVDF, a semi-crystalline polymer, shows at least four polymorphs (α-, β-, γ- and δ-).7 The crystallization from the melt normally leads to the non-polar α-phase, which possesses a trans–gauche chain conformation resulting in the self-cancelation of the dipoles.7 The α-phase PVDF can be transformed into the γ-phase through thermal treatments8 and into the δ-phase through poling under a high electric field (∼150 kV mm−1).9,10 While the γ- and δ- phases are polar to some extent, the β-phase displays the best piezoelectric and ferroelectric properties. The polar direction of β-PVDF is along its b-axis, while the polymer chains are aligned with the c-axis.7 β-phase PVDF can be made by mechanically stretching the α-phase PVDF11 or poling α- and δ-PVDF under even higher electric fields (>500 kV mm−1).10
On the other hand, the copolymer PVDF-TrFE with a TrFE content in the range of 20–35 mol% easily crystallizes as the ferroelectric β-phase, independent of the processing routes or post-treatments.12 Moreover, the crystallinity of PVDF-TrFE is much higher compared with ∼50% for PVDF, and can reach 90% after annealing in the temperature range between the Curie and melting points.13 This is due to the increased chain mobility of PVDF-TrFE, leading to an increase in the lamella thickness. However, the large scale application of PVDF-TrFE is impeded by its time-consuming and expensive synthesis,12 along with a limited working temperature range due to the existence of Curie transition.
Blending is a common strategy to modify the properties of a base polymer by combining the desirable characteristics of different polymers. Miscibility is an important issue related to the evaluation of blends. PVDF blends with amorphous polymers containing a carbonyl group (e.g. polymethyl methacrylate PMMA) exhibit good miscibility in the whole composition range due to the contribution from the hydrogen bonding between the double-bonded oxygen of the carbonyl group and the acidic hydrogen of the CH2–CF2 group.14–16 However, the crystallization of PVDF and its spontaneous polarization are suppressed with the addition of amorphous polymers.15,17 As a result, in order to maintain or even enhance its ferroelectric properties, blending with fluorine polymers is more likely to be effective.18
Tanaka et al.19 investigated the miscibility of PVDF/PVDF-TrFE blends. Based on the observation of two distinct fusion peaks in the DSC heating run, PVDF was found to be immiscible with PVDF-TrFE regardless of the composition of the copolymer. Gregorio et al.20 came to the same conclusion, but they suggested that PVDF and PVDF-TrFE displayed miscibility on the lamellae level due to the fact that pure PVDF showed axial morphology, while the blends displayed a homogenously distributed irregular texture, suggesting that PVDF-TrFE molecules segregated to the regions between the PVDF spherulites. However, they did not report the electric properties of their blended films. Despite the immiscibility of the polymers, there is evidence of strong interaction in PVDF/PVDF-TrFE blends, which might have a significant effect on the dielectric and ferroelectric properties of the blends.
In this work, PVDF was blended with PVDF-TrFE using melt extrusion, which, to the best of our knowledge, has never been reported before. On the basis of our previous study,21 melt extruded PVDF-TrFE films exhibited remarkable ferroelectric properties due to high crystallinity and highly preferred crystalline orientation. It is proposed that the presence of PVDF-TrFE could enhance the crystallization of PVDF into the β-phase and generate the preferred orientation of its polymer chains.
Experimental
Materials
PVDF was purchased from Sigma Aldrich Chemical Co. The average molecular weight of PVDF was about 180 kg mol−1 (Mw) and 71 kg mol−1 (Mn). PVDF-TrFE of composition 77/23 mol% was purchased from Piezotech S.A.S. (France). The average molecular weight of PVDF-TrFE was 210 kg mol−1 (Mw) and 100 kg mol−1 (Mn).22Sample preparation
PVDF and PVDF-TrFE were melt-blended using a DSM X'plore 15 Mini-extruder (Xplore Instruments, Geleen, The Netherlands) at 205 °C and 60 rpm for 10 min. The weight ratios of PVDF/PVDF-TrFE were set to 100/0, 90/10, 80/20, 70/30, 60/40 and 0/100. A slit die with a gauge of 200 μm was used to produce films. The films were collected by a roller at 180 mm min−1 and ambient temperature. The films were then clamped and annealed at 100 °C for 2 hours. The thickness of the films was about 20 μm. For electrical measurements, gold was vacuum sputtered on both sides of the films to form electrodes.Instrumentation
Fourier transform infrared spectroscopy (FTIR) (Tensor 27, Bruker Optik GmbH, Ettlingen, Germany) was used to characterize the crystalline phases. Five specimens were characterized for every composition of the film. To complement the FTIR data, the crystalline phases were also determined using one-dimensional wide-angle X-ray diffraction (1D-WAXD) patterns which were obtained using a Bragg–Brentano geometry X-ray diffractometer (X’Pert Pro, PANalytical, Almelo, The Netherlands) with Cu/Kα radiation in the 2θ range of 5°–70°. The preferred orientation of the films was determined using two-dimensional wide-angle X-ray diffraction (2D-WAXD) ring patterns, which were obtained using a transmission geometry X-ray diffractometer (Kappa ApexII Duo, Bruker AXS GmbH, Karlsruhe, Germany). The surface morphology of the films was studied using a scanning electron microscope (SEM) (FEI Inspect-F, Hillsboro, OR, USA). Before gold coating, samples were etched in potassium permanganate solution for 40 min at 50 °C to remove the amorphous region. The thermal properties of the materials were analyzed using a differential scanning calorimeter (DSC) (DSC822e, Mettler-Toledo, OH, USA) under a N2 atmosphere. All of the samples were initially heated up to 180 °C and kept at this temperature for 5 min, then cooled down to 25 °C and heated up again to 180 °C. Both the heating and cooling rates were set to 5 °C min−1. Isothermal crystallization was carried out at 150 °C and 135 °C. The frequency dependence of dielectric permittivity and dielectric loss tangent was measured using a Precision Impedance Analyzer (4294A, Agilent, Santa Clara, CA) at ambient temperature in the frequency range of 100 Hz to 100 MHz at an applied maximum voltage of 0.5 V. The temperature dependence of dielectric permittivity and dielectric loss tangent was measured at different frequencies using a LCR meter (4284A, Agilent, Santa Clara, CA) which is connected to a homemade furnace. The electrode diameter for the dielectric tests was 5 mm. The ferroelectric P–E hysteresis loops were tested using a ferroelectric hysteresis measurement tester (NPL, Teddington, UK) at ambient temperature and 10 Hz. The electrode diameter for ferroelectric tests was 2 mm. Both the dielectric and ferroelectric data presented in this paper were based on the testing of 8 different specimens.Results and discussion
Crystalline phases and the preferred orientation of PVDF/PVDF-TrFE blended films
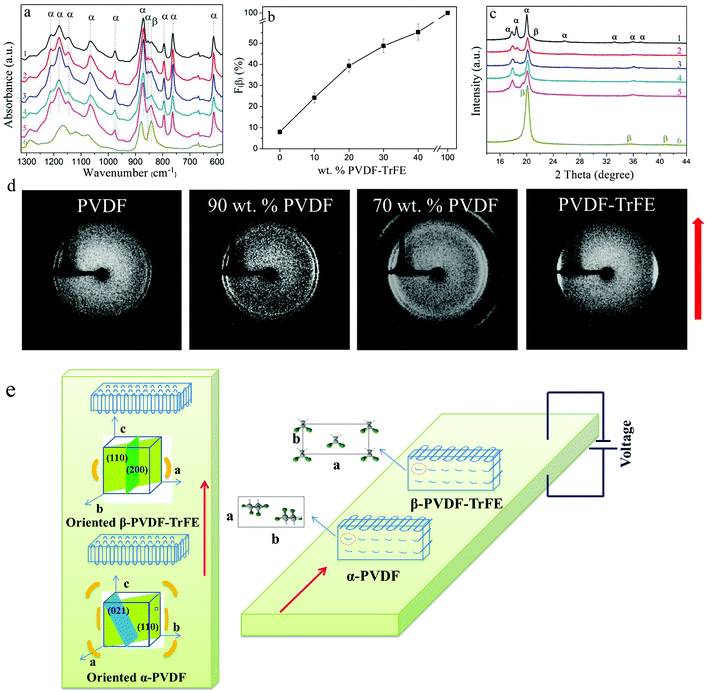
The FTIR spectra of the blended films are shown in Fig. 1a. For pure PVDF, the strong α-phase characteristic bands at 1211, 1179, 1145, 1066, 976, 871, 854, 795, 764 and 613 cm−1 can be seen in line (1). FTIR cannot clearly distinguish the β-phase from the γ-phase since several of their characteristic bands overlap.23,24 For example, the typical 840 cm−1 β-phase band could also be a superposition of bands for the β- and γ-phases.24,25 However, the exclusive γ-phase bands at 1234, 1117, 833 and 812 cm−1 are not apparent in line (1),26 which means that only the β-phase contributed to the formation of the band at 840 cm−1. To sum up, pure PVDF films mainly crystallized into the α-phase with a small amount of the β-phase (∼8 wt% as shown in Fig. 1b).For pure PVDF-TrFE, strong characteristic β-phase bands at 1167, 878 and 840 cm−1 can be seen in Fig. 1a line (6). The blended films show a mixture of α- and β-phases. The intensity of the 854 cm−1 band (α-phase) was considerably reduced with increasing amount of PVDF-TrFE, while the 840 cm−1 band (β-phase) became more obvious. Eqn (1) was used to quantify the relative fraction of the β-phase (F(β)), assuming that only the α- and β-phases existed.27,28Eqn (1) is built on the assumption that FTIR follows the Lambert–Beer law.27 In Eqn (1), Aα and Aβ correspond to the measured absorbance at 764 cm−1 and 840 cm−1, and Kα and Kβ are the absorbance coefficients at 764 cm−1 and 840 cm−1, the values of which are 6.1 × 10⁴ and 7.7 × 104 cm2 mol−1, respectively.27 The values of F(β) for the blended films are shown in Fig. 1b; the values of F(β) of PVDF and PVDF-TrFE are also included. The F(β) value increases to almost 40 wt% for PVDF/PVDF-TrFE 80/20 wt% blended films, which shows that the introduction of PVDF-TrFE promotes the crystallization of PVDF into the β-phase.
 | (1) |
Similar to PVDF, the blended films showed three XRD peaks. The intensity of the characteristic (020) α-PVDF peak at about 18.5° significantly reduced with the PVDF-TrFE content, especially for the blended films containing more than 20 wt% PVDF-TrFE. The weakening of this peak indicates that the amount of α-phase was reduced and/or the preferred orientation of the crystallites increased with the presence of PVDF-TrFE. Combined with the FTIR data, it can be confirmed that there was a reduction in the α-phase and a corresponding increase in the β-phase PVDF.
The preferred orientation results of the PVDF and PVDF-TrFE films obtained from 2D-WAXD analysis are shown in Fig. 1d. From inner to outer, the WAXD reflections of the PVDF, calculated from Fig. 1d, are 18.1°, 20.0° and 26.6°. The ring at 18.1° consists of the overlapping 17.81° (100)α and 18.48° (020)α reflections. The reflection at 26.6°, though not obvious in Fig. 1c, is associated with the (021)α plane, which is characteristic of the α-phase. As clearly seen in Fig. 1d, the crystalline phase of PVDF-TrFE is well oriented, with the (110)β/(200)β reflections concentrated towards the equatorial region, indicating that the polymer chain axis (c-axis) is oriented parallel to the extrusion direction.21 In comparison, the reflections of PVDF are more uniformly distributed, implying a low preferred orientation. The orientation difference can be explained by the fact that PVDF-TrFE exhibits a longer relaxation time in the melt state than that of PVDF, and therefore showed a more pronounced crystal orientation during flow extension.35
The 2D-WAXD patterns of the blended films are shown in Fig. 1d. From inner to outer, the WAXD profiles exhibit the characteristic reflections of (100)α/(020)α, (110)α+β/(200)β and (021)α planes at 18.36°, 20.33° and 26.6° respectively. With increasing amount of PVDF-TrFE, the preferred orientation of the (110)α+β/(200)β and (021)α reflections is enhanced. The intensity as a function of the azimuthal angle from −90° to +90° at the radial position of the (110)α+β/(200)β and (100)α/(020)α peaks for the pure PVDF, PVDF-TrFE and blended films was fitted with a Gaussian function (Fig. S1, ESI†). Pure PVDF films show the least preferred orientation, corresponding to the broadest peak (Fig. S1, ESI†). For the blended films (Fig. S1, ESI†) the intensity is enhanced and the peak becomes sharper radially and azimuthally with increasing amount of PVDF-TrFE, which shows that blending with PVDF-TrFE leads to increased crystallinity and higher preferred orientation for the PVDF/PVDF-TrFE blended films. Interestingly, the outermost 26.6° (021)α reflection ring of the blended films shows a preferred orientation, about 45° from the equatorial direction, which enhanced with increasing amount of PVDF-TrFE (Fig. 1d). During extrusion, the temperature dropped quickly from 205 °C to room temperature, which caused the PVDF and PVDF-TrFE to crystallize simultaneously. The existence of a strong interaction between the two different polymers caused the chains of the PVDF to orientate in the same direction as the PVDF-TrFE. Fig. 1e depicts the orientation of the crystallites of the blended films formed during the extrusion process.
Miscibility and crystallization behavior of PVDF/PVDF-TrFE blended films
![[thin space (1/6-em)]](https://www.rsc.org/images/entities/char_2009.gif) 40).
40).
| PVDF/PVDF-TrFE | Enthalpy values of first heating (J g−1) | Enthalpy values of second heating (J g−1) | ||||
|---|---|---|---|---|---|---|
ΔHc![[thin space (1/6-em)]](https://www.rsc.org/images/entities/char_2009.gif) PVDF-TrFEa PVDF-TrFEa |
ΔHf![[thin space (1/6-em)]](https://www.rsc.org/images/entities/char_2009.gif) PVDF-TrFE PVDF-TrFE |
ΔHf![[thin space (1/6-em)]](https://www.rsc.org/images/entities/char_2009.gif) PVDF PVDF |
ΔHc![[thin space (1/6-em)]](https://www.rsc.org/images/entities/char_2009.gif) PVDF-TrFE PVDF-TrFE |
ΔHf![[thin space (1/6-em)]](https://www.rsc.org/images/entities/char_2009.gif) PVDF-TrFE PVDF-TrFE |
ΔHf![[thin space (1/6-em)]](https://www.rsc.org/images/entities/char_2009.gif) PVDF PVDF |
|
a ΔHc![[thin space (1/6-em)]](https://www.rsc.org/images/entities/char_2009.gif) PVDF-TrFE: enthalpy of Curie transition of PVDF-TrFE; ΔHf PVDF-TrFE: enthalpy of Curie transition of PVDF-TrFE; ΔHf![[thin space (1/6-em)]](https://www.rsc.org/images/entities/char_2009.gif) PVDF-TrFE and ΔHf PVDF-TrFE and ΔHf![[thin space (1/6-em)]](https://www.rsc.org/images/entities/char_2009.gif) PVDF: fusion enthalpy of PVDF-TrFE and PVDF, respectively. PVDF: fusion enthalpy of PVDF-TrFE and PVDF, respectively.
|
||||||
| 100/0 | — | — | 46.3 ± 3 | — | — | 43.1 ± 2 |
| 90/10 | — | 7.0 ± 1 | 38.0 ± 2 | 9.2 ± 1 | 13.1 ± 1 | 31.1 ± 1 |
| 80/20 | — | 6.6 ± 1 | 36.4 ± 3 | 9.0 ± 1 | 13.6 ± 1 | 32.7 ± 1 |
| 70/30 | — | 17.1 ± 2 | 33.0 ± 3 | 7.8 ± 1 | 19.6 ± 1 | 32.0 ± 1 |
| 60/40 | — | 15.6 ± 1 | 32.5 ± 2 | 12.2 ± 2 | 21.0 ± 1 | 31.9 ± 1 |
| 0/100 | 28.7 ± 2 | 29.0 ± 3 | — | 26.4 ± 3 | 28.8 ± 2 | — |
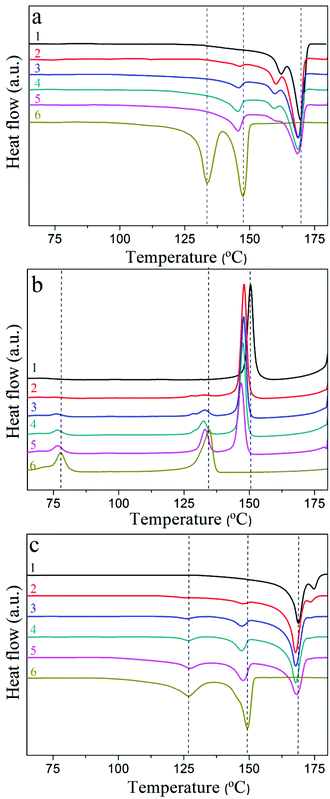
Apart from its fusion peak at 147.2 ± 0.2 °C, pure PVDF-TrFE shows another peak at 133.8 ± 0.1 °C originating from the ferroelectric to paraelectric phase transition (Curie transition). The ΔHf of PVDF-TrFE is 29.0 J g−1, suggesting a crystallinity of 76% (ΔHf for 100% crystalline PVDF-TrFE is about 38 J g−1![[thin space (1/6-em)]](https://www.rsc.org/images/entities/char_2009.gif) 41). The blended films exhibit three peaks on first heating, corresponding to the fusion peaks of PVDF-TrFE and PVDF, which proves the immiscibility of the two polymers. Interestingly, the Curie transition peak of PVDF-TrFE is diffuse and is apparent only as a shoulder on the lower temperature side of the fusion peak of PVDF-TrFE.
41). The blended films exhibit three peaks on first heating, corresponding to the fusion peaks of PVDF-TrFE and PVDF, which proves the immiscibility of the two polymers. Interestingly, the Curie transition peak of PVDF-TrFE is diffuse and is apparent only as a shoulder on the lower temperature side of the fusion peak of PVDF-TrFE.
Fig. 3b shows the cooling DSC curves on cooling after first heating. Pure PVDF has one crystallization peak at 150.6 ± 0.5 °C, and pure PVDF-TrFE shows two peaks at 134.6 ± 0.8 °C and 77.8 ± 0.5 °C, resulting from the crystallization and the paraelectric to ferroelectric phase transition, respectively. All blended films exhibit three peaks. The crystallization temperatures of PVDF and PVDF-TrFE and the Curie transition in the blended films are slightly lower than those of the pure components.
Fig. 3c shows the second heating DSC curves of PVDF, PVDF-TrFE and their blends. During the second heating pure PVDF has two fusion peaks at 168.9 ± 0.3 °C and 174.8 ± 0.2 °C, indicating a mixture of α- and γ-phases.23 Further evidence for the presence of the γ-phase can be found in the FTIR data presented in Fig. S2 (ESI†). With regard to pure PVDF-TrFE, the peak value of the Curie transition shifts to a lower temperature (127 ± 0.1 °C) when compared to the first heating (133.8 ± 0.1 °C). The higher Curie point in the first heating indicates that the pure PVDF-TrFE crystallized into highly oriented ferroelectric crystals through the extrusion method.42 For the blended films, the Curie transition peak was diffuse in the first heating curves, however, a small, but clear, peak can be seen in the second heating curves. It is shown in Table 1 that ΔHf![[thin space (1/6-em)]](https://www.rsc.org/images/entities/char_2009.gif) PVDF of pure PVDF and blended samples during first heating are larger than those of second heating, while being lower for ΔHf
PVDF of pure PVDF and blended samples during first heating are larger than those of second heating, while being lower for ΔHf![[thin space (1/6-em)]](https://www.rsc.org/images/entities/char_2009.gif) PVDF-TrFE, which indicates the existence of interactions between PVDF and PVDF-TrFE in the extruded blended films. PVDF crystallized first and served as a nucleating agent in the crystallization of PVDF-TrFE. The formed crystallites exhibited similar structures and were intimately correlated. The Curie transition is achieved by the formation of gauche bonds, which requires the polymer chains in PVDF-TrFE to undergo severe twisting and/or tilting,42 which needs adequate space to accomplish this. However, the surrounding PVDF crystals and the intimate coexistence of the two components restricts the space to accomplish the transition. However, PVDF and PVDF-TrFE crystallized more freely during the DSC slow cooling process (cooling rate 5 °C min−1), which resulted in more phase separation and less interactions, making the Curie transition peaks more obvious than those of the extruded blended films in the first DSC heating curves.
PVDF-TrFE, which indicates the existence of interactions between PVDF and PVDF-TrFE in the extruded blended films. PVDF crystallized first and served as a nucleating agent in the crystallization of PVDF-TrFE. The formed crystallites exhibited similar structures and were intimately correlated. The Curie transition is achieved by the formation of gauche bonds, which requires the polymer chains in PVDF-TrFE to undergo severe twisting and/or tilting,42 which needs adequate space to accomplish this. However, the surrounding PVDF crystals and the intimate coexistence of the two components restricts the space to accomplish the transition. However, PVDF and PVDF-TrFE crystallized more freely during the DSC slow cooling process (cooling rate 5 °C min−1), which resulted in more phase separation and less interactions, making the Curie transition peaks more obvious than those of the extruded blended films in the first DSC heating curves.
The above results, correlated with both crystallization and morphological studies, strongly demonstrate the intimate interactions between the PVDF and PVDF-TrFE. More detailed investigations of isothermal crystallization at 150 °C (PVDF crystallization temperature) and 135 °C (PVDF-TrFE crystallization temperature) were undertaken.
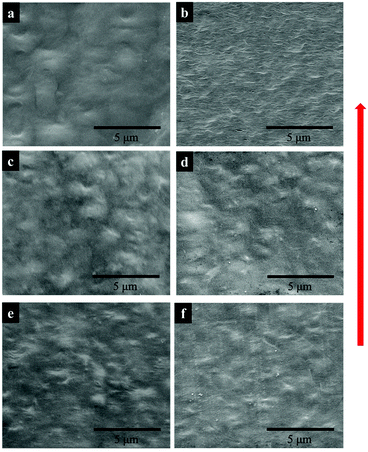
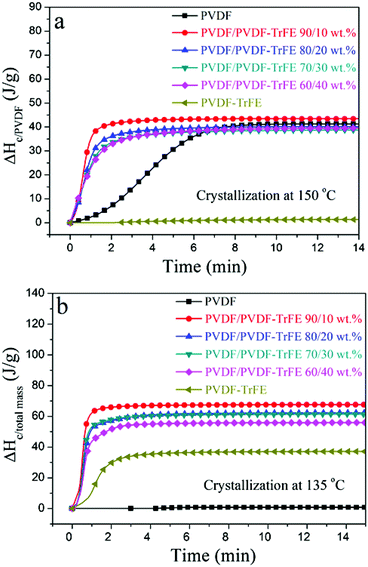
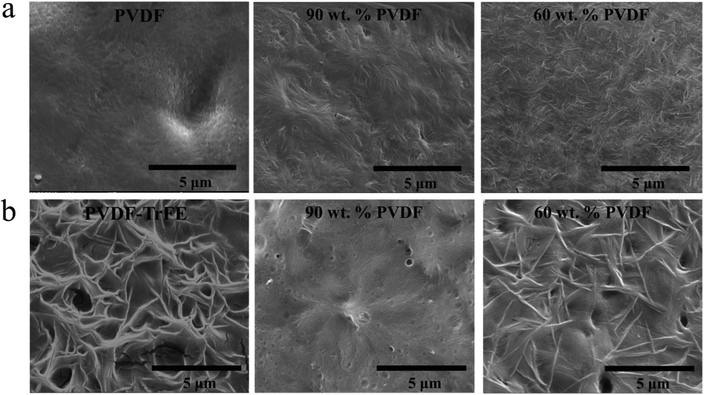
The DSC data recorded during isothermal crystallization at 150 °C are shown in Fig. 4a and Fig. S3 (ESI†), and the morphology of the films is shown in Fig. 5a. No crystallization of PVDF-TrFE occurred at 150 °C (Fig. S3, ESI†). It is evident that the rate of crystallization of PVDF at 150 °C was increased by the addition of PVDF-TrFE (in the melt state). This is different to what is reported for PVDF/poly(1,4-butylene adipate) (PBA) blends where the crystallization rate of PVDF was reduced due to the presence of PBA.43 To understand these differences, it is necessary to consider the morphologies of the microstructures. In the PVDF/PBA system, PVDF crystallized into progressively larger spherulites with increasing PBA content, however, in our PVDF/PVDF-TrFE blends the growth of PVDF spherulites was restricted. The isothermally crystallized PVDF showed fine spherulites. The spherulites that formed in the blended samples were smaller and less perfect compared to those in PVDF (Fig. 5a), which is consistent with the morphology of extruded films. On the basis that there was no crystallization of PVDF-TrFE at 150 °C because the temperature was above its melting point, the crystallization enthalpy of the blends was normalized in terms of the PVDF content (ΔHc/PVDF). Fig. 4a shows that the normalized values of ΔHc/PVDF for both pure PVDF and the blends are similar regardless of the weight ratio, indicative of almost no hindrance to the degree of crystallinity of PVDF due to the introduction of PVDF-TrFE.
The non-normalized raw DSC data for samples isothermally crystallized at 135 °C are shown in Fig. 4b and Fig. S3 (ESI†). Pure PVDF-TrFE exhibited a maximum ΔHc of approximately 37 J g−1, which represents almost complete crystallization with a reported enthalpy of 100% crystalline PVDF-TrFE (∼38 J g−1).41 During the isothermal crystallization at 135 °C, PVDF continued to crystallize as demonstrated by the large enthalpies of the blends. On the other hand, the rate of crystallization at 135 °C of PVDF-TrFE was increased in the blends compared to the pure copolymer. This can be explained by the PVDF crystallites acting as nucleation sites for the crystallization of PVDF-TrFE. Fig. 5b shows the morphology of samples that isothermally crystallized at 135 °C, with needle-like PVDF-TrFE crystals embedded in the matrix of PVDF, which did not crystallize into a spherulitic structure. To conclude, the DSC data (Fig. 3, 4 and Table 1) and the microstructural analysis (Fig. 2 and 5) clearly show that synergistic effects occurred at the nanoscale in the blended materials at the interface between the two immiscible polymers that strongly affected the kinetics of crystallization and the microstructures that formed.
Electric properties of PVDF/PVDF-TrFE blended films
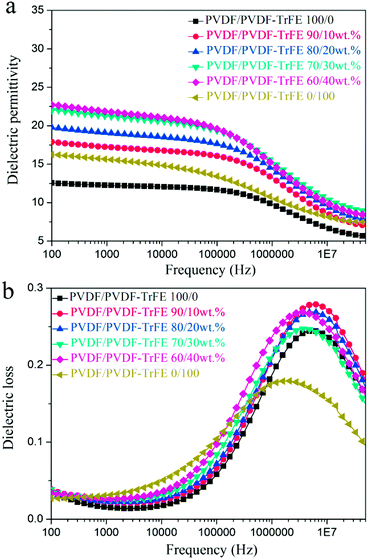 | ||
| Fig. 6 Frequency dependence of (a) dielectric permittivity and (b) dielectric loss for pure PVDF, PVDF-TrFE and blended films as a function of frequency. | ||
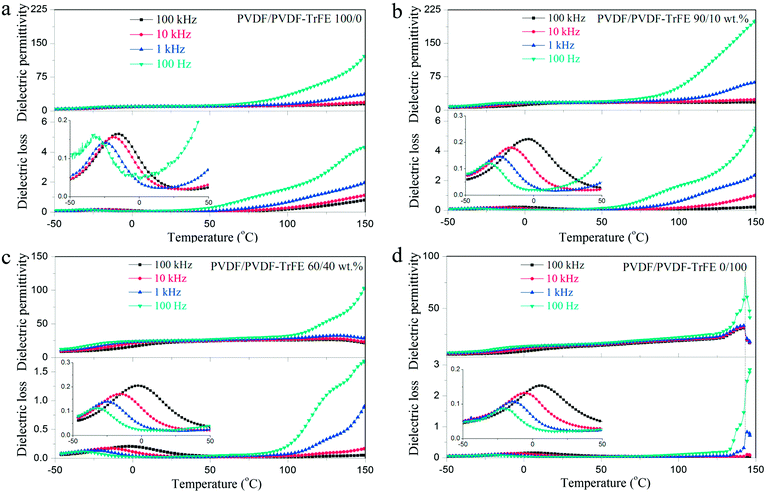
Fig. 7 shows the temperature dependent dielectric spectra of pure PVDF, PVDF-TrFE and their blends. All of the samples exhibit a dielectric loss peak at about 0 °C, which is ascribed to the relaxation of the polymer chains in the amorphous regions (glass transition).5 The dielectric permittivity of PVDF-TrFE shows an obvious peak at about 140 °C, and the peak position is frequency invariant, which suggests the existence of a Curie transition.45 The blended films with 40 wt% PVDF-TrFE show an inflexion in the permitivity and loss data consistent with a Curie transition (Fig. 7c).
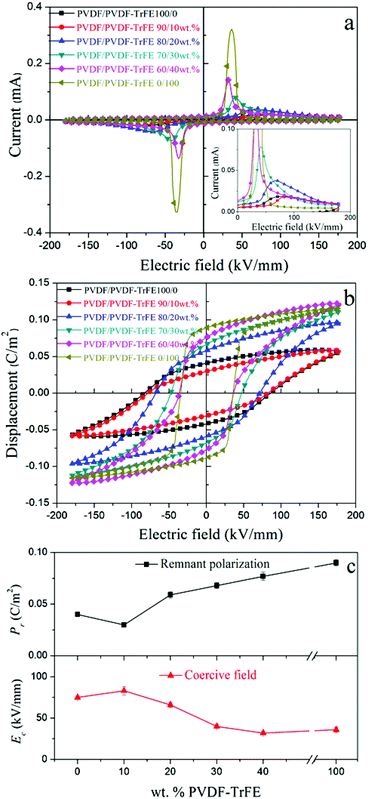
With regard to the blended films, the coercive field decreased from 83 kV mm−1 to 32 kV mm−1 with increasing amount of PVDF-TrFE from 10 wt% to 40 wt% as a result of blending. The remnant polarization of the PVDF is apparently higher compared with 10 wt% PVDF-TrFE due to a leakage current in pure PVDF, making the remnant polarization of PVDF unrealistically high (inset in Fig. 8a). The leakage current could be ascribed to the gaps or voids formed between large PVDF spherulites.46 The introduction of PVDF-TrFE enhanced the remnant polarization for the blended films from 0.030 to 0.077 C m−2 with increasing the amounts of PVDF-TrFE from 10 to 40 wt% (Fig. 8c). On the basis of the data from the structural characterization, the addition of PVDF-TrFE enhanced the crystallization of the ferroelectric β-phase in the blended films, but this alone would not explain the enhanced ferroelectric properties of the blended films.
The theoretical value of the remnant polarization of the blended film with 40 wt% copolymer based on the simple mixing rule was calculated using the following equation: Prblends = φPVDF × PrPVDF + φPVDF-TrFE × PrPVDF-TrFE, where φ and Pr are the volume fraction and the measured remnant polarization of pure PVDF and PVDF-TrFE extruded samples. The calculated value for the blended film with 40 wt% copolymer is only 0.058 C m−2, about 25% lower than the experimental value. Similar conditions existed in the 20 wt% and 30 wt% blends, where the calculated values were about 20% less compared with the experimental values. Combined with the diffuse Curie transition and larger dielectric constants observed for the blended films, the interaction between the two polymers and the interfaces between them could explain the enhanced ferroelectric properties of the blended films. The interfacial polarization contributed to the higher remnant polarization, and more contributions were generated at high electric fields, as indicated by the large saturated polarization of the blend with 40 wt% PVDF-TrFE.
Conclusions
Despite the immiscibility of PVDF and PVDF-TrFE, as demonstrated by the DSC results, they intimately crystallize on a fine scale (∼40 nm) without the appearance of distinct phase separation. The rate of crystallization of PVDF and PVDF-TrFE increased as a result of blending, as suggested by isothermal crystallization studies. With increasing amount of PVDF-TrFE, the blended films had more β-phase and increased preferred orientation, more than would be expected based on a simple rule of mixtures. Due to interfacial polarization, PVDF/PVDF-TrFE blended films had a larger dielectric constant than the two pure components. Furthermore, the ferroelectric properties of the blended films were enhanced more than would be expected based on a simple rule of mixtures. The switching field decreased (from 75 to 32 kV mm−1), while the remnant polarization increased (from 0.040 to 0.077 C m−2) with increasing amount of PVDF-TrFE from 0 to 40 wt%. The Curie transition was suppressed in the blended films, which may lead to increased high temperature stability for piezoelectric applications.Acknowledgements
We appreciate the valuable discussion with Prof Cees Bastiaansen and Prof Ton Peijs. Nan Meng was financially supported by the China Scholarship Council (CSC). Prof Mike Reece would also like to acknowledge the support of The Engineering and Physical Sciences Research Council (EP/L017695/1, MASSIVE).Notes and references
- Y. Yuan, T. J. Reece, P. Sharma, S. Poddar, S. Ducharme, A. Gruverman, Y. Yang and J. Huang, Nat. Mater., 2011, 10, 296–302 CrossRef CAS PubMed.
- M. Li, I. Katsouras, C. Piliego, G. Glasser, I. Lieberwirth, P. W. M. Blom and D. M. de Leeuw, J. Mater. Chem. C, 2013, 1, 7695–7702 RSC.
- B. Li, C. Xu, F. Zhang, J. Zheng and C. Xu, J. Mater. Chem. C, 2015, 3, 8926–8931 RSC.
- A. V. Shirinov and W. K. Schomburg, Sens. Actuators, A, 2008, 142, 48–55 CrossRef CAS.
- L. Zhu, J. Phys. Chem. Lett., 2014, 5, 3677–3687 CrossRef CAS PubMed.
- Q. Li and Q. Wang, Macromol. Chem. Phys., 2016, 217, 1228–1244 CrossRef CAS.
- A. J. Lovinger, Science, 1983, 220, 1115–1121 CAS.
- W. M. Prest and D. J. Luca, J. Appl. Phys., 1978, 49, 5042–5047 CrossRef CAS.
- N. C. Banik, P. L. Taylor and A. J. Hopfinger, Appl. Phys. Lett., 1980, 37, 49–50 CrossRef CAS.
- G. T. Davis, J. E. McKinney, M. G. Broadhurst and S. C. Roth, J. Appl. Phys., 1978, 49, 4998–5002 CrossRef CAS.
- K. Matsushige, K. Nagata, S. Imada and T. Takemura, Polymer, 1980, 21, 1391–1397 CrossRef CAS.
- T. Furukawa, Adv. Colloid Interface Sci., 1997, 71–72, 183–208 CrossRef CAS.
- O. Hiroji, A. Shuyo and K. Keiko, Jpn. J. Appl. Phys., 1988, 27, 2144 CrossRef.
- N. Tsutsumi, Y. Ueda, T. Kiyotsukuri, A. S. DeReggi and G. T. Davis, J. Appl. Phys., 1993, 74, 3366–3372 CrossRef CAS.
- Q. Meng, W. Li, Y. Zheng and Z. Zhang, J. Appl. Polym. Sci., 2010, 116, 2674–2684 CAS.
- Y. Tang and J. Scheinbeim, J. Polym. Sci., Part B: Polym. Phys., 2003, 41, 927–935 CrossRef CAS.
- M. Li, N. Stingelin, J. J. Michels, M.-J. Spijkman, K. Asadi, K. Feldman, P. W. M. Blom and D. M. de Leeuw, Macromolecules, 2012, 45, 7477–7485 CrossRef CAS.
- X. Zhang, Y. Shen, Z. Shen, J. Jiang, L. Chen and C.-W. Nan, ACS Appl. Mater. Interfaces, 2016, 8, 27236–27242 CAS.
- H. Tanaka, A. J. Lovinger and D. D. Davis, J. Polym. Sci., Part B: Polym. Phys., 1990, 28, 2183–2198 CrossRef CAS.
- R. Gregorio, M. R. Chaud, W. Nunes Dos Santos and J. B. Baldo, J. Appl. Polym. Sci., 2002, 85, 1362–1369 CrossRef CAS.
- N. Meng, R. Mao, W. Tu, X. Zhu, R. M. Wilson, E. Bilotti and M. J. Reece, Polymer, 2016, 100, 69–76 CrossRef CAS.
- N. Shingne, M. Geuss, B. Hartmann-Azanza, M. Steinhart and T. Thurn-Albrecht, Polymer, 2013, 54, 2737–2744 CrossRef CAS.
- R. Gregorio, J. Appl. Polym. Sci., 2006, 100, 3272–3279 CrossRef CAS.
- M. Li, H. J. Wondergem, M.-J. Spijkman, K. Asadi, I. Katsouras, P. W. M. Blom and D. M. de Leeuw, Nat. Mater., 2013, 12, 433–438 CrossRef CAS PubMed.
- R. Gregorio and R. C. CapitãO, J. Mater. Sci., 2000, 35, 299–306 CrossRef CAS.
- J. H. Park, N. Kurra, M. N. AlMadhoun, I. N. Odeh and H. N. Alshareef, J. Mater. Chem. C, 2015, 3, 2366–2370 RSC.
- J. R. Gregorio and M. Cestari, J. Polym. Sci., Part B: Polym. Phys., 1994, 32, 859–870 CrossRef.
- M. P. Silva, V. Sencadas, G. Botelho, A. V. Machado, A. G. Rolo, J. G. Rocha and S. Lanceros-Mendez, Mater. Chem. Phys., 2010, 122, 87–92 CrossRef CAS.
- M. Sharma, G. Madras and S. Bose, Phys. Chem. Chem. Phys., 2014, 16, 14792–14799 RSC.
- Y. Takahashi and H. Tadokoro, Macromolecules, 1980, 13, 1317–1318 CrossRef CAS.
- J. Buckley, P. Cebe, D. Cherdack, J. Crawford, B. S. Ince, M. Jenkins, J. Pan, M. Reveley, N. Washington and N. Wolchover, Polymer, 2006, 47, 2411–2422 CrossRef CAS.
- D. M. Esterly and B. J. Love, J. Polym. Sci., Part B: Polym. Phys., 2004, 42, 91–97 CrossRef CAS.
- J. L. Lutkenhaus, K. McEnnis, A. Serghei and T. P. Russell, Macromolecules, 2010, 43, 3844–3850 CrossRef CAS.
- F. Oliveira, Y. Leterrier, J.-A. Månson, O. Sereda, A. Neels, A. Dommann and D. Damjanovic, J. Polym. Sci., Part B: Polym. Phys., 2014, 52, 496–506 CrossRef CAS.
- P. K. Agarwal, R. H. Somani, W. Weng, A. Mehta, L. Yang, S. Ran, L. Liu and B. S. Hsiao, Macromolecules, 2003, 36, 5226–5235 CrossRef CAS.
- C. M. Costa, M. N. T. Machiavello, J. L. G. Ribelles and S. Lanceros-Méndez, J. Mater. Sci., 2013, 48, 3494–3504 CrossRef CAS.
- H. Zhou and G. L. Wilkes, J. Mater. Sci., 1998, 33, 287–303 CrossRef CAS.
- D. R. Dillon, K. K. Tenneti, C. Y. Li, F. K. Ko, I. Sics and B. S. Hsiao, Polymer, 2006, 47, 1678–1688 CrossRef CAS.
- J. Liu, X.-L. Lu and C.-R. Wu, J. Appl. Polym. Sci., 2013, 129, 1417–1425 CrossRef CAS.
- C. Marega and A. Marigo, Eur. Polym. J., 2003, 39, 1713–1720 CrossRef CAS.
- O. Hiroji and K. Keiko, Jpn. J. Appl. Phys., 1982, 21, L455 CrossRef.
- K. Tashiro and M. Kobayashi, Phase Transitions, 1989, 18, 213–246 CrossRef CAS.
- J. P. Penning and R. St. John Manley, Macromolecules, 1996, 29, 84–90 CrossRef CAS.
- L. Yang, J. Ho, E. Allahyarov, R. Mu and L. Zhu, ACS Appl. Mater. Interfaces, 2015, 7, 19894–19905 CAS.
- H. Yan, H. Zhang, R. Ubic, M. J. Reece, J. Liu, Z. Shen and Z. Zhang, Adv. Mater., 2005, 17, 1261–1265 CrossRef CAS.
- V. Cauda, S. Stassi, K. Bejtka and G. Canavese, ACS Appl. Mater. Interfaces, 2013, 5, 6430–6437 CAS.
Footnote |
| † Electronic supplementary information (ESI) available. See DOI: 10.1039/c7tc00162b |
| This journal is © The Royal Society of Chemistry 2017 |

