Variability of composition and structural disorder of nanocrystalline CoOOH materials†
Received
25th October 2016
, Accepted 20th February 2017
First published on 21st February 2017
Abstract
In this study, three distinct preparative routes to nanocrystalline (nc) CoOOH yielding compositionally and structurally specifiable materials, which are all closely related to clean CoOOH are presented. Simple precipitation–oxidation and oxidation–precipitation routes using atmospheric oxygen or Br2 dissolved in an aqueous solution of NaOH as an oxidising agent lead to the various products. The purified solids were characterised by means of X-ray powder diffraction (XRPD), chemical, thermal and thermogravimetric analyses, magnetic measurements, and, based on synchrotron data, by means of pair distribution function (PDF) analyses. The chosen routes led to nanocrystalline materials differing in the mean size of the coherently scattering domains (7 nm and 24 nm), in the lattice parameter c, in the relative amount of released mass in the course of conversion into cobalt oxide spinel and the residual relative amount of non-oxidised Co(II). The incomplete oxidation of Co(II) is associated with a molar ratio nH/nO > 0.5 that is found to be the origin of stacking fault disorder in the materials. Possible models of disorder were derived from structural considerations and tested by DIFFaX simulations. A recursive routing for refining the microstructure by global and local optimisation of the measured powder patterns was applied to each sample. Crystal intergrowth of the (AcB)(BaC)(CbA) stacking pattern of clean CoOOH and that of (AcB)(AcB) brucite type Co(OH)2 was identified as a main feature of the microstructures of the three diverse CoOOH-type samples. PDF analyses corroborate the derived microstructural models.
Introduction
CoOOH, a mineral named heterogenite,1 is a multifunctional material used, e.g., as a catalyst,2 CO sensor,3 precursor for electrode materials in energy storage4,5 and other cobalt oxides,4 and high performance supercapacitor,6 and is considered as a promising catalyst for electrochemically supported oxidation of water.7,8 The development of detailed recipes for the synthesis of inorganic materials with useful morphologies is of significant interest in materials science and industry. It is well known, that the way, in which the nanomaterial of interest is prepared, has a crucial impact on its exploitable properties. These usually depend sensitively upon many factors, such as: the precise chemical composition, the crystal structure and microstructure features, the degree of crystalline order, the defect chemistry, the shape of the particles, the size and size distribution of the particles, and the porosity of the material.3 For the production of CoOOH as well as chemically and structurally closely related materials various synthetic approaches have been reported, e.g., oxidation of freshly precipitated Co(OH)2 in alkaline, aqueous medium with H2O23 or atmospheric oxygen,9 oxidation of Co(OH)2 through hydrothermal treatment13 or electrochemically via anodic oxidation of elemental Co.13 Plenty of applications and promising tests of heterogenite materials have stimulated intense research activities recently. Several X-ray powder diffraction (XRPD) patterns of materials denoted as CoOOH have been published, exhibiting vast differences from the expected pattern of well-ordered NaHF2-type CoOOH9 (also denoted as 3R-type heterogenite, see Fig. 1, middle). Remarkably, among the 3d metal oxide hydroxides, only CrOOH is isotypic with the 3R polytype of heterogenite. 3R CoOOH has a rhombohedral symmetry, space group R![[3 with combining macron]](https://www.rsc.org/images/entities/char_0033_0304.gif) m with lattice parameters a = 2.851 Å and c = 13.15 Å.9 The cations are coordinated by oxide and hydroxide ions forming an octahedral coordination sphere. Slightly distorted, edge sharing CoO3OH3 octahedra form layers perpendicular to the c-axis. The anion sublattice exhibits an AABBCC- and the cation sublattice an abc-stacking sequence. In the ordered structure, each oxide ion is juxtaposed to a hydroxide ion of the adjacent layer, which results in strong linear, asymmetric hydrogen-bonds (d(O–H⋯O) = 2.50 Å). Therefore, the AABBCC anion stacking pattern is favoured by attractive interlayer anion interaction mediated by H-bonds. A poorly characterised 2H polytype with a reported composition of CoO1.7(OH)0.3 is also known.10 The structure of this polytype is depicted in Fig. 1, right. 2H CoOOH crystallizes in a hexagonal lattice of space group P63/mmc with lattice parameters of a = 2.855 Å and c = 8.805 Å.1,11 The CoO6-octahedra layers are stacked in a (CaB)(BaC) sequence with each layer indicated by brackets. In Fig. 1 the structures of the two polymorphs are compared to that of brucite-type Co(OH)212 (Fig. 1, left). Note that only the structures of the CoOOH polymorphs afford strong hydrogen bonding.
m with lattice parameters a = 2.851 Å and c = 13.15 Å.9 The cations are coordinated by oxide and hydroxide ions forming an octahedral coordination sphere. Slightly distorted, edge sharing CoO3OH3 octahedra form layers perpendicular to the c-axis. The anion sublattice exhibits an AABBCC- and the cation sublattice an abc-stacking sequence. In the ordered structure, each oxide ion is juxtaposed to a hydroxide ion of the adjacent layer, which results in strong linear, asymmetric hydrogen-bonds (d(O–H⋯O) = 2.50 Å). Therefore, the AABBCC anion stacking pattern is favoured by attractive interlayer anion interaction mediated by H-bonds. A poorly characterised 2H polytype with a reported composition of CoO1.7(OH)0.3 is also known.10 The structure of this polytype is depicted in Fig. 1, right. 2H CoOOH crystallizes in a hexagonal lattice of space group P63/mmc with lattice parameters of a = 2.855 Å and c = 8.805 Å.1,11 The CoO6-octahedra layers are stacked in a (CaB)(BaC) sequence with each layer indicated by brackets. In Fig. 1 the structures of the two polymorphs are compared to that of brucite-type Co(OH)212 (Fig. 1, left). Note that only the structures of the CoOOH polymorphs afford strong hydrogen bonding.
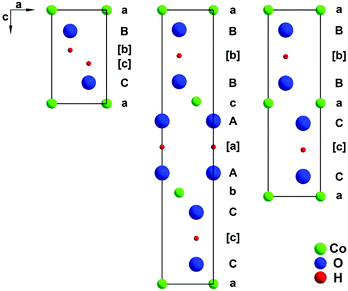 |
| | Fig. 1 Stacking sequence of densely packed atomic layers in brucite-type Co(OH)212 (left), 3R CoOOH9 (middle), and 2H CoOOH1 (right) illustrated as the cut of the structures in the (1−10) plane. | |
The XRPD patterns of CoOOH-related materials frequently diverge significantly from that of structurally perfect ordered CoOOH. Characteristic features of disorder are indicated by slightly displaced Bragg positions of some reflections, symmetry-incompatible splitting of the (101) reflection, asymmetrical reflection broadening, e.g.: (015), even disappearance of reflections, e.g.: (107). These diffraction phenomena have not been completely understood yet. Various authors have already identified the compositional variability of CoOOH materials by shifts of the c lattice parameter.3,14–16 There are also studies addressing the structural disorder: Petzold et al., e.g., reported on very small particles with a CoOOH-related structure that contain additional water molecules and exhibit noticeable lattice distortion.17 Later on, Penn et al. investigated the faulting-induced broadening and shifting of reflections of the (10l) zone associated with the use of specific oxidising agents.18,19 In the present study, we investigated the impact of the synthesis route to nc CoOOH on the relevant characteristics of the heterogenite materials by using three different preparation approaches. Thereby, focus is put on the variation of the size of the coherently diffracting domains, composition, reactivity, and structural disorder. The microstructures of the synthesised materials were investigated in detail by application of a recently published algorithm enabling a recursive global and local optimisation of powder patterns.20DIFFaX simulations as well as pair distribution function (PDF) analyses were employed as complementary tools for the microstructural characterisation.
Experimental section
Syntheses
Nanocrystalline (nc) CoOOH samples were prepared from aqueous solutions of cobalt(II) acetate, NaOH and an oxidising agent. Either atmospheric oxygen or the disproportionation product of Br2 dissolved in aqueous NaOH was used for oxidation of Co(II). Further variation in the procedure concerned the sequence of precipitation and oxidation of Co(II). The first synthesis route is schematically described by eqn (1) and (2) implying that Co(OH)2 suspended in the alkaline solution, was subsequently oxidised by atmospheric oxygen.| | | 2Co(OH)2 + 1/2O2 → CoOOH + H2O | (2) |
In detail, 2 g (8 mmol) of Co(CH3COO−)2·4H2O (Alfa Aesar 98%) were dissolved in 85 mL distilled water. 15 mL of 2 M (30 mmol) NaOH (AppliChem 99%) were added rapidly to the pink solution forming a brownish orange precipitate of Co(OH)2. Subsequently, the suspended precipitate was oxidised with atmospheric oxygen under stirring for 24 h at room temperature and finally heated up to 100 °C for 90 h in order to improve the degree of crystallinity. The dark brown precipitate was centrifuged, twice resuspended in distilled water and centrifuged. The product named CoOOH–O2 was dried at 60 °C.
The second method deviates from the first one in the use of the disproportionation product of Br2 dissolved in an aqueous solution of NaOH as an oxidising agent. Eqn (3) captures the essence of the change in the procedure.
| | | 2Co(OH)2 + 2OH− + Br2 → 2CoOOH + 2H2O + 2Br− | (3) |
In contrast to the first approach, 0.38 mL of (15 mmol) Br
2 were added to the same amount of freshly precipitated Co(OH)
2. The mixture was stirred for 24 h at room temperature before the precipitate was purified as described above. This product is denoted as CoOOH–Br
2. The third procedure departs from the second one in so far as the Br
2 was added to the aqueous solution of NaOH prior to its combination with the solution of cobalt acetate. Hence, oxidation and precipitation can occur simultaneously. Reaction
equation (4) integrates this variation.
| | | 6Co2+ + 21H2O + BrO3− → 6CoOOH + 12H3O+ + Br− | (4) |
In detail, 2 g (8 mmol) of Co(CH
3COO
−)
2·4H
2O were dissolved in 85 mL distilled water.
In situ produced bromate (15 mL 2 M (30 mmol) NaOH and 0.38 mL (0.15 mmol) Br
2) was quickly added to the solution of cobalt acetate. The mixture was stirred for 24 h at room temperature. In order to induce particle coarsening, subsequent heating in water was performed at 90 °C for 24 h. The purification was conducted analogously to the previously described method. The product is denoted as CoOOH–BrO
3−.
Differential thermal analysis
Thermogravimetric (DTG) and differential scanning calorimetric (DSC) analyses were carried out using a STA 409 CD analyser (Netzsch). The sample was placed in a corundum crucible and heated up to 350 °C in an air stream with a flow rate of 150 mL min−1 (CoOOH–BrO3−, CoOOH–O2) and in the case of CoOOH–Br2 up to 600 °C in an argon stream with a flow rate of 150 mL min−1. The heating rate was 10 K min−1.
Density measurements
Density measurements were performed using a gas pycnometer AccuPyc II 1340 (Micromeritics). The powder was placed in an insert (V ≈ 0.1 cm3) and purged with helium for 20 cycles prior to the measurements. Ten cycles were applied for each measurement with a sensitivity of 25 Pa min−1.
Elementary analysis
CHN analyses were done by combustion using a Vario Micro Cube instrument (Elementar). The O content was measured employing a rapid OXI CUBE system of the same company. The Co content was determined by means of microwave plasma atomic emission spectrometry using a 4200 MP AES (Agilent). Br, if present, was identified by means of X-ray fluorescence spectrometry employing a Tornado M4 μ-XRF analyser (Bruker).
Laboratory X-ray powder diffraction experiments
X-ray powder diffraction (XRPD) patterns of the CoOOH samples were measured at room temperature using an X'Pert Pro PW 3064/60 diffractometer (PANalytical) operating in Bragg–Brentano geometry with Co-Kα radiation. The scans covered 15–95° with a step size of 0.026° in 2θ. The diffracted X-rays were recorded using a PIXel detector. A plate cut from a single crystal of silicon served as a sample holder which rotated during measurement. Rietveld refinements were carried out employing the X'Pert HighScore Plus software. Details concerning the calculations are given in Table S1 (ESI†).
SQUID measurements
Magnetic measurements were done using a SQUID magnetometer MPMS (Quantum Design). The magnetisation was recorded at a magnetic field strength of 5000 Oe in the temperature range 5–350 K. The sample was placed in a gelatin capsule fixed in a straw serving as a sample holder. The diamagnetic contribution of the sample holder was determined prior to the measurements of the sample and considered in the data evaluation.
Synchrotron X-ray powder diffraction experiments
Synchrotron X-ray total scattering patterns of the samples were recorded in Debye–Scherrer mode at the National Synchrotron Light Source (NSLS), Brookhaven National Laboratory, at a wavelength of λ = 0.1839 Å (67.42 keV) on beamline X17B1 equipped with a Si(311) sagittal focusing double Laue crystal monochromator. Diffracted X-rays were detected using a Perkin Elmer detector (2048 × 2048 pixels and 200 × 200 μm2 pixel size) mounted orthogonal to the beam path with a sample-to-detector distance of 205.75 mm. The measured samples were sealed in glass capillaries of 0.5 mm diameter. The collected Debye–Scherrer rings were subsequently azimuthally integrated using the program FIT2D21 to one-dimensional powder diffraction patterns in Q [nm−1] and 2θ [°] versus intensity. Parameters for intensity integration were determined from a LaB6 reference sample. Using the software TOPAS,22 Rietveld refinements were carried out, applying the fundamental parameter method23 for peak modeling and Chebyshev polynomials for modeling the background.
Pair distribution function analyses
PDFGETX224 was used to correct and normalize the diffraction data and the Fourier transform in order to obtain the experimental PDF, G(r). The Q range used in the Fourier transform was limited to 30 Å−1. Nickel was previously measured as a standard material to determine the Q-damp and Q-broad parameters which are the parameters that correct the PDF envelope function for instrumental resolution effects.25,26 For structural modeling PDFGui26 was used. Atomic positions of the compounds under investigation were taken from the corresponding CIF9 files of structural data for the ordered crystal structure as in the literature and the supercell structures obtained by the method presented here. However, certain parameters were adjusted to improve the agreement. These were scale factor, Q-damp, Q-broad, the two trigonal lattice parameters and an overall isotropic displacement parameter.
Results and discussion
Chemical and thermogravimetric analyses
The composition of the samples was derived from thermal analyses, ultimate analyses and density measurements. The TGA and DSC curves of the as-prepared CoOOH samples are shown in Fig. 2. The entropically driven, endothermic conversion of clean CoOOH into Co3O4 spinel according to eqn (5) is accompanied by 12.7% mass loss.| | | 12CoOOH → 4Co3O4 + O2 + 6H2O | (5) |
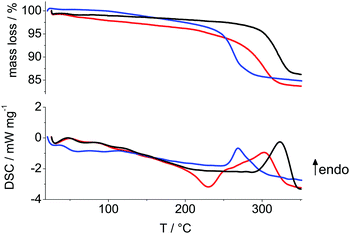 |
| | Fig. 2 TGA (top) and DSC (bottom) of CoOOH–O2 (black), CoOOH–Br2 (blue) and CoOOH–BrO3− (red) at a heating rate of 10 K min−1. | |
The measured mass losses (Table 1) are close to the expected values, though all samples show an additional mass loss, i.e. excess mass, prior to decomposition into spinel (Fig. 2). The sample with the largest domains CoOOH–O2 exhibits the lowest excess mass and CoOOH–BrO3−, which is the most structurally disordered material with a medium domain size shows the highest excess mass.
Table 1 Results of TG and DSC analyses, and densities determined by means of He pycnometry for (a) CoOOH–O2 (m(TG) = 8.7 mg, m(pycnometry) = 30.3 mg), (b) CoOOOH–Br2 (m(TG) = 20.4 mg, m(pycnometry) = 30.0 mg), and (c) CoOOH–BrO3− (m(TG) = 9.7 mg, m(pycnometry) = 15.7 mg)
| |
(a) |
(b) |
(c) |
|
T
trans/°C |
323 |
269 |
303 |
| Excess mass/% |
1.9 |
2.5 |
3.8 |
| Mass lost/% |
11.9 |
12.6 |
12.5 |
| Density/g cm−3 |
4.81(7) |
4.7(1) |
4.23(8) |
The relationship between excess mass and structural disorder is analogous to the relation between structural disorder and: the deviation of the measured c lattice parameter to the reported unit cell lengths of well-ordered 3R CoOOH (Table 4), the deviation of the measured to expected density and the deviation of the measured to the calculated Co content (Table 2). In contrast, the transformation temperature Ttrans of the CoOOH materials into spinel correlates sensitively and inversely with the domain size: the Ttrans of CoOOH–Br2, the material with the smallest mean domain size, is more than 50 °C lower than the Ttrans of CoOOH–O2, the material with the largest domains. The DSC curves depicted in Fig. 2 show that the temperature of transformation into spinel phase is almost independent of the degree of structural disorder of the materials. As shown below, the relative amount of excess mass is in agreement with the elemental composition (Table 2) of the sample and it is directly related to the degree of disorder of the various heterogenite materials.
Table 2 Comparison of the analytically determined Co-, O- and H-contents of (a) CoOOH–O2, (b) CoOOH–Br2, and (c) CoOOH–BrO3− with the expectance value for clean CoOOH
| |
Theory |
(a) |
(b) |
(c) |
| Co/wt% |
64.10 |
61.3 |
61.2 |
60.5 |
| O/wt% |
34.81 |
37.5 |
36.8 |
38.1 |
| H/wt% |
1.09 |
1.2 |
1.6 |
1.4 |
| C/wt% |
0 |
0 |
0.02 |
0.02 |
| N/wt% |
0 |
0 |
0 |
0 |
| Br/wt% |
0 |
0 |
0.34 |
0 |
Laboratory X-ray powder diffraction
The XRPD patterns of the as-prepared samples are shown in Fig. 3. The intensity profiles were fitted by Rietveld refinements based on the reported structural data for the 3R modification.9 The applied refinement procedure is listed in Table S1 (ESI†), selected data of the refinement are listed in Table 3. Depending on the method of synthesis, distinguishable XRD patterns (Fig. 4) were obtained exhibiting different anomalous intensity profiles for some reflections indicative of various disorder phenomena. Despite peak broadening, the diffraction patterns of the synthesized phases are almost identical to the pattern of the structurally ordered 3R polytype. The mean size of the coherently scattering domains of the particles was calculated from the full width at half maximum (FWHM) of the (003) and (110) reflections by applying Scherrer's equation and assuming that the FWHM of these two reflections is not significantly affected by disorder and strain. The mean domain size of the particles, the lattice parameters and aspect ratios of the samples' nc single domains are listed in Table 4. The c lattice parameter varies significantly by ∼0.3 Å. Compared to this variance, the divergence of the a parameters is marginal. These results and the observed reflection broadening suggest a stacking fault disorder of the CoO6-octahedra layers perpendicular to the c axis. Moreover, the degree of structural disorder apparently depends on the oxidation procedure of Co(II). Oxidation using BrO3− (Fig. 3, red trace) and subsequent hydrothermal treatment at 90 °C for 24 h yields particles with coherently scattering domains that have a diameter of 13 nm. This sample exhibits an unusually small c lattice parameter of 13.054 Å. The bromate route yields the structurally most disordered materials. The indicators of disorder are a shift of the (101) and (104) reflections towards lower 2Θ values, abnormal FWMH of the (105) and disappearance of the (107) reflections (Fig. 4, bottom). In addition, this synthesis approach leads to form-isotropic, coherently scattering domains as in the case of the CoOOH–Br2 route. The mean domain size of the particles obtained by the latter procedure is significantly smaller (7 nm). The most eye-catching difference between the products obtained by the bromine and bromate routes is the huge divergence of the c lattice parameter, 13.054 vs. 13.312 Å.
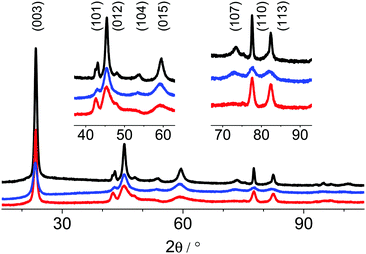 |
| | Fig. 3 XRPD patterns of the as-prepared CoOOH–O2 (black), CoOOH–Br2 (blue) and CoOOH–BrO3− (red) between 15–105° 2θ measured in Bragg–Brentano geometry, Co Kα (λ = 1.78901 Å) radiation. | |
Table 3 Residual values R, goodness of fit χ2, Co–O distance for (a) CoOOH–O2, (b) CoOOH–Br2, and (c) CoOOH–BrO3−
| |
(a) |
(b) |
(c) |
| Co–Oocta/Å |
1.870 |
1.920 |
1.714 |
|
R
p/% |
2.200 |
1.841 |
2.860 |
|
R
wp/% |
3.128 |
2.245 |
4.003 |
|
R
B/% |
1.246 |
0.516 |
0.991 |
|
χ
2/% |
8.467 |
3.920 |
15.006 |
Table 4 Mean size of coherently scattering domains 〈d〉, aspect ratio (110)/(003), lattice parameters a and c of the as- prepared (a) CoOOH–O2, (b) CoOOH–Br2, and (c) CoOOH–BrO3−
| |
(a) |
(b) |
(c) |
| 〈d〉/nm |
24 |
7 |
13 |
| Aspect ratio |
2.5 |
0.9 |
1.0 |
|
a/Å |
2.8528(2) |
2.8559(6) |
2.8450(6) |
|
c/Å |
13.137(3) |
13.312(6) |
13.054(3) |
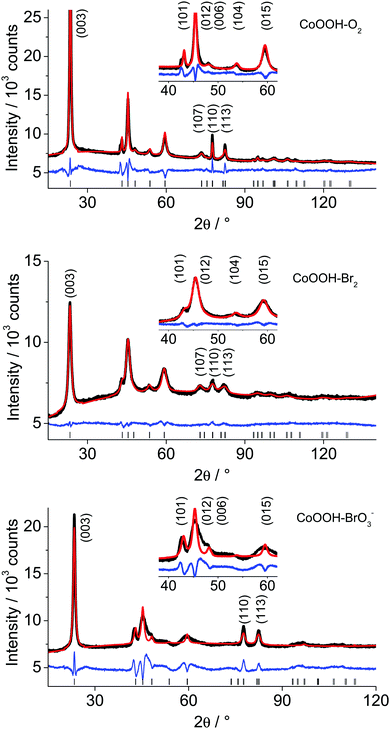 |
| | Fig. 4 XRPD patterns of CoOOH–O2 (top), CoOOH–Br2 (middle) and CoOOH–BrO3− (bottom) with Rietveld refinement (red) between 15–120° 2θ measured in Bragg–Brentano geometry with Co Kα (λ = 1.78901 Å) radiation. | |
The third precipitation route leads to the material denoted as CoOOH–O2 with a c lattice parameter close to the expectance value of structurally well-ordered 3R CoOOH (13.15 Å9). The aspect ratio of the domains of the CoOOH–O2 material differs severely from form-isotropy (Table 4). A shift of the (101) reflection and a symmetry-forbidden reflection showing up as a shoulder at smaller angles point to structural disorder. The XRPD patterns of all synthesised samples and the Rietveld profile fits using the crystal structure of the 3R modification as the starting model,9 are shown in Fig. 4. A comparison of the distances d(Co–O) with those of CoOOH (1.897 Å9) and Co(OH)2 (2.116 Å), respectively, indicates that Co is essentially in oxidation state III. The unreasonably short distance of Co–O for CoOOH–BrO3− results from the insufficiently modelled profiles of the anisotropic broadened peaks.
SQUID measurements
To the best of our knowledge, the magnetic properties of CoOOH have not been reported yet. As known for Co3O4, Co(III) prefers a t62g low spin configuration in an octahedral ligand field of O atoms.27 Thus, diamagnetic properties can be conjectured for clean CoOOH. The measured data at a magnetic field of 5 kOe are shown as plots of reciprocal susceptibility versus temperature (5–350 K) for the three variably prepared heterogenite materials (Fig. 5). The data were fitted consistently assuming Curie–Weiss-type characteristics modified by an additional temperature-independent paramagnetic term χtip. The resulting effective magnetic moments, the χtip terms, and the Curie–Weiss temperatures ΘCW are listed in Table 5 for the three materials. The effective moments vary between 0.4 and 1.1 μB. A strong variation in the curvature of the plots points to a χtip contribution that does not correlate with the paramagnetic moment. In view of the varying paramagnetic moments, it seems reasonable to speculate that different residual amounts of incompletely oxidised, d7 high-spin Co(II) may cause this phenomenon.
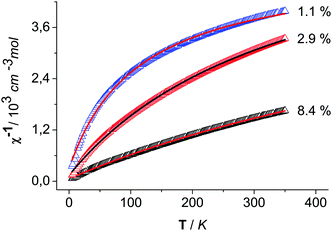 |
| | Fig. 5 Reciprocal susceptibility versus temperature of CoOOH–O2 (black), CoOOH–Br2 (red) and CoOOH–BrO3− (blue) with a modified Curie–Weiss fit (red) from 5 K. | |
Table 5 Magnetic parameters of different samples of CoOOH derived from reciprocal susceptibility data vs. temperature (H = 5000 Oe, 5 K ≤ T ≤ 350 K) of (a) CoOOH–O2 (b) CoOOH–Br2 and (c) CoOOH–BrO3−
| |
(a) |
(b) |
(c) |
|
μ
eff/μB |
0.409(3) |
1.121(3) |
0.658(2) |
| (n(Co2+)/%) |
1.1 |
8.4 |
2.9 |
|
X
tip/10−4 cm3 mol−1 |
1.96 |
1.69 |
1.506 |
|
Θ
CW/K |
−6.4(5) |
−9.0(3) |
−7.8(4) |
The listed percentages of Co2+ (Table 5) are based on the conjecture that only spin moments contribute to the temperature-dependent part of the magnetisation, hence, μeff(Co2+) = √15 μB is assumed. Then, the Co2+ portions approximately vary between 1 and 8% for CoOOH–O2 and CoOOH–Br2, respectively. On the other hand, the barely varying value of χtip (1.7(2) × 10−4 cm3 mol−1) can be rationalized as a van Vleck contribution to the magnetization arising from the partial population of the excited state (1T1g) next to the t62g ground state of the Co(III) species in the heterogenite materials. The value is close to 1.9 × 10⁻⁴ cm3 mol−1 as reported for Co(III) coordination compounds.28
For reasons of electro-neutrality incomplete transformation of Co(II) into Co(III) in the heterogenite materials may result in an increased content of OH− and/or additional H2O disturbing the linear O–H⋯O hydrogen bonds, thereby causing disorder. According to anomalous intensity profiles disorder in terms of stacking faults seems most likely. The following sections address chemical deviations from clean CoOOH and the structural consequences associated with compositional variability in more detail.
Description of stacking faulting-induced diffraction effects
Synchrotron X-ray powder diffraction.
The X-ray powder diffraction patterns of CoOOH–O2 (Fig. 6, black line) and CoOOH–Br2 (Fig. 6, blue line) of CoOOH are fairly similar if the slight broadening of the reflections of CoOOH–Br2 due to a smaller domain size is neglected. CoOOH–BrO3−, however, exhibits most pronounced differences in the diffraction pattern (Fig. 6, red line). Various non-(00l) reflections show vast anisotropic broadening, e.g.: (012) 4.6° 2θ, (104) 5.1° 2θ, (015) 5.8° 2θ, (107) 7.0° 2θ, (024) 8.6° 2θ, (122) 11.4° 2θ, whereas the (003) reflection (2.4° 2θ) exhibits a sharp peak shape. In addition, there is a shift of the (104) reflection (5.1° 2θ) towards lower diffraction angles that causes an overlap with the broadened (012) reflection (4.6° 2θ). LeBail fits29 of the reflection profiles and the lattice parameters of CoOOH, as given in the literature,9 did not yield a good fit of the diffraction pattern (Fig. 7a), but using a c-extended supercell (c′ = 4–8c) did. As CoOOH–BrO3− was determined to be close in composition to CoOOH with only some O and H in excess and Co in deficit in trend with CoOOH–O2 and CoOOH–Br2, these effects on the diffraction patterns are taken as an indication of the presence of stacking faults in the crystal structure of CoOOH–BrO3−. In addition, the LeBail fits as well as the structure refinement of the powder patterns of CoOOH–O2 and CoOOH–Br2 failed in the proper modelling of distinct non-(00l) reflections as, e.g., (104) 5.1° 2θ and (107) 7.0° 2θ, too. Therefore, CoOOH–O2 and CoOOH–Br2 are also expected to exhibit structural faults, but on a lower scale than CoOOH–BrO3−.
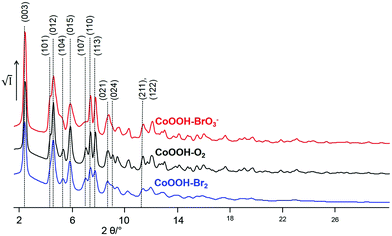 |
| | Fig. 6 Excerpt of the XRPD patterns of the samples CoOOH–Br2 (blue line), CoOOH–O2 (black line), and CoOOH–BrO3− (red line) (synchrotron data, Debye–Scherrer geometry, λ = 0.1839 Å). | |
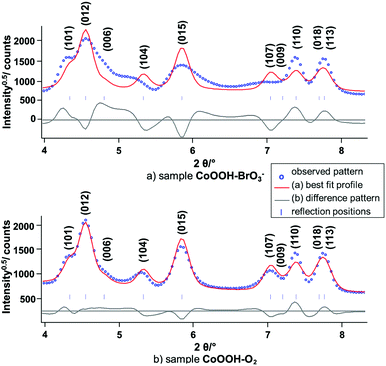 |
| | Fig. 7 Scattered X-ray intensities of (a) CoOOH–BrO3− and (b) CoOOH–O2 under ambient conditions as a function of the diffraction angle 2θ. The observed pattern (circles) measured in Debye–Scherrer geometry (λ = 0.1839 Å), the best Rietveld fit profiles (line) of the LeBail fits using the lattice parameters given by Ibers et al.9 as starting values. | |
Structural considerations.
In the (AcB)(BaC)(CbA) stacking pattern, apparent in structurally ordered 3R CoOOH (Fig. 1, middle), anions of adjacent layers directly oppose each other. Therefore, the interlayer anion interactions (O–H⋯O) are energetically optimised by interjacent hydrogen bonds. Strong hydrogen-bonding is also achieved by the (AcB)(BcA) stacking sequence of CoO1.7(OH)0.3 (Fig. 1, right).10 There are several possible stacking faults: (i) one possibility is an (AcB)(BcA) stacking sequence of the 2H modification. (ii) If the interlayer anions are not attracted strongly enough by hydrogen bonds a change in the stacking sequence of brucite-type Co(OH)2 (CdI2, C6-type) (OH–HO dipole interaction)12 may occur, a larger distance between opposing anions will reduce repulsion. This is achieved by an (AcB)(AcB) stacking pattern (Fig. 1, left). (iii) An (AcB)(CbA)(BaC) stacking sequence (CdCl2, C19-type) leads to a similar effect.
Shifts among these four stacking modes may occur as faults in the crystal structure of CoOOH for the following reasons:
(i) the distribution of hydroxide and oxide ions among the anion sublattice is anisotropic.
(ii) There is an excess of hydroxide in the crystal structure caused by incomplete oxidation of Co(II) in the course of the synthesis.
(iii) Water replaces hydroxide/oxide due to the incorporation of Co(II) into the crystal structure. In addition, small, random displacements of the layers from their ideal positions, (AcB), (BaC) or (CbA), are expected, i.e., turbostratic like effects, especially in sections exhibiting an excess of hydroxide ions or water.
DIFFaX simulations.
Simulations of the XRPD patterns of CoOOH were performed by the DIFFaX routine30 in recursion mode using the reported cell parameters and atomic coordinates9 to illustrate the impact of stacking faults. A set of transition probabilities Pij and stacking vectors Sij (Table 6) for transitions among the considered basic stacking patterns: (AcB)(BaC)(CbA) ≡ “R![[3 with combining macron]](https://www.rsc.org/images/entities/char_0033_0304.gif) m-type”, (AcB)(AcB) ≡ “C6-type”(brucite type), (CbA)(BaC)(AcB) ≡ “C19-type” and (AcB)(BcA) ≡ “2H-type” was defined and used in the DIFFaX simulations.
m-type”, (AcB)(AcB) ≡ “C6-type”(brucite type), (CbA)(BaC)(AcB) ≡ “C19-type” and (AcB)(BcA) ≡ “2H-type” was defined and used in the DIFFaX simulations.
Table 6 Parameters for the probabilities Pij and the related stacking vectors Sij of the considered stacking patterns apparent in CoOOH used in the DIFFaX simulations
| |
“R3m-type” |
“C6-type” |
“C19-type” |
“2H-type”* |
“R![[3 with combining macron]](https://www.rsc.org/images/entities/char_0033_0304.gif) m-type” m-type” |
P11 |
P12 |
P13 |
P14 |
| (AcB)(BaC)(CbA) |
S1
|
S2
|
S3
|
S4-1; S4-2; S4-3 |
| “C6-type” |
P21 |
P22 |
P23 |
P24 |
| (AcB)(AcB) |
S1
|
S2
|
S3
|
S4-1; S4-2; S4-3 |
| “C19-type” |
P31 |
P32 |
P33 |
P34 |
| (CbA)(BaC)(AcB) |
S1
|
S2
|
S3
|
S4-1; S4-2; S4-3 |
| “2H-type” |
P41 |
P42 |
P43 |
P44 |
| (AcB)(BcA) |
S1
|
S2
|
S3
|
S4-1; S4-2; S4-3 |
The impact of C6-type faults on the powder pattern of CoOOH was studied systematically by an iterative increase both of the probability of a shift from (AcB)(BaC)(CbA) to (AcB)(AcB) type stacking and the continuation of an (AcB)(AcB) type stacking (Fig. 8). An increase of the amount of stacking faults in the simulated pattern leads to a broadening of the non-(00l) reflections. In addition, the (012) 4.6° 2θ, (015) 5.8° 2θ and (113) 7.8° 2θ reflections exhibit an upshift and the (104) 5.1° 2θ and (107), 7.0° 2θ reflections a downshift of the diffraction angle.
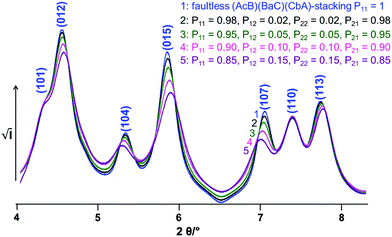 |
| | Fig. 8 Simulated XRPD-patterns of CoOOH containing variable probabilities (Table 1) for transitions between (AcB)(BaC)(CbA) and (AcB)(AcB)-stacking patterns. | |
Analogous simulations using shifts to the C19-type stacking pattern reveal a contrary effect on the diffraction pattern (Fig. S1a, ESI†). The increasing number of faults also leads to peak broadening, but the observed peak shift is reversed.
Shifts to 2H-type stacking lead to an upshift of the (107) 7.0° 2θ and (113) 7.8° 2θ reflections and to a downshift of the (101) 4.3° 2θ, (012) 4.6° 2θ, (104) 5.1° 2θ and (015) 5.8° 2θ reflections (Fig. S1b, ESI†).
The LeBail fits (Fig. 7) to the XRDP patterns CoOOH–BrO3− and CoOOH–O2 revealed peak shifting and anisotropic broadening apparent in the measured patterns. The measured peak shifts with respect to the calculated peak positions that were derived from the crystal structure of pure CoOOH9 are listed in Table 7. A comparison with the calculated shifts caused by distinct faults reveals that C6-type stacking faulting describes all observed peak shifts very well. Both C19- and 2H-type faults lead to inappropriate shifting and broadening of the (012), (015) and (107) reflections. Hence, transitions among (AcB)(BaC)(CbA)- and (AcB)(AcB)-stacked sections are clearly identified as the predominant microstructural features of the CoOOH samples. C19-type stacking faults (Fig. S1a, ESI†) may also be apparent, but only to a very small degree.
Table 7 Overview of the shifts of distinct reflections towards higher (upshift) and lower (downshift) diffraction angles of the measured powder patterns of CoOOH–O2 and CoOOH–BrO3− according to the crystal structure of faultless CoOOH (Fig. 7b) and simulated patterns (Fig. 8) containing distinct faults
| |
Measured patterns |
DiFFaX simulations |
| CoOOH–O2 |
CoOOH–BrO3− |
C6-faults |
C19-faults |
2H-faults |
| (101) |
Down-shift |
Down-shift |
Down-shift |
Upshift |
Down-shift |
| (012) |
Low upshift |
Upshift |
Upshift |
Down-shift |
Down-shift |
| (104) |
Down-shift |
Down-shift |
Down-shift |
Down-shift |
Down-shift |
| (015) |
low upshift |
Upshift |
Upshift |
Down-shift |
Down-shift |
| (107) |
Down-shift |
Down-shift |
Down-shift |
Upshift |
Upshift |
| (110) |
No shift |
No shift |
No shift |
No shift |
No shift |
| (113) |
Slight upshift |
Slight upshift |
Upshift |
Upshift |
Upshift |
The 2H-type stacking pattern (Fig. S1b, ESI†) was derived from the structure of CoO1.7(OH)0.3.10 This phase (Co(IV)0.7Co(III)0.3O1.7(OH)0.3) contains a very large amount of Co(IV). As the formation of Co(IV) in aqueous solution is very unlikely and (AcB)(BcA) type stacking leads to inappropriate shifting and broadening of reflections, the 2H type stacking pattern will be excluded from further microstructural considerations.
Global and local optimisation of the measured powder patterns by using the recursive routine.
The method for global optimisation and refinement of microstructures20 was applied to the XRPD patterns of CoOOH–O2, CoOOH–Br2 and CoOOH–BrO3−. CoOOH–O2 was used for testing the effect of an iterative enlargement of the supercell on both, the result of the refinement and the resulting microstructural model. Therefore, three supercells S of CoOOH were defined: a′ = a, b′ = b, a′ = a, b′ = b, γ′ = γ for each cell with c′ = c for P1, c′ = 4c (12 layers) for S1, c′ = 6c (18 layers) for S2, and c′ = 8c (24 layers) for S3. In each approach, the layers were treated as rigid bodies. Accordingly, identical Co–O distances and interlayer spacings, i.e., the z-component of the stacking vectors, were attributed to each layer. These parameters were derived by Ibers et al.9 and not subjected to free, unconstrained refinement. Applying a comparatively small supercell (S1, 12 layers) leads to a good fit to the XPRD pattern (Fig. S2, ESI†) and acceptable agreement values (Table 4). A further enlargement of the supercell in the c direction (S2, 18 layers) yields improvements in the fit of the XRPD pattern (Fig. S3, ESI†) and improved final agreement values. Further extension of the supercell (S3, 24 layers) does not exhibit additional improvement, neither with respect to the fit (Fig. 9a) nor with respect to the final agreement factors. Nevertheless, for the determination and refinement of the microstructure of CoOOH–Br2 and CoOOH–BrO3− an even more extended supercell (S3, 24 layers) was applied to ensure a sufficient confidence level of the recursion algorithm. This leads to good fits of the XRPD patterns and acceptable agreement factors for CoOOH–Br2 (Fig. 9b) and CoOOH–BrO3− (Fig. 9c), as well (Table 8).
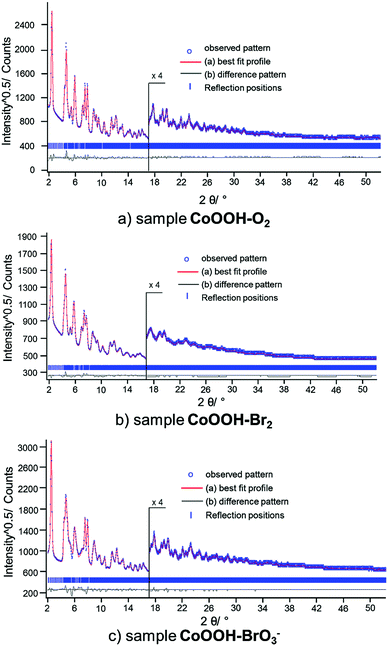 |
| | Fig. 9 Scattered X-ray intensities of (a) CoOOH–O2, (b) CoOOH–Br2, and (c) CoOOH–BrO3− under ambient conditions as a function of the diffraction angle 2θ. The observed pattern (circles) measured in Debye–Scherrer geometry, the best Rietveld fit (line) using the method for microstructure refinement20 with an 8c supercell. The difference curves between the observed and calculated profiles (below) are shown. The high angle part starting at 17.0 2θ is enlarged for clarity. | |
Table 8 Final agreement factors of the refinement of the XRPD patterns of CoOOH–O2 using (a) 4c, (b) 6c, (c) 8c supercells and (d) CoOOH–Br2, (e) CoOOH–BrO3− using a 8c supercell after applying the method for microstructure refinement20
| |
(a) |
(b) |
(c) |
(d) |
(e) |
|
R
exp, Rp, Rwp and χ2 as defined in TOPAS (Bruker AXS).22
|
|
R
exp
/% |
0.155 |
0.155 |
0.154 |
0.187 |
0.139 |
|
R
p
/% |
2.931 |
2.205 |
2.176 |
1.393 |
2.311 |
|
R
wp
/% |
4.476 |
3.265 |
3.347 |
1.912 |
3.894 |
|
χ
2
/% |
3.157 |
2.374 |
2.347 |
1.624 |
1.912 |
Microstructural models of CoOOH.
Microstructural models for the samples CoOOH–O2, CoOOH–Br2 and CoOOH–BrO3− of CoOOH were obtained by conversion of the stacking vectors, after applying the method for microstructure determination and refinement, as described in ref. 20. The results of the determination of the microstructure of CoOOH–O2 are independent of the extension of the supercell used (Table 9). The R![[3 with combining macron]](https://www.rsc.org/images/entities/char_0033_0304.gif) m-type stacking of CoOOH is interrupted by few C6- and C19-type faults. C6-faults are clearly the dominant type of faults within the (AcB)(BaC)(CbA) stacking pattern. The scattering of the stacking vector and hence, the ratio of small, random, turbostratic-like shifts in the stacking pattern of CoOOH–O2 is small. The stacking of CoOOH–Br2 shows less regular faults (Table 9), i.e., shifts from one basic stacking pattern to another, than that of CoOOH–O2. Yet, the ratio of small random shifts in the stacking pattern is considerably higher. C19-faults are completely absent in the microstructure of CoOOH–Br2. The results for CoOOH–Br2 are contrary to the findings of the elementary analysis and magnetic measurements. Because of the small particle size, broad reflections with severe overlap are found, preventing unambiguous fitting. The microstructure of CoOOH–BrO3− exhibits the highest amount of faults. The (AcB)(BaC) (CbA) type base stacking is interjected by many, small (AcB)(AcB)-type stacked sections (Table 9). In addition, a few C19-faults are also apparent in the microstructure, but C6-faults are clearly predominant. This confirms our previous assumptions based on DIFFaX simulations. The impact of small random shifts on the stacking pattern is restricted, as well.
m-type stacking of CoOOH is interrupted by few C6- and C19-type faults. C6-faults are clearly the dominant type of faults within the (AcB)(BaC)(CbA) stacking pattern. The scattering of the stacking vector and hence, the ratio of small, random, turbostratic-like shifts in the stacking pattern of CoOOH–O2 is small. The stacking of CoOOH–Br2 shows less regular faults (Table 9), i.e., shifts from one basic stacking pattern to another, than that of CoOOH–O2. Yet, the ratio of small random shifts in the stacking pattern is considerably higher. C19-faults are completely absent in the microstructure of CoOOH–Br2. The results for CoOOH–Br2 are contrary to the findings of the elementary analysis and magnetic measurements. Because of the small particle size, broad reflections with severe overlap are found, preventing unambiguous fitting. The microstructure of CoOOH–BrO3− exhibits the highest amount of faults. The (AcB)(BaC) (CbA) type base stacking is interjected by many, small (AcB)(AcB)-type stacked sections (Table 9). In addition, a few C19-faults are also apparent in the microstructure, but C6-faults are clearly predominant. This confirms our previous assumptions based on DIFFaX simulations. The impact of small random shifts on the stacking pattern is restricted, as well.
Table 9 Distribution of layer to layer transitions in the superstructures of samples CoOOH–O2, CoOOH–Br2 and CoOOH–BrO3− obtained by the simulated annealing runs. The corresponding fits are shown in Fig. S1 and S2 (ESI) and Fig. 9
| No. of transitions (rel. frequency) |
CoOOH–O2
|
CoOOH–O2 |
CoOOH–O2 |
CoOOH–Br2 |
CoOOH–BrO3− |
|
4c-supercell
|
6c-supercell |
8c-supercell |
8c-supercell |
8c-supercell |
R![[3 with combining macron]](https://www.rsc.org/images/entities/char_0033_0304.gif) m1-type stacking: (AcB)(BaC)(CbA) m1-type stacking: (AcB)(BaC)(CbA) |
R![[3 with combining macron]](https://www.rsc.org/images/entities/char_0033_0304.gif) m1-type → R m1-type → R![[3 with combining macron]](https://www.rsc.org/images/entities/char_0033_0304.gif) m1-type m1-type |
8 (66.7%) |
14 (77.6%) |
17 (70.8%) |
20 (83.4%) |
12 (50.0%) |
C6-type → R![[3 with combining macron]](https://www.rsc.org/images/entities/char_0033_0304.gif) m1-type m1-type |
0 (0%) |
0 (0%) |
2 (8.3%) |
2 (8.3%) |
3 (12.5%) |
C19-type → R![[3 with combining macron]](https://www.rsc.org/images/entities/char_0033_0304.gif) m1-type m1-type |
1 (8.3%) |
1 (5.6%) |
0 (0%) |
0 (0%) |
1 (4.2%) |
|
|
| C6-type stacking: (AcB)(AcB) |
R![[3 with combining macron]](https://www.rsc.org/images/entities/char_0033_0304.gif) m1-type → C6-type m1-type → C6-type |
1 (8.3%) |
1 (5.6%) |
2 (8.3%) |
2 (8.3%) |
4 (16.6%) |
| C6-type → C6-type |
1 (8.3%) |
1 (5.6%) |
1 (4.2%) |
0 (0%) |
3 (12.5%) |
| C19-type → C6-type |
0 (0%) |
0 (0%) |
1 (4.2%) |
0 (0%) |
0 (0%) |
|
|
| C19-type stacking: (CbA)(BaC)(AcB) |
R![[3 with combining macron]](https://www.rsc.org/images/entities/char_0033_0304.gif) m1-type → C19-type m1-type → C19-type |
0 (0%) |
0 (0%) |
0 (0%) |
0 (0%) |
0 (0%) |
| C6-type → C19-type |
1 (8.3%) |
1 (5.6%) |
1 (4.2%) |
0 (0%) |
1 (4.2%) |
| C19-type → C19-type |
0 (0%) |
0 (0%) |
0 (0%) |
0 (0%) |
0 (0%) |
|
|
| Random, turbostratic like layer displacement |
| Average layer displacement |
±0.03x |
±0.03x |
±0.02x |
±0.04x |
±0.03x |
| ±0.03y |
±0.03y |
±0.02y |
±0.04y |
±0.03y |
PDF analysis.
PDF analyses using the programs PDFgetX3 and PDFgui26 were performed using synchrotron data from beamline X17 (NSLS) of each sample. All atomic and lattice parameters were kept fixed. Both the structural data of CoOOH using the original unit cell given in the literature9 (3 layers) and the resulting structural data of the application of the method for determination and refinement of microstructures20 using an 8c supercell (S3, 24 layers) were used for the calculation of the PDF pattern. The impact of stacking faults is expected to be most pronounced in the long distance regions of the PDF pattern. Since the constitution of each layer is, if at all, hardly affected by stacking faults, the intra-layer interatomic distances are not expected to show noticeable deviation from the faultless structure. The relative layer positions, however, are shifted by stacking faults. Hence, the deviation of interlayer interatomic distances from the faultless structure should be clearly visible. As CoOOH–O2 and CoOOH–Br2 exhibit very similar microstructural features (Table 9), the PDF analysis was limited to CoOOH–O2 and CoOOH–BrO3−.
CoOOH–O2 exhibits few faults in the crystal structure (Table 9). Thus, the calculated PDF pattern based on the reported structural and the original unit cells comprises a good model of the measured data (Fig. 10, top). Applying the structural data obtained from the method for determination and refinement of microstructures using an 8c (24 layers) supercell does not affect the calculated pattern for distances <15 Å (Fig. 10, bottom). The calculated data for distances >15 Å, however, show a slightly better agreement with the measured data. Therefore, the structural model using a c extended supercell and including faults in the stacking pattern of the 3R polymorph leads to an enhanced description of the real crystal structure of CoOOH–O2.
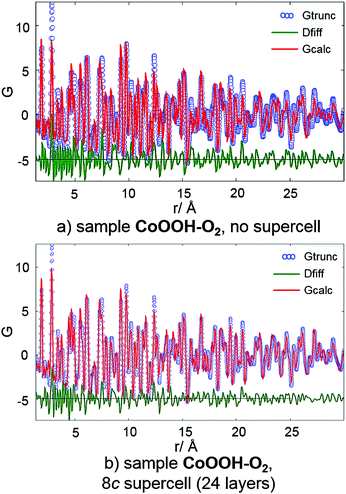 |
| | Fig. 10 PDF curve (blue circles), calculated curve (red line) and difference curve (green line) of CoOOH–O2 using structural data of the original unit9 (a) and the supercell obtained by the method for determination and refinement of microstructures20 (b). | |
The crystal structure of CoOOH–BrO3− is vastly faulted (Table 9). Hence, the fit of the measured PDF data using the original unit cell is quite poor, especially in the range of large distances (>10 Å) (Fig. 11, top). Using structural data from the 8c supercell leads to an enormous improvement of the fit (Fig. 11, bottom). The match between the calculated and measured PDF curves in the range of r > 10 Å is almost perfect. Thus, the microstructural model of CoOOH–BrO3− obtained by the method for determination and refinement of microstructures describes essential features of disorder of its crystal structure.
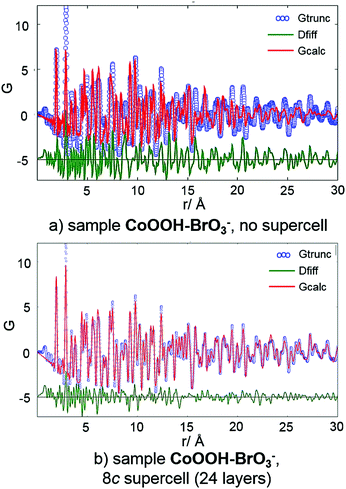 |
| | Fig. 11 PDF curve (blue), calculated curve (red) and difference curve (green) of CoOOH–BrO3− using (a) structural data of the original unit cell9 and (b) the supercell obtained by the method for determination and refinement of microstructures.20 | |
Synopsis of microstructural models, PDF analyses and DIFFaX simulations.
The partial replacement of oxygen by hydroxide or water in the crystal structure of CoOOH materials should lead to a modulation of the Co–O distances. The applied global optimisation and refinement of microstructures,20 however, treats all layers as rigid bodies. No modulation of the Co–O distances is considered. As a consequence and due to the limited extension of the supercells and the treatment of the turbostratic-like disorder, the obtained microstructural models are only approximations of the real microstructures that have to be considered very carefully. Nonetheless, as the calculated diffraction patterns are in good accordance with the measured data (Fig. 9) and DIFFaX simulations (Fig. 8), it can be assumed that the approximations map the microstructure realistically. Complementary PDF analyses (Fig. 11) corroborate this assumption. Reflection broadening caused by the small crystallite sizes can correlate with the broadening induced by turbostratic-like defects, thus, the scattering of the stacking vectors should not be over-interpreted. Yet, the microstructural model of CoOOH–Br2 seems to be contrary to the chemical and thermal analyses and the magnetic measurements. Due to the smallest domain size of CoOOH–Br2 (Table 2) the correlation of turbostratic-like disorder and domain size to reflection broadening is most pronounced among the CoOOH materials discussed here. Broadening affects all reflections in the XRPD pattern of CoOOH–Br2 (Fig. 6, blue line) almost equally, whereas the (104), (107), (024) and (015) reflections of the CoOOH–BrO3− pattern are much more broadened (Fig. 6, red line), despite the larger coherently scattering domain size of the particles of this sample (Table 2). This confirms that the structure of CoOOH–BrO3− is significantly more faulted than that of CoOOH–Br2. Due to the low crystalline size of CoOOH–Br2 this sample is expected to have the largest specific surface. Hence, chemically and physically adsorbed water as well as surface defects may most significantly affect the chemical composition, thermal properties, and the temperature of transformation into spinel.
Conclusions
By varying the oxidation agent and the sequence of precipitation and oxidation of cobalt(II) acetate in alkaline solution, different CoOOH materials varying in composition and degree of structural disorder have been produced. The modifications in synthesis have an impact on the mean size of the coherently scattering domains of the nanoparticles and the material's morphology. Detailed characterisation of the materials obtained by the three synthesis approaches revealed an incomplete oxidation of Co(II). In consequence an excess of water molecules, respective hydroxide ions in relation to the ideal composition CoOOH is incorporated into the structure of the heterogenite material, to maintain charge balance. This has a direct impact on the solid phase properties and the microstructure. All synthesised samples exhibit a different degree of stacking fault disorder. Within the (AcB)(BaC)(CbA) stacking pattern of well-ordered CoOOH (3R), three types of defects were identified from structural considerations: (AcB)(AcB)-(brucite like, C6), (AcB)(CbA)(BaC)-(C19) and (AcB)(BcA)-type (2H) stacking of atomic layers. By applying a recursive routine for global and local optimisation of X-ray powder diffraction patterns, faults in the stacking order of the CoOOH materials were detected almost exclusively as brucite-like (AcB)(AcB)-stacked layers. These results are supported by DiFFaX simulations and PDF analyses. In particular, the comparison of the higher radial distances of the PDF allows for a precise discrimination between different superstructure models. The results show, that subjecting the PDF data as is or in combination with the XRPD pattern to global optimisation, allows for successful determination of disordered superstructures depending on the applied weighting scheme.
Acknowledgements
Open Access funding provided by the Max Planck Society.
References
- M. Deliens and H. Goethals, Mineral Mag., 1973, 39, 152 CAS.
- C.-H. Chen, S. F. Abbas and S. L. Suib, Adv. Mater., 2008, 20, 1205 CrossRef CAS.
- J. Yang, H. Liu and R. L. Frost, J. Phys. Chem. C, 2010, 114, 111 CAS.
- B. Geng, F. Zhan and H. Jiang, Cryst. Growth Des., 2008, 8, 3497 CAS.
- W. K. Hu, X. P. Gao and M. M. Geng, J. Phys. Chem. B, 2005, 109, 5392 CrossRef CAS PubMed.
- D. S. Dhawale, S. Kim and J.-H. Choy, ChemElectroChem, 2015, 2, 497 CrossRef CAS.
- J. H. Huang, J. T. Chen and S. Q. Wei, Angew. Chem., Int. Ed., 2015, 54, 8722 CrossRef CAS PubMed.
- M. Garcia-Mota, M. Bajdich and J. K. Nørskov, J. Phys. Chem. C, 2012, 116, 21077 CAS.
- R. G. Delaplane, J. A. Ibers, J. R. Ferraro and J. J. Rush, J. Chem. Phys., 1969, 50, 1920 CrossRef CAS.
- V. V. Poltavets, M. C. Croft and M. Greenblatt, Phys. Rev. B: Condens. Matter., 2006, 74, 1 CrossRef.
- T. N. Ramesh, Ind. Eng. Chem. Res., 2010, 49, 1530 CrossRef CAS.
- F. Pertlik, Monatsh. Chem., 1999, 130, 1083 CAS.
- D. Petzold, J. Thermal. Anal., 1985, 30, 391 CrossRef CAS.
- M. Butel, L. Gautier and C. Delmas, Solid State Ionics, 1999, 122, 271 CrossRef CAS.
- F. Bardé, M.-R. Palacin and J.-M. Tarascon, Chem. Mater., 2004, 16, 299 CrossRef.
- V. Pralong, A. Delahaye-Vidal and J.-M. Tarascon, J. Electrochem. Soc., 2000, 147(4), 1306 CrossRef CAS.
- R. Schrader and D. Petzold, Z. Anorg. Allg. Chem., 1967, 353, 186 CrossRef CAS.
- R. L. Penn, A. T. Stone and D. R. Veblen, J. Phys. Chem. B, 2001, 105, 4690 CrossRef CAS.
- J. C. Myers and R. L. Penn, Mater. Res. Bull., 2011, 46, 649 CrossRef CAS.
- S. Bette, R. E. Dinnebier and D. Freyer, J. Appl. Crystallogr., 2015, 48, 1706 CAS.
- A. P. Hammersley, S. O. Svensson, M. Hanfland, A. N. Fitch and D. Hausermann, High Pressure Res., 1996, 14, 235 CrossRef.
- Bruker AXS 2009. TOPAS, Version 4.2, Bruker AXS Inc., Madison, Wisconsin, USA.
- R. W. Cheary and A. Coelho, J. Appl. Cryst., 1992, 25, 109 CrossRef CAS.
- X. Qiu, J. W. Thompson and S. J. L. Billinge, PDFgetX2: A GUI driven program to obtain the pair distribution function from X-ray powder diffraction data, J. Appl. Cryst., 2004, 37, 678 CrossRef CAS.
- T. Proffen and S.-J.-L. Billinge, J. Appl. Crystallogr., 1999, 32, 572 CrossRef CAS.
- C. L. Farrow, P. Juhas, J. W. Liu, D. Bryndin, E. S. Božin, J. Bloch, T. Proffen and S. J. L. Billinge, J. Phys. Cond. Matt., 2007, 19, 335219 CrossRef CAS PubMed.
- W. L. Roth, J. Phys. Chem. Solids, 1964, 25, 1 CrossRef CAS.
- J. S. Griffith and L. E. Orgel, Trans. Faraday Soc., 1957, 53, 601 RSC.
- A. LeBail, H. Duroy and J. L. Fourquet, Mater. Res. Bull., 1988, 23, 447 CrossRef CAS.
- M. M. J. Treacy, J. M. Newsam and M. W. Deem, Proc. R. Soc. London Ser. A, 1991, 433, 499 CrossRef.
Footnote |
| † Electronic supplementary information (ESI) available. See DOI: 10.1039/c6tc04626f |
|
| This journal is © The Royal Society of Chemistry 2017 |
Click here to see how this site uses Cookies. View our privacy policy here.  Open Access Article
 *a,
S.
Bette
*bc,
R. E.
Dinnebier
 c,
M.
Abeykoon
 d,
C.
Pietzonka
 a and
B.
Harbrecht
 a
a
![[3 with combining macron]](https://www.rsc.org/images/entities/char_0033_0304.gif) m with lattice parameters a = 2.851 Å and c = 13.15 Å.9 The cations are coordinated by oxide and hydroxide ions forming an octahedral coordination sphere. Slightly distorted, edge sharing CoO3OH3 octahedra form layers perpendicular to the c-axis. The anion sublattice exhibits an AABBCC- and the cation sublattice an abc-stacking sequence. In the ordered structure, each oxide ion is juxtaposed to a hydroxide ion of the adjacent layer, which results in strong linear, asymmetric hydrogen-bonds (d(O–H⋯O) = 2.50 Å). Therefore, the AABBCC anion stacking pattern is favoured by attractive interlayer anion interaction mediated by H-bonds. A poorly characterised 2H polytype with a reported composition of CoO1.7(OH)0.3 is also known.10 The structure of this polytype is depicted in Fig. 1, right. 2H CoOOH crystallizes in a hexagonal lattice of space group P63/mmc with lattice parameters of a = 2.855 Å and c = 8.805 Å.1,11 The CoO6-octahedra layers are stacked in a (CaB)(BaC) sequence with each layer indicated by brackets. In Fig. 1 the structures of the two polymorphs are compared to that of brucite-type Co(OH)212 (Fig. 1, left). Note that only the structures of the CoOOH polymorphs afford strong hydrogen bonding.
m with lattice parameters a = 2.851 Å and c = 13.15 Å.9 The cations are coordinated by oxide and hydroxide ions forming an octahedral coordination sphere. Slightly distorted, edge sharing CoO3OH3 octahedra form layers perpendicular to the c-axis. The anion sublattice exhibits an AABBCC- and the cation sublattice an abc-stacking sequence. In the ordered structure, each oxide ion is juxtaposed to a hydroxide ion of the adjacent layer, which results in strong linear, asymmetric hydrogen-bonds (d(O–H⋯O) = 2.50 Å). Therefore, the AABBCC anion stacking pattern is favoured by attractive interlayer anion interaction mediated by H-bonds. A poorly characterised 2H polytype with a reported composition of CoO1.7(OH)0.3 is also known.10 The structure of this polytype is depicted in Fig. 1, right. 2H CoOOH crystallizes in a hexagonal lattice of space group P63/mmc with lattice parameters of a = 2.855 Å and c = 8.805 Å.1,11 The CoO6-octahedra layers are stacked in a (CaB)(BaC) sequence with each layer indicated by brackets. In Fig. 1 the structures of the two polymorphs are compared to that of brucite-type Co(OH)212 (Fig. 1, left). Note that only the structures of the CoOOH polymorphs afford strong hydrogen bonding.


![[3 with combining macron]](https://www.rsc.org/images/entities/char_0033_0304.gif) m-type”, (AcB)(AcB) ≡ “C6-type”(brucite type), (CbA)(BaC)(AcB) ≡ “C19-type” and (AcB)(BcA) ≡ “2H-type” was defined and used in the DIFFaX simulations.
m-type”, (AcB)(AcB) ≡ “C6-type”(brucite type), (CbA)(BaC)(AcB) ≡ “C19-type” and (AcB)(BcA) ≡ “2H-type” was defined and used in the DIFFaX simulations.
![[3 with combining macron]](https://www.rsc.org/images/entities/char_0033_0304.gif) m-type”
m-type”

![[3 with combining macron]](https://www.rsc.org/images/entities/char_0033_0304.gif) m-type stacking of CoOOH is interrupted by few C6- and C19-type faults. C6-faults are clearly the dominant type of faults within the (AcB)(BaC)(CbA) stacking pattern. The scattering of the stacking vector and hence, the ratio of small, random, turbostratic-like shifts in the stacking pattern of CoOOH–O2 is small. The stacking of CoOOH–Br2 shows less regular faults (Table 9), i.e., shifts from one basic stacking pattern to another, than that of CoOOH–O2. Yet, the ratio of small random shifts in the stacking pattern is considerably higher. C19-faults are completely absent in the microstructure of CoOOH–Br2. The results for CoOOH–Br2 are contrary to the findings of the elementary analysis and magnetic measurements. Because of the small particle size, broad reflections with severe overlap are found, preventing unambiguous fitting. The microstructure of CoOOH–BrO3− exhibits the highest amount of faults. The (AcB)(BaC) (CbA) type base stacking is interjected by many, small (AcB)(AcB)-type stacked sections (Table 9). In addition, a few C19-faults are also apparent in the microstructure, but C6-faults are clearly predominant. This confirms our previous assumptions based on DIFFaX simulations. The impact of small random shifts on the stacking pattern is restricted, as well.
m-type stacking of CoOOH is interrupted by few C6- and C19-type faults. C6-faults are clearly the dominant type of faults within the (AcB)(BaC)(CbA) stacking pattern. The scattering of the stacking vector and hence, the ratio of small, random, turbostratic-like shifts in the stacking pattern of CoOOH–O2 is small. The stacking of CoOOH–Br2 shows less regular faults (Table 9), i.e., shifts from one basic stacking pattern to another, than that of CoOOH–O2. Yet, the ratio of small random shifts in the stacking pattern is considerably higher. C19-faults are completely absent in the microstructure of CoOOH–Br2. The results for CoOOH–Br2 are contrary to the findings of the elementary analysis and magnetic measurements. Because of the small particle size, broad reflections with severe overlap are found, preventing unambiguous fitting. The microstructure of CoOOH–BrO3− exhibits the highest amount of faults. The (AcB)(BaC) (CbA) type base stacking is interjected by many, small (AcB)(AcB)-type stacked sections (Table 9). In addition, a few C19-faults are also apparent in the microstructure, but C6-faults are clearly predominant. This confirms our previous assumptions based on DIFFaX simulations. The impact of small random shifts on the stacking pattern is restricted, as well.
![[3 with combining macron]](https://www.rsc.org/images/entities/char_0033_0304.gif) m1-type stacking: (AcB)(BaC)(CbA)
m1-type stacking: (AcB)(BaC)(CbA)![[3 with combining macron]](https://www.rsc.org/images/entities/char_0033_0304.gif) m1-type → R
m1-type → R![[3 with combining macron]](https://www.rsc.org/images/entities/char_0033_0304.gif) m1-type
m1-type![[3 with combining macron]](https://www.rsc.org/images/entities/char_0033_0304.gif) m1-type
m1-type![[3 with combining macron]](https://www.rsc.org/images/entities/char_0033_0304.gif) m1-type
m1-type![[3 with combining macron]](https://www.rsc.org/images/entities/char_0033_0304.gif) m1-type → C6-type
m1-type → C6-type![[3 with combining macron]](https://www.rsc.org/images/entities/char_0033_0304.gif) m1-type → C19-type
m1-type → C19-type


