
 Open Access Article
 This Open Access Article is licensed under a Creative Commons Attribution-Non Commercial 3.0 Unported Licence
SU-8 based pyrolytic carbon for the electrochemical detection of dopamine
Emilia
Peltola
 *a,
Joonas J.
Heikkinen
b,
Katariina
Sovanto
a,
Sami
Sainio
a,
Anja
Aarva
a,
Sami
Franssila
b,
Ville
Jokinen
b and
Tomi
Laurila
a
*a,
Joonas J.
Heikkinen
b,
Katariina
Sovanto
a,
Sami
Sainio
a,
Anja
Aarva
a,
Sami
Franssila
b,
Ville
Jokinen
b and
Tomi
Laurila
a
aDepartment of Electrical Engineering and Automation, School of Electrical Engineering, Aalto University, Espoo, Finland. E-mail: emilia.peltola@aalto.fi; Tel: +358 50 435 4505
bDepartment of Chemistry and Materials Science, School of Chemical Engineering, Aalto University, Finland
First published on 1st November 2017
Abstract
Here we investigated the electrochemical properties and dopamine (DA) detection capability of SU-8 photoresist based pyrolytic carbon (PyC) as well as its biocompatibility with neural cells. This approach is compatible with microfabrication techniques which is crucial for device development. X-ray photoelectron spectroscopy shows that PyC consists 98.5% of carbon, while oxygen plasma treatment (PyC-O2) increases the amount of oxygen up to 27.1%. PyC showed nearly reversible (ΔEp 63 mV) electron transfer kinetics towards outer sphere redox probe (Ru(NH3)62+/3+), while the reaction on PyC-O2 was quasi-reversible (ΔEp > 75 mV). DA showed both diffusion and adsorption-defined reaction kinetics with fast electron transfer with the ΔEp values of 50 mV and 30 mV, for PyC and PyC-O2, respectively. The strong interaction between the hydroxyl groups on the surface and DA, as confirmed by simulations, facilitates the redox reactions of DA. DA showed a linear response in the measured physiologically relevant range (50 nM–1 μM) and sensitivities were 1.2 A M−1 cm−2 for PyC and 2.7 A M−1 cm−2 for PyC-O2. Plasma oxidation (PyC-O2) improved cell adhesion even more than poly-L-lysine (PLL) coating on PyC, but best adhesion was achieved on PLL coated PyC-O2. Glial cells, neuroblastoma cells and neural stem cells all showed similar behavior.
1. Introduction
Dopamine (DA) is a neurotransmitter that plays important roles in motor control, motivation, arousal, reinforcement, and reward systems. Abnormal DA transmission has been connected with several neurological and psychiatric disorders, e.g. Parkinson's disease, schizophrenia, and Huntington's disease.1 The accurate measurement of DA would provide a better understanding of these diseases and a tool to follow-up the output of the treatments. Electrochemistry provides a cheap in vivo compatible option for the real-time detection of DA.The advantages of carbon electrodes include low cost, a wide potential window, relatively inert electrochemistry, electrocatalytic activity for a variety of redox reactions and good biocompatibility. The various allotropes have very different electrochemical properties and their applications in electro-catalysis depend very much on their microstructure and surface chemistry.2
Carbon materials are widely used in the detection of DA and recently the detection of physiological concentration (<700 nM![[thin space (1/6-em)]](https://www.rsc.org/images/entities/char_2009.gif) 3,4) of DA has been achieved by many approaches.5–14 Even though the detection of DA using carbon based materials is widely examined, the roles of different oxygen based functional groups in this process are not known unambiguously. Here we show that the strong interaction between the hydroxyl groups on the surface and DA facilitates the redox reactions of DA.
3,4) of DA has been achieved by many approaches.5–14 Even though the detection of DA using carbon based materials is widely examined, the roles of different oxygen based functional groups in this process are not known unambiguously. Here we show that the strong interaction between the hydroxyl groups on the surface and DA facilitates the redox reactions of DA.
As a feasible alternative to carbon-based materials prepared by vapor deposition, the pyrolysis of non-volatile organic precursors has facilitated the development of substrates with beneficial properties towards the development of sensors. Fabricating pyrolytic carbon (PyC) films from photoresists has gained interest due to the possibility of forming uniform films with controlled properties. Moreover, photoresists are readily patternable and enable 3D structuring,15–18 making them extremely versatile as a fabrication material. Under this category, SU-8 is one of the most commonly reported materials.19 Pyrolysis results in nanographitic thin film materials. Large densities of edge-plane sites and oxygenated functionalities of PyC make it an ideal candidate for electrochemical sensor applications.20 Recently, the electrochemical performance of SU-8 based PyC electrodes has been probed with common outer and inner sphere probes,16,21,22 but it has not been widely applied in the detection of biological molecules. The detection of DA has been shown previously, but only at non-physiological high (≥5 μM) concentrations.16,17 Moreover, PyC has dopaminergic properties, i.e. promotes neural stem cell differentiation to dopaminergic phenotype,15 which makes PyC a highly interesting material for DA sensors.
Here we investigated the surface characteristics and the electrochemical properties of SU-8 based PyC, simulated adsorption of DA on PyC, and studied the biocompatibility of PyC with neural cells.
2. Experimental methods
2.1 Sample preparation
The thin carbon film on top of silicon wafer was created by the pyrolysis process. First, 4′′ silicon wafer was dipped for 60 seconds into a 10:1 DIW:HF (deionized water:hydrofluoric acid) solution to remove the native silicon dioxide from the wafer surface and make it more hydrophobic. Next, the negative photoactive polymer (Photoresist) SU-8 50 (MicroChem) was spin coated on top of the wafer using a BLE spinner (Georgia Tech) with 9000 rpm for 45 seconds in order to obtain a 10 μm thick layer. The resist was soft baked on a hotplate using the standard protocol, flood exposed at 365 nm wavelength for 8 seconds using an MA-6 mask aligner (Süss Microtec) and post-exposure baked on a hotplate. The wafer was diced into 10 × 10 mm pieces using a Loadpoint Microace 3 dicing saw.
The pyrolysis process was carried out in Nabertherm RS 170/1000/13 horizontal tube furnace. The tube was pumped to vacuum and flushed with nitrogen three times in order to remove most of the oxygen inside. After last flush, low nitrogen flow was left on and the inside pressure is maintained at room pressure. The furnace was first heated to 300 °C and held for 40 minutes in order to degas the remaining oxygen from the film. Then the temperature was raised to 900 °C and maintained for 60 minutes for pyrolysis. Subsequently, the furnace was slowly (for 12 hours) cooled down to room temperature. The ramp up rates during heating were 200 °C h−1.
Oxygen plasma treatment was carried out using a PVA TePla 400 Plasma System for PyC-O2 samples. The samples were exposed to oxygen plasma for 1 minute under 500 ml min−1 oxygen flow and 800 W power at 2.45 GHz.
2.2 Surface characterization
Surface chemical characterization was carried out for the samples to obtain XPS (X-ray photoelectron spectroscopy) survey spectra for elemental ratios (C/O) and high-resolution XPS spectra for carbon (C 1s) and oxygen (O 1s). To obtain estimates for different oxygen functional groups bonded to carbon, peak fitting was carried out for the C 1s high-resolution spectra. XPS measurements were done using an AXIS Ultra electron spectrometer (Kratos Analytical at Aalto Biomaterials Center). Before the measurements samples were pre-evacuated under vacuum overnight (<10−5 Pa). The pressure in the analysis chamber was maintained under <10−6 Pa vacuum during measurements. All spectra were recorded using a monochromatic Al Kα X-ray source at 100 W and neutralization was carried out in the case of charging. The irradiated area during measurements was ∼400 × 800 μm and less than 10 nm deep. Spectra were collected from three locations from each sample.Survey scans (wide spectra) were recorded with a scan step of 1 eV and at 80 eV analyzer pass energy and high-resolution regional spectra were recorded with a scan step of 0.1 eV and at 20 eV analyzer pass energy. Filter paper (100% cellulose, Whatman) was used for binding energy scale calibration (CO = 286.7 eV, C–C = 285.0),23,24 while at the same time working as an in situ reference. CasaXPS software (v. 2.3.18) was used for data fitting, atomic composition ratio calculations and charge corrections. Peak-fitting to the C 1s high-resolution region was done using equally wide full width half maximum (FWHM) Gaussian lines for each oxygen functional group.24
Surface topography was probed using a Ntegra Aura atomic force microscope (AFM, NT-MDT) with golden NSG-01 probe (NT-MDT). Measurements were done in a semi-contact regime.
The Raman spectrum was recorded using WITec Alpha 300 RA, and 532 nm laser. A line length of 3 mm, with 50 points in line, 10 accumulations per point and 0.5 second integration time were used. OriginLab data analysis software was used to analyze the results. The Raman curves were fitted with Lorentzian curves.
Contact angles were measured by optical goniometry (Theta, Biolin Scientific) using the sessile droplet method. Advancing contact angles were measured by increasing the volume of a sessile droplet from 2 μl to 8 μl with a rate of 0.05 μl s−1. The receding contact angles were measured by decreasing the volume from 8 μl to 0 μl with a rate of 0.1 μl s−1. The values are averages of 3 measurements.
2.3 Simulation details
In this work PyC is simulated by introducing a single vacancy defect on a pristine graphene sheet.25 As a material, pyrolytic carbon is similar to graphite, but less organized, thus we choose to use a defective graphene sheet as the first approximation for the simulated PyC surface. We are using a supercell approach, where “infinite” surfaces are created from finite-size slabs by using periodic boundary conditions.26 In the direction perpendicular to the surface dipole corrections27 were used. The size of the graphene sheet used here is 9 × 5 × 1 primitive unit cells, thus there are 180 carbon atoms in a pristine graphene sheet. The adsorption energy of DA, EDAad, is calculated in two different orientations.Functional groups are introduced on the defective site, since the single vacancy defect creates a favorable site for the groups. The functional groups considered here are oxygen as a ketone group, hydrogen, hydroxyl and carboxylic acid groups.
The self-consistent Kohn–Sham (KS) density functional theory28,29 calculations were performed using GPAW suite.† The Perdew–Burke–Ernzerhof (PBE) generalized-gradient approximation (GGA)30 was used as the exchange–correlation density functional. The grid spacing was 0.16 Å in real space. k-space integration was performed using the Monkhorst–Pack (MP) grid31 with 2 × 2 × 1 k-point sampling. van der Waals corrections were made using the method developed by Tkatchenko and Scheffler.32 Calculations were carried out by spin polarization, because a defect can introduce local (atomic) magnetic moments into the system.33
Adsorption energies were calculated as follows:
| EDAad = Etot − (Esurface + EDA) | (1) |
| Etot = Esurface+DA. | (2) |
The binding energies of the functional groups under vacuum are calculated similarly to DA adsorption energies. The total energy of a molecule, EDA, was calculated for both orientations in a cell whose dimensions correspond to the size of the cell that was used in the supercell calculations in order to cancel the possible error caused by electrostatic self-interaction of the molecules under periodic boundary conditions. Solvation effects were included via a continuum solvent model.34–36 In this method the molecule and the surface are surrounded by a smooth cavity and the remaining volume of the cell is set to have dielectric medium whose dielectric constant corresponds the dielectric constant of bulk water. Previously we have seen that dielectric medium can have an effect on charge transfer between the surface and the molecule.37
2.4 Cyclic voltammetry
Cyclic voltammetry was carried out using a Gamry Reference 600 potentiostat in a three-electrode cell. The reference was an Ag/AgCl electrode (+0.199 V vs. SHE, Radiometer Analytical) or a pseudo Ag/AgCl (measurements in Minimum Essential Medium, Biowest, L0415) and a platinum wire was used as the counter electrode. Solutions of 1 mM Ru(NH3)62+/3+ in 1 M KCl, 50–1000 nM DA in PBS (pH 7.4), 100 μM uric acid (UA) in PBS and 1 mM ascorbic acid (AA) in PBS were prepared to probe the electrochemical properties of the PyC films. All chemicals were purchased from Sigma.All the solutions were deoxygenated with N2 purging for at least 15 minutes prior to measurements and blanketed during the measurements.
2.5 Cell cultures
For cell culture experiments, the samples were sterilized in 70% ethanol in Petri dishes for 10 min, after which most of the ethanol was removed, followed by evaporation for 20 min. For comparison, some of the samples were coated with poly-L-lysine (PLL, 15 μg ml−1 in tissue culture grade water) for 5 minutes.Cells were cultured in a humidified incubator with 5% CO2 in the air. C6 (ATCC®CCL-107™) rat glial cells and PC12-Adh (adherent type, ATCC®CRL1721.1™) rat neuroblastic cells were cultured in F12-K medium supplemented with 2.5% fetal bovine serum (FBS) and 15% horse serum. Mouse neural stem cells (mNSC, ATCC®CRL2926™) were cultured in Eagle's Minimum Essential Medium supplemented with 2 mM L-glutamine and 10% FBS. All media were supplemented with 100 IU ml−1 of penicillin and 100 μg ml−1 of streptomycin.
The seeding densities followed the recommended seeding densities for each cell type and were 63000 cells cm−2 for C6 cells and 18000 cells cm−2 for PC12-Adh cells and 36000 cells cm−2 for mNSC. The cells were cultured on 12-well plates for 24 hours.
The viability rate of the cells was tested by 3-(4,5-dimethylthiazol-2-yl)-2,5-diphenyltetrazolium bromide (MTT) assay. After culture, the samples were transferred to a clean 12-well plate and 1 mg ml−1 of MTT was added to the medium. After 3 h incubation at 37 °C in a humidified chamber, MTT was dissolved by adding 1:4 20% sodium dodecyl sulfate (Sigma) in 0.02 M HCl. Samples were incubated overnight, and 800 μl of the media was transferred to clean 48-well microplates and the absorbance was read using an automated plate reader at 570 nm (FLUOstar Optima, Ortenberg, Germany). Data were collected from triplicate samples.
Actin cytoskeleton was stained using phalloidin-568-label (Biotium 1:50, 30 minutes incubation) and nuclei by DAPI (Vectrashield mounting medium with DAPI). An olympus BX51M microscope and a Leica DCF420 digital microscope camera were used for imaging.
3. Results and discussion
3.1 Material characterization
Fig. 1A shows the Raman spectrum of PyC exhibiting a narrow G peak at 1600 cm−1, and a wider and more prominent D band (1360 cm−1). The Raman spectrum is indicative of a typical structure of a pyrolyzed photoresist with broad D and G bands that begin to merge.38 The peak area ratio ID/IG was calculated to be about 3.3, which is extremely high, indicating both a high sp2 content, and a high degree of disorder. The prominence of the D band is indicative of the nano-crystalline nature of these electrodes. The crystallite size La was calculated to be about 5.8 nm, using the equation proposed by L. G. Cançado et al.39 According to the model by Ferrari and Robertson,40 the film has an extremely high content of sp2 hybridized carbon atoms, with no (or only a little) sp3 hybridized atoms in between graphitic crystallites. However, the film has been fabricated at high temperatures and consequently there is some uncertainty in estimating the sp2/sp3 ratio from the D and G band intensity ratios.Table 1 presents the elemental composition of PyC and PyC-O2 obtained by XPS (shown in Fig. 1B). PyC consists of 98.5% of carbon and only a small amount of functional groups exists. Oxygen plasma treatment increases the amount of oxygen up to 27.1% and the C (1s) spectrum shows the presence of hydroxyl, carbonyl and carboxylic acid functionalities. Oxygen plasma treatment induces both defect formation and oxidation on carbon surfaces.41 Consistent with the experimental results, simulated values for the binding energies (Table 2) showed that the defective structure greatly stabilizes the oxygen functional groups.
| % | C 1s | O 1s | N 1s | C (graphitic) | CC | CO | COO | COOO |
|---|---|---|---|---|---|---|---|---|
| a There are functional groups present, but the exact amounts are indefinable due to small amounts. | ||||||||
| PyC | 98.5 ± 0.1 | 1.5 ± 0.1 | 0.1 ± 0.1 | 74.4 ± 1.7 | 16.1 ± 1.8 | |||
| PyC-O2 | 82.4 ± 0.7 | 27.1 ± 0.7 | 0.5 ± 0.1 | 53.4 ± 1.3 | 17.1 ± 0.2 | 17.0 ± 0.7 | 8.3 ± 0.4 | 4.2 ± 0.2 |
 | ||
| Fig. 1 (A) Raman spectroscopy of PyC and (B) broad spectrum XPS of PyC and PyC-O2 surfaces. Topography of (C) PyC and (D) PyC-O2 surfaces. | ||
| Group | Binding energy (eV) | |
|---|---|---|
| Pristine graphene | Defective graphene | |
| H | −0.9 | −4.3 |
| OH | −0.8 | −3.9 |
| O (epoxy) | −2.2 | |
| O (ketone) | −1.3 | −6.3 |
| COOH | −0.1 | −3.5 |
The topographies measured using AFM are visualized in Fig. 1C and D. PyC and PyC-O2 show the average roughness of 0.9 ± 0.6 nm and 0.55 ± 0.03 nm and the root mean square of 1.2 ± 0.6 nm and 0.77 ± 0.04 nm, respectively. PyC shows some (>25 nm, note that Fig. 1 is scaled to be similar for both PyC and PyC-O2) spikes on the surface, but these are etched by plasma oxygen treatment: the peak-to-peak height on PyC is 29 ± 1 nm, while it is 10 ± 2 nm on PyC-O2. Even though plasma oxidation etches the high peaks, roughening of the surface is observed as shown in Fig. 1B.
Surface properties were further characterized by contact angle measurements (Table 3). We measured hydrophobic contact angles for the PyC electrode (θadv = 86° and θrec = 38°). This is in line with previous reports stating that bare electrodes developed in Ar–H2 display a contact angle of approximately 80°.7 Plasma treatment changed the surface properties of PyC-O2 to fully hydrophilic (θ < 5°), but long time exposure to air significantly altered the surface properties of the PyC-O2 electrode (θadv = 46° and θrec < 7°).
| θ adv | θ rec | |
|---|---|---|
| PyC | 86° ± 2° | 38° ± 3° |
| PyC-O2 (pristine) | <5° | <5° |
| PyC-O2 (stored) | 46° ± 1° | <7° ± 2° |
3.2 Electrochemical properties
We tested pyrolysis also at 600 °C and 800 °C. The samples prepared at 600 °C showed irreversible reaction kinetics for FcMeOH (ΔEp 880 mV). In general, ΔEp for common redox probes, Fe(CN)6 or Ru(NH3)63+/2+, on photoresist based PyC has been observed to decrease with increasing pyrolysis temperatures (from 600 °C to 1100 °C).22,42–44 Samples prepared at 800 °C had quasi-reversible reaction kinetics (ΔEp 64 mV in FcMeOH), but did not show a linear increase in Ipo with increasing DA concentration. Therefore, samples pyrolyzed at 900 °C were selected for closer analysis.Fig. 2 shows the water windows for PyC and PyC-O2 electrodes in KCl and in PBS. Both PyC and PyC-O2 electrodes demonstrate a wide potential window with low background current. The width of the potential window is more or less the same for PyC and PyC-O2 electrodes, but the background current is larger for the PyC-O2 electrode. In PBS, the PyC-O2 electrode shows an oxidation peak at 0 V, possibly due to an oxygen functional group.
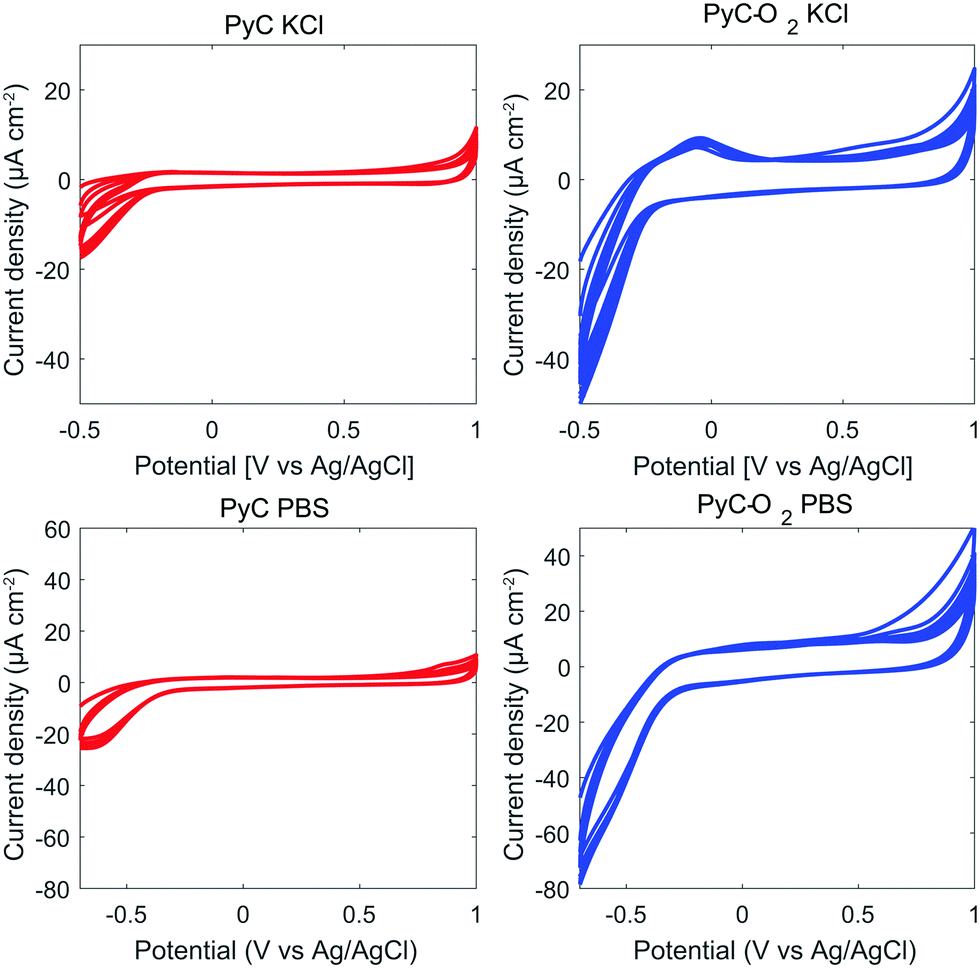 | ||
| Fig. 2 Water windows in KCl and PBS for PyC and PyC-O2 electrodes. The electrodes were cycled for 10 cycles using a scan rate of 100 mV s−1. | ||
Outer sphere redox reactions were probed with Ru(NH3)63+/2+ (Fig. 3). PyC shows nearly reversible reaction kinetics with ΔEp values of 63 ± 3 mV with all scan rates utilized (Table 4). PyC-O2 electrodes demonstrate slower electron transfer and quasi-reversible reaction kinetics with ΔEp increasing together with the scanning rate from 75 mV to 146 mV (10 mV s−1 and 400 mV s−1, respectively, Table 4). This may be related to the increase in the film resistance after oxygen plasma treatment and a subsequent increase in electron transport resistance through the PyC-O2 film, especially at high scan rates (and thus high currents). The current range is similar for both PyC and PyC-O2 electrodes. PyC-O2 electrodes shows a large variation between the electrodes, which can be due to the instability of the surface as demonstrated by contact angle measurements for pristine PyC-O2 and PyC-O2 exposed to air. Previously reported values for Ru(NH3)63+/2+ for SU-8 based PyC show slightly slower reaction kinetics with the ΔEp of ≥74 mV.44
 | ||
| Fig. 3 Cyclic voltammogram of the PyC and PyC-O2 electrodes in Ru(NH3)63+/2+ with varying scan rates. | ||
| Scan rate (mV s−1) | Ru(NH3)63+/2+ ΔEp (mV) | DA ΔEp (mV) | ||
|---|---|---|---|---|
| PyC | PyC-O2 | PyC | PyC-O2 | |
| a A reduction peak could not be defined at a scan rate of 10 mV s−1. | ||||
| 10 | 62.0 ± 2.8 | 75 ± 9 | ||
| 50 | 60.9 ± 1.6 | 88 ± 19 | 46.6 ± 5.0 | 31.5 ± 6.4 |
| 100 | 62.8 ± 1.4 | 97 ± 25 | 44.6 ± 4.9 | 26.3 ± 2.1 |
| 400 | 66.1 ± 4.9 | 146 ± 44 | 57.1 ± 12.9 | 29.8 ± 4.6 |
Next, the response towards DA was tested (Fig. 4). The ΔEp values for DA, given in Table 4, show fast electron transfer with ΔEp ∼ 50 mV for PyC and ∼30 mV for PyC-O2. The logarithmic plot of oxidation current versus scan rate is presented in Fig. 4C. The slope for a diffusion–controlled process should be 0.5 and for an adsorption-controlled process it should be 1. The slope for PyC is 0.60 and for PyC-O2 is 0.78, indicating that both adsorption and diffusion are important. Adsorption of the DA layer on the electrode is known to be catalytic towards DA oxidation and reduction,45 partly explaining the fast electron transfer kinetics observed for both PyC and PyC-O2 electrodes. Moreover, the slope for log(Iox) vs. log(ν) indicates that adsorption plays stronger role in the electron transfer rate for PyC-O2 than for PyC, and PyC-O2 demonstrates faster reaction kinetics. The very sharp oxidation peak further emphasizes the role of adsorption in the case of PyC-O2 for DA as shown in Fig. 4(B) and (E).
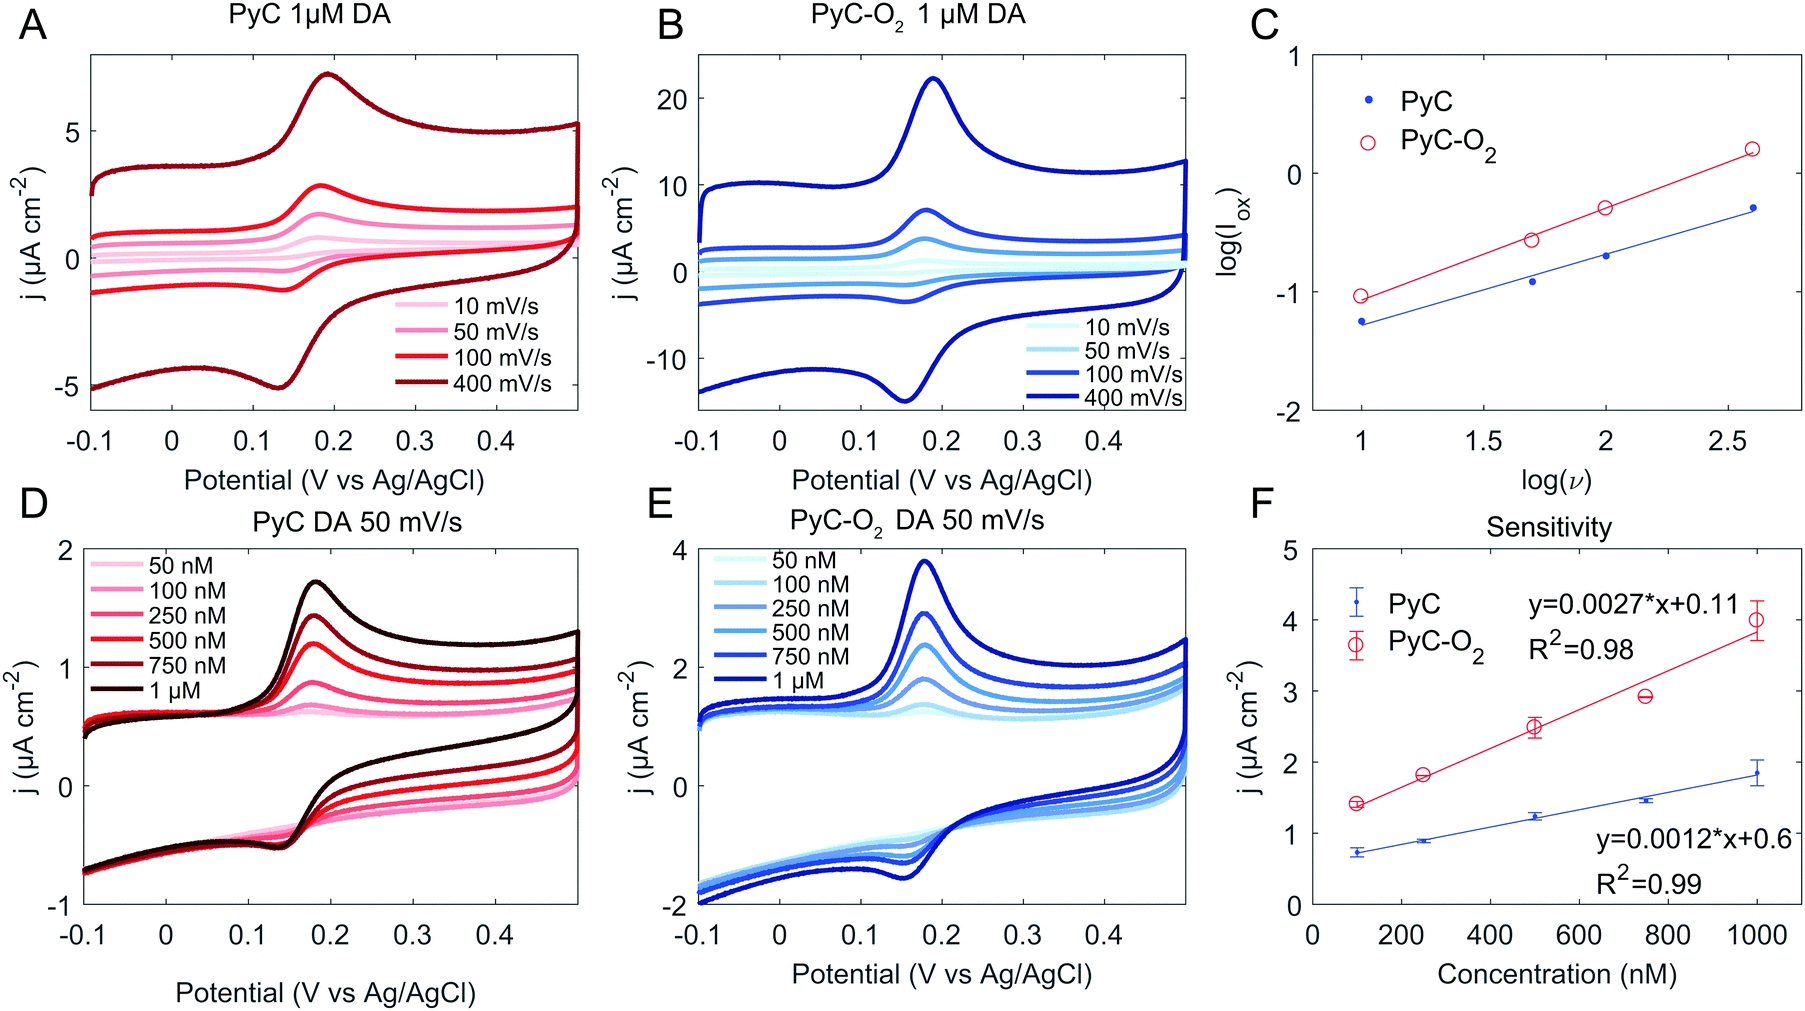 | ||
| Fig. 4 Cyclic voltammogram of the PyC (A and D) and PyC-O2 (B and E) electrodes in DA with varying scan rates (A and B) and concentrations (D and E). Panel (C) shows the linear dependence of peak oxidation current and scan rate and (F) the sensitivity of the electrodes. | ||
Both PyC and PyC-O2 electrodes demonstrate a linear response to DA within the tested range (50 nM to 1 μM, Fig. 4F), which corresponds to the physiologically relevant concentrations (0.01–1 μM in extracellular fluid46,47). Sensitivity towards DA is calculated to be 12000 A M−1 m−2 for PyC and 27000 A M−1 m−2 for PyC-O2. The calculated sensitivities on 3D structured PyC samples are higher than that achieved here (69000 A M−1 m−24), but the increase in the surface area due to the 3D structure was not taken into account. The limit of detection was calculated to be 40 nM for PyC and 20 nM for PyC-O2. SU-8 based PyC performs relatively well in comparison to recent studies with carbon based materials (Table 5) as there are not many studies, where as low as 50 nM concentrations have been measured.
| Sensor | LOD (nM) | Lowest measured concentration (nM) | Linear range (μM) | Detection method | Selectivity (μM) | Ref. |
|---|---|---|---|---|---|---|
| Abbreviations: graphite oxide (GO), carbon paste (CP), glassy carbon (GC), carbon nanotube (CNT), carbon fiber (CF), diamond-like carbon (DLC), tetrahedral amorphous carbon (ta-C), carbon nanofibers (CNF); partially reduced graphene oxide (PRGO).a Two linear ranges. | ||||||
| Carbon based materials in the detection of DA in the presence of AA | ||||||
| GO/CP | 15 | 700 | 0.7–70 | DPV |
AA 5000
UA 1000 |
5 |
| Helical CNT/GC | 10 | 800 | 0.8–80 | DPV |
AA 1000
UA 80 |
6 |
| CNF | 50 | 0.1–100a | DPV | AA 1000 μM | 7 | |
| Graphene flowers/CF | 500 | 1360 | 1.36–125.69 | DPV |
AA 2305.53
UA 271.49 |
8 |
| DLC + CNT | 1.26 | 500 | CV | AA 1000 μM | 9 | |
| ta-C + CNF | 500 | CV | AA 1000 μM | 10 | ||
| Graphene nanosheets | 200 | 400 | 0.4–100 | DPV |
AA 1500
UA 250 |
11 |
| Porous graphene | 200 | 200 | 0.2–8 | DPV |
AA 1000
UA 20 |
12 |
| Functionalised carbon nanospheres | 10 | 49.3 | 0.0493–3.98 | DPV |
AA 600
UA 60 |
13 |
| PRGO/ta-C | 2.6 | 250 | 0–100a | DPV | AA 1000 μM | 14 |
| Pyrolytic carbon electrodes in the detection of DA | ||||||
| CVD PyC | 2300 | 20 | ||||
| CVD PyC | 40 | 0.1–9.8 | DPV |
AA 130 μM
UA 5 μM |
48 | |
| AZ1518 PyC | 1000 | Fast scan CV | 49 | |||
| SU-8 PyC | 5000000 |
CV | 15 | |||
| SU-8 PyC (3D) | 5000 | CV | 50 | |||
| SU-8 PyC (3D) | 25000 |
Square wave voltammetry | 16 | |||
| SU-8 PyC | 40 | 50 | 0.05–1 | CV |
AA not achieved
UA 100 μM |
This work |
| SU-8 PyC-O2 | 20 | 50 | 0.05–1 | CV |
AA not achieved
UA 100 μM |
This work |
Although DA has previously been measured using SU-8 based thin film PyC electrodes, it has only been reported at high concentrations (≥5 μM16,17). Here we showed the detection of DA at physiologically relevant concentrations.
The current in the potential region of the surface redox process increased considerably on the PyC-O2 electrode compared to the PyC electrode. This is interpreted as an enhancement in the number of oxygen-containing functional groups involved in the surface redox process. Improved electrochemical performance of PyC electrodes has previously been reported through the use of facile O2-plasma treatments.15,20 It has been suggested previously that the ability of electrode surfaces to form hydrogen bonds enhances the adsorption and hence the reaction of DA.51 Although overoxidation of carbon-based electrodes has been observed to enhance DA adsorption,52 the roles of different oxygen based functional groups in this process are not known unambiguously at the moment and therefore further investigations are required.
In order to resolve this issue, we simulated the adsorption energies of DA on PyC with different functional groups attached. Fig. 5 presents the model together with the measured DA adsorption energies. Simulations were performed on defective graphene and defective graphene with hydrogen, hydroxyl, ketone or carboxyl functionalities on its surface. The highest (negative) adsorption energies were observed on defective graphene with hydroxyl groups on the surface. However, the adsorption energies on defective graphene show a large variation depending on the orientation of DA. Most likely, this is caused by the π-orbital interaction between graphene hexagons and DA hexagons, which also explains the strong orientation dependence. This coupling of π-electrons has earlier been observed on carbon nanotubes and aromatic molecules.53 The most significant quantified finding of the model is that the addition of oxygen is not sufficient to promote DA adsoption, but the type of functional group is critical for the DA adsorption to occur.
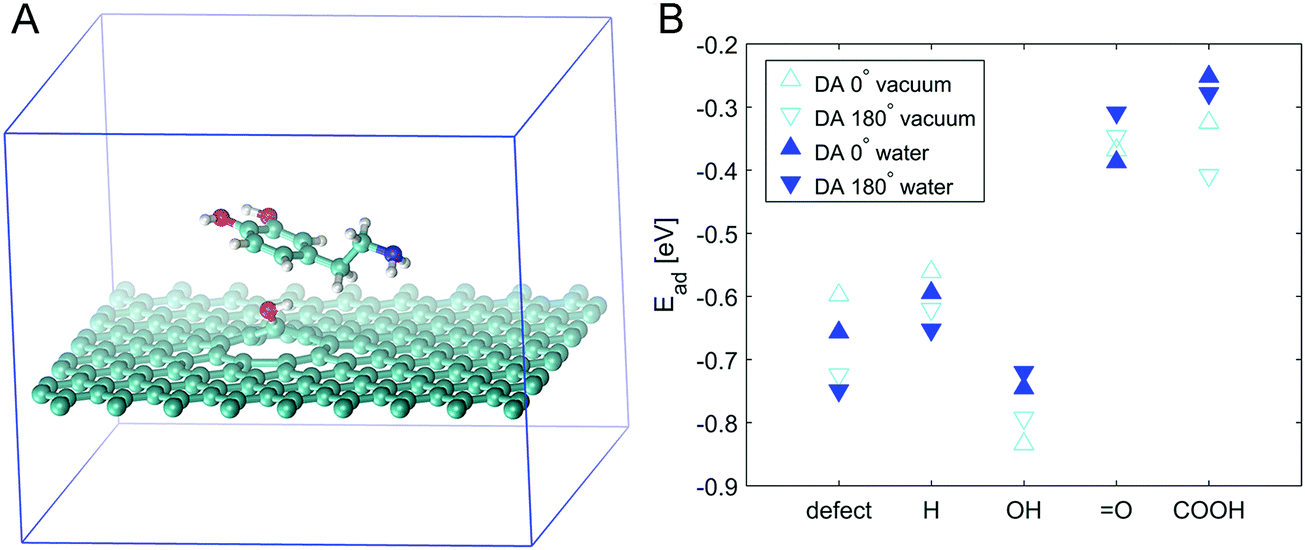 | ||
| Fig. 5 Panel (A) shows an example of a model system with DA in 0° orientation on top of defective graphene functionalized with a hydroxyl group. Panel (B) shows the calculated adsorption energies of DA under vacuum (v) and in simulated aqueous solution (w) in two different orientations: DA 0° and DA 180°, i.e., the molecule is rotated at 180°. | ||
The experimental results and simulations are consistent and can be summarized as follows: (i) the simulations show that the defective surface greatly stabilises oxygen functionalities. This was verified by experimental results showing the presence (27%) of abundant oxygen functionalities (XPS) and the increased polarity of the surface (contact angle measurements), indicating the presence of highly polar groups, such as hydroxyl groups on the oxygen plasma treated surface. XPS showed that the major groups among the functional groups were hydroxyl and/or epoxy groups. In defect locations, these are most likely, mainly hydroxyl groups. (ii) The simulations showed that the interaction beween DA and the hydroxyl group is stronger than that between DA and other functional groups, while the experimental results showed increased adsorption dependence on the DA reaction kinetics together with the fast reaction kinetics of DA on the PyC-O2 (plasma treated) surface compared to that on pristine PyC. In conclusion, the stronger interaction between the hydroxyl functional groups on the surface and DA, confirmed by the simulations, facilitates the redox reactions of DA, which is consistent with the experimental measurements.
The selective detection of DA is challenging in biological samples, as its oxidation potential range is very close to those of the commonly interfering analytes such as ascorbic acid (AA) and uric acid (UA). We evaluated the selectivity of PyC and PyC-O2 electrodes against AA (Fig. 6A and B). AA is present in the brain at considerably higher concentrations compared to DA, and the two compounds are oxidized at similar potentials on carbon electrodes making AA a major interferent in the electrochemical detection of DA.54 Unfortunately, when DA and AA are measured together, no selectivity is observed at oxidation potentials. The peak separation for DA and AA is approximately 55 mV for PyC and 40 mV for PyC-O2, whereas good peak separation is regarded as at least 200 mV. Note that some papers report the selective detection of DA in the presence of AA, but only relatively low concentrations of AA are utilized. The selectivity of the sensors towards DA should be measured in the presence of AA at a neurophysiological concentration (∼1 mM). However, better selectivity could be achieved by differential pulse voltammetry (DPV) as has been shown with many carbon based materials, including methane based PyC (Table 5). It is also possible to change the potential window and cycling speed in cyclic voltammetry to achieve a higher analytical resolution. Moreover, the reduction peak at 115 mV is specific for DA even in the presence of AA. Unfortunately, AA reduces the DA oxidation product dopamine-o-quinone, regenerating DA. This catalytic reaction by AA provides more DA for electro-oxidation and less dopamine-o-quinone for electro-reduction.55 Thus, when using reduction potentials, the sensitivity of the electrode for DA is significantly reduced in the presence of AA. Finally, by modifying the surface of the PyC electrode to contain explicit amounts of some other oxygen functional groups in addition to hydroxyl groups, we could assist the adsorption of AA and separate it from the DA peak. This issue is currently studied in our laboratory.
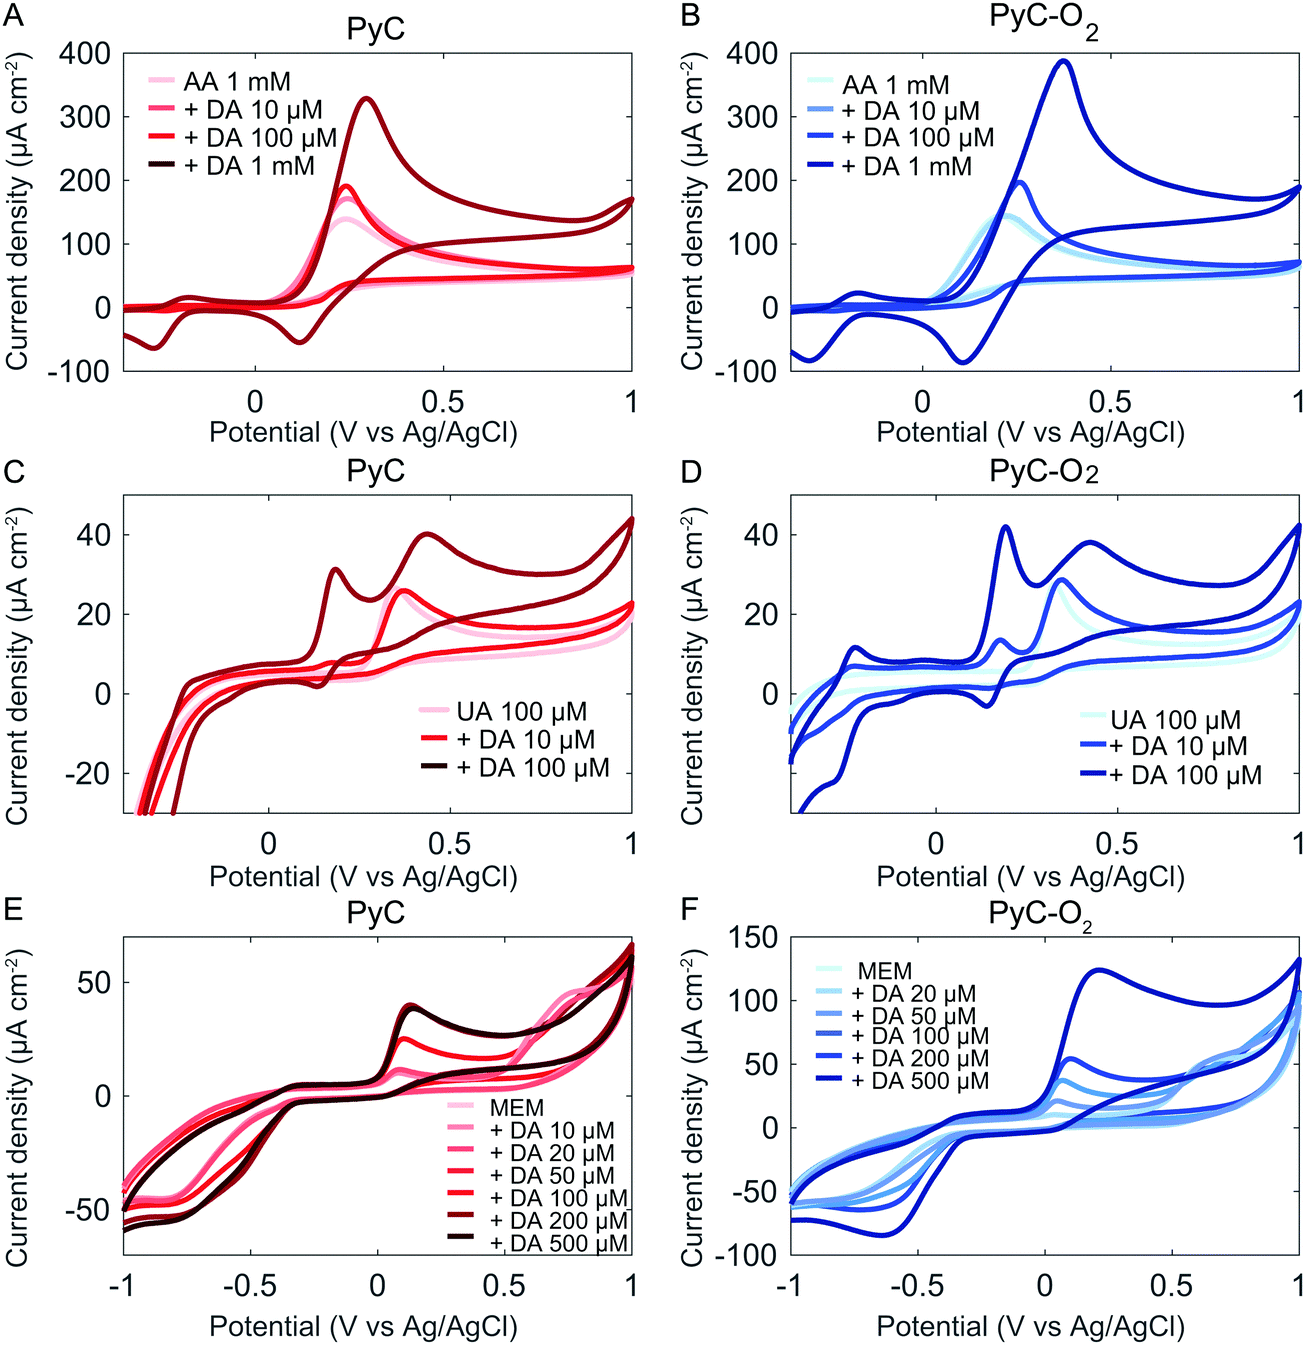 | ||
| Fig. 6 Selectivity of PyC and PyC-O2 electrodes towards AA (A and B), UA (C and D) and cell culture media (E, F), measured at a scan rate of 50 mV s−1. | ||
We evaluated the selectivity of PyC and PyC-O2 electrodes against UA. The concentration of UA in human blood plasma is 140–420 μM; however, the content of UA in the cerebrospinal fluid is only 7–10% of its content in the blood plasma because the access of UA in the blood plasma to the brain is limited by the blood–brain barrier.56,57 The selective detection of DA in the presence of 100 μM UA was achieved (Fig. 6C and D).
To model the behavior of the electrodes in a complex environment, the electrochemical response of the electrodes was measured also in cell culture media (MEM), which contain essential nutrients for cell growth. In MEM, a large oxidation peak is observed at 600 mV (Fig. 6C and D). The peak corresponds to the nutrients present in MEM, possibly to some amino acids. This peak intensity decreases with increasing cycle number, indicating an irreversible reaction occurring at the electrode.
The DA detection peak is clear in MEM, but the peak shifts to 45 mV (vs. 180 mV in PBS, 50 mV s−1). The reduction peak shifts to approximately −600 mV (vs. 140 mV in PBS, 50 mV s−1), but it is not clear whether other reduction reactions of MEM occur at the same potential. However, it is clear that ΔEp significantly increases. This is possibly due to the adsorption of other molecules in the MEM on the electrode surface which interferes with the DA adsorption process. At higher concentrations (>200 μM PyC and >500 μM on PyC-O2), the response towards DA is no longer linear. This is expected to be due to the adsorption dependent reaction kinetics as DA has to compete for adsorption sites with the molecules present in MEM. At higher concentrations, there might not be enough adsorption sites left for DA.
3.3 Cell viability
Cell viability was tested with C6 glial cells, PC12-Adh neuroblastic cells and mNSCs (Fig. 7). All the tested cells behaved more or less similarly. PLL coating on PyC and plasma oxidation (PyC-O2) increased the amount of cells slightly, but a significant increase was observed with PLL on PyC-O2. Oxygen functionalities after plasma-treatment provide anchoring points for improved physisorption of PLL mediating cell adhesion. Consequently, cells on PLL coated PyC-O2 show improved adhesion and spreading (Fig. 7, bottom row). Similar behavior has previously been observed using human NSCs.15 Relatively largest changes in cell viability count were observed with PC12-Adh cells, but this is possibly due to their smaller count (seeding density 18000 vs. 36000 or 63000 cells cm−2). It is to be noted that the surfaces do not cause cytotoxic effects on cells, but the cells rather migrate to the cell culture plastic surrounding the samples as the MTT measured from the wells, where the sample was removed, shows the opposite trend for cell viability.
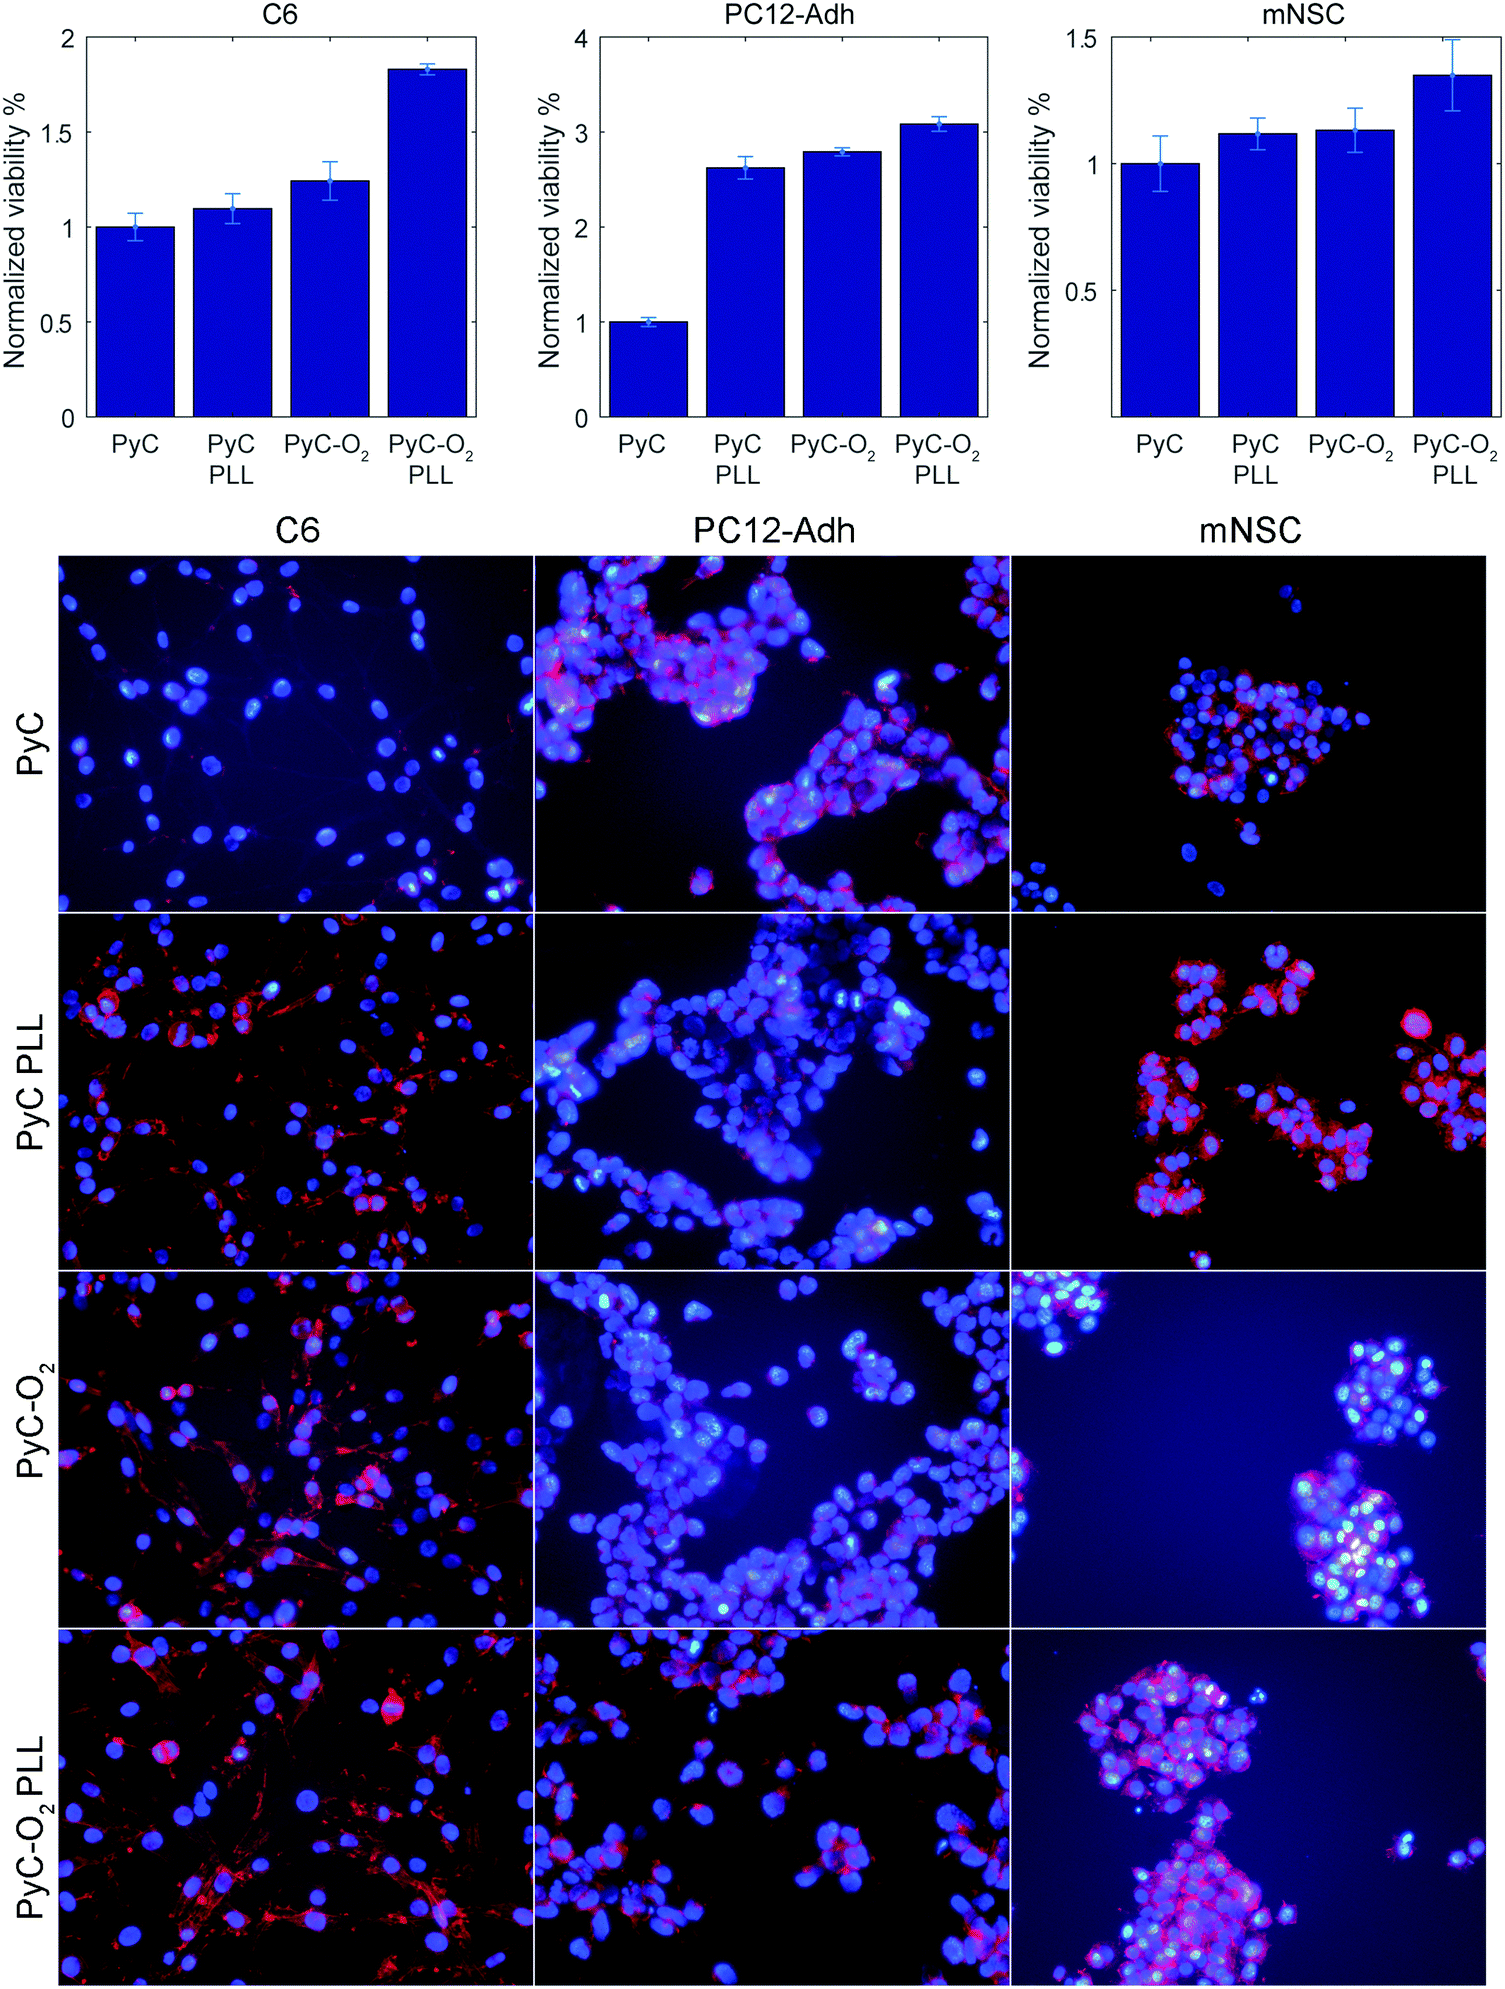 | ||
| Fig. 7 C6 glial cells, PC12-Adh neuroblastic cells and mouse neural stem cell viability and morphology (actin on red, nuclei on blue) on PyC and PyC-O2 samples with and without PLL coating. | ||
4. Conclusions
We showed fast reaction kinetics towards DA on PyC and PyC-O2 with a linear response in the physiologically relevant range (50 nM–1 μM). The reaction kinetics of DA was both adsorption and diffusion dependent. Plasma oxidation enhanced the response towards DA, but the plasma-oxidized surface was not very stable. The stronger interaction between the hydroxyl functional groups on the surface and DA, as confirmed by the simulations, facilitates the redox reactions of DA, which is consistent with the experimental measurements. Plasma oxidation (PyC-O2) improved cell adhesion even more than PLL coating on PyC, but best adhesion was achieved on PLL coated PyC-O2. This demonstrates that SU-8-derived carbon can be easily modified to enable cell studies. This SU-8 based approach of making PyC is compatible with microfabrication techniques which is crucial for further device development.Conflicts of interest
There are no conflicts to declare.Acknowledgements
Academy of Finland (E.P. grant #274670, S.F. grant #297360 and T.L. grants #285015 and #285526) and Finnish Funding Agency for Innovation (#211679) are acknowledged for funding. Leena-Sisko Johansson from the Department of Bioproducts and Biosystems, School of Chemical Technology, Aalto University is acknowledged for help with the XPS measurements. The computational resources provided for this project by CSC-IT Center for Science through Taito cluster is also gratefully acknowledged. The work utilized the cleanroom facilities of Micronova.References
- J. Beaulieu and R. R. Gainetdinov, The Physiology, Signaling, and Pharmacology of Dopamine Receptors, Pharmacol. Rev., 2011, 63, 182–217 CrossRef CAS PubMed.
- T. Laurila, S. Sainio and M. Caro, Hybrid Carbon Based Nanomaterials for Electrochemical Detection of Biomolecules, Prog. Mater. Sci., 2017, 88, 499–594 CrossRef CAS.
- J. Zen and P. Chen, A Selective Voltammetric Method for Uric Acid and Dopamine Detection Using Clay-modified Electrodes, Anal. Chem., 1997, 69, 5087–5093 CrossRef CAS.
- R. M. Wightman, L. J. May and A. C. Michael, Detection of Dopamine Dynamics in the Brain, Anal. Chem., 1988, 60, 769–779 CrossRef.
- T. Thomas, R. J. Mascarenhas, C. Nethravathi, M. Rajamathi and B. E. Kumara Swamy, Graphite Oxide Bulk Modified Carbon Paste Electrode for the Selective Detection of Dopamine: a Voltammetric Study, J. Electroanal. Chem., 2011, 659, 113–119 CrossRef CAS.
- J. Zhang, Z. Zhu, J. Zhu, K. Li and S. Hua, Selective Determination of Dopamine, Ascorbic Acid and Uric Acid at SDS-MWCNTs Modified Glassy Carbon Electrode, Int. J. Electrochem. Sci., 2014, 9, 1264–1272 Search PubMed.
- E. Rand, A. Periyakaruppan, Z. Tanaka, D. Zhang, M. P. Marsh, R. J. Andrews, K. H. Lee, B. Chen, M. Meyyappan and J. E. Koehne, A Carbon Nanofiber Based Biosensor for Simultaneous Detection of Dopamine and Serotonin in the Presence of Ascorbic Acid, Biosens. Bioelectron., 2013, 42, 434–438 CrossRef CAS PubMed.
- J. Du, R. R. Yue, F. F. Ren, Z. Q. Yao, F. X. Jiang, P. Yang and Y. Du, Novel Graphene Flowers Modified Carbon Fibers for Simultaneous Determination of Ascorbic Acid, Dopamine and Uric Acid, Biosens. Bioelectron., 2014, 53, 220–224 CrossRef CAS PubMed.
- S. Sainio, T. Palomäki, S. Rhode, M. Kauppila, O. Pitkänen, T. Selkälä, G. Toth, M. Moram, K. Kordas, J. Koskinen and T. Laurila, Carbon Nanotube (CNT) Forest Grown on Diamond-like Carbon (DLC) Thin Films Significantly Improves Electrochemical Sensitivity and Selectivity Towards Dopamine, Sens. Actuators, B, 2015, 211, 177–186 CrossRef CAS.
- S. Sainio, T. Palomäki, N. Tujunen, V. Protopopova, J. Koehne, K. Kordas, J. Koskinen, M. Meyyappan and T. Laurila, Integrated Carbon Nanostructures for Detection of Neurotransmitters, Mol. Neurobiol., 2015, 52, 859–866 CrossRef CAS PubMed.
- L. Sun, H. Li, M. Li, C. Li, P. Li and B. Yang, Simultaneous Determination of Ascorbic Acid, Dopamine, Uric Acid, Tryptophan, and Nitrite on a Novel Carbon Electrode, J. Electroanal. Chem., 2016, 783, 167–175 CrossRef CAS.
- Y. Wang, Y. Huang, B. Wang, T. Fang, J. Chen and C. Liang, Three-dimensional Porous Graphene for Simultaneous Detection of Dopamine and Uric Acid in the presence of Ascorbic Acid, J. Electroanal. Chem., 2016, 782, 76–83 CrossRef CAS.
- M. K. Dey and A. K. Satpati, Functionalised Carbon Nano Spheres Modified Electrode for Simultaneous Determination of Dopamine and Uric Acid, J. Electroanal. Chem., 2017, 787, 95–102 CrossRef CAS.
- N. Wester, S. Sainio, T. Palomäki, D. Nordlund, V. K. Singh, L. S. Johansson, J. Koskinen and T. Laurila, Partially Reduced Graphene Oxide Modified Tetrahedral Amorphous Carbon Thin-Film Electrodes as a Platform for Nanomolar Detection of Dopamine, J. Phys. Chem. C, 2017, 121, 8153–8164 Search PubMed.
- L. Amato, A. Heiskanen, C. Caviglia, F. Shah, K. Zór, M. Skolimowski, M. Madou, L. Gammelgaard, R. Hansen and E. G. Seiz, et al., Pyrolysed 3D-carbon Scaffolds Induce Spontaneous Differentiation of Human Neural Stem Cells and Facilitate Real-time Dopamine Detection, Adv. Funct. Mater., 2014, 24, 7042–7052 CrossRef CAS.
- S. Hemanth, C. Caviglia and S. S. Keller, Suspended 3D Pyrolytic Carbon Microelectrodes for Electrochemistry, Carbon, 2017, 121, 226–234 CrossRef CAS.
- Y. Lim, J. Heo and H. Shin, Fabrication and Application of a Stacked Carbon Electrode Set Including a Suspended Mesh Made of Nanowires and a Substrate-bound Planar Electrode Toward for an Electrochemical/Biosensor Platform, Sens. Actuators, B, 2014, 192, 796–803 CrossRef CAS.
- S. Hemanth, C. Caviglia, L. Amato, J. Aarøe Anhøj, A. Heiskanen, J. Emnéus and S. S. Keller, Pyrolytic 3D Carbon Microelectrodes forElectrochemistry, ECS Trans., 2016, 72, 117–124 CrossRef CAS.
- T. E. Benavidez, R. Martinez-Duarte and C. D. Garcia, Analytical Methodologies Using Carbon Substrates Developed by Pyrolysis, Anal. Methods, 2016, 8, 4163–4176 RSC.
- G. P. Keeley, N. McEvoy, S. Kumar, N. Peltekis, M. Mausser and G. S. Duesberg, Thin Film Pyrolytic Carbon Electrodes: A New Class of Carbon Electrode for Electroanalytical Sensing Applications, Electrochem. Commun., 2010, 12, 1034–1036 CrossRef CAS.
- Y. M. Hassan, C. Caviglia, S. Hemanth, D. M. A. Mackenzie, D. H. Petersen and S. S. Keller, Pyrolytic carbon microelectrodes for impedance based cell sensing, ECS Trans., 2016, 72, 35–44 CrossRef CAS.
- Y. M. Hassan, C. Caviglia, S. Hemanth, D. M. A. Mackenzie, T. S. Alstrøm, D. H. Petersen and S. S. Keller, High Temperature SU-8 Pyrolysis for Fabrication of Carbon Electrodes, J. Anal. Appl. Pyrolysis, 2017, 125, 91–99 CrossRef CAS.
- L. S. Johansson, J. M. Campbell, P. Fardim, A. H. Hultén, J. Boisvert and M. Ernstsson, An XPS Round Robin Investigation on Analysis of Wood Pulp Fibres and Filter Paper, Surf. Sci., 2005, 584, 126–132 CrossRef CAS.
- G. Beamson and D. Briggs, High resolution XPS of organic polymers, the scienta ESCA300database, Wiley, Chichester, UK, 1992 Search PubMed.
- F. Banhart, J. Kotakoski and A. V. Krasheninnikov, Structural Defects in Graphene, ACS Nano, 2010, 5, 26–41 CrossRef PubMed.
- G. Makov and M. Payne, Periodic Boundary Conditions in ab Initio Calculations, Phys. Rev. B: Condens. Matter Mater. Phys., 1995, 51, 4014 CrossRef CAS.
- J. Neugebauer and M. Scheffler, Adsorbate-substrate and Adsorbate-adsorbate Interactions of Na and K Adlayers on Al(111), Phys. Rev. B: Condens. Matter Mater. Phys., 1992, 46, 16067 CrossRef CAS.
- W. Kohn and L. J. Sham, Self-consistent Equations Including Exchange and Correlation Effects, Phys. Rev., 1965, 140, A1133 CrossRef.
- R. M. Martin, Electronic Structure: Basic Theory and Practical Methods, Cambridge University Press, Cambridge, UK, 2004 Search PubMed.
- J. P. Perdew, K. Burke and M. Ernzerhof, Generalized Gradient Approximation Made Simple, Phys. Rev. Lett., 1996, 77, 3865 CrossRef CAS PubMed.
- H. J. Monkhorst and J. D. Pack, Special Points for Brillouin-zone Integrations, Phys. Rev. B: Condens. Matter Mater. Phys., 1976, 13, 5188 CrossRef.
- A. Tkatchenko and M. Scheffler, Accurate Molecular van der Waals Interactions from Ground-State Electron Density and Free-atom Reference Data, Phys. Rev. Lett., 2009, 102, 073005 CrossRef PubMed.
- H. Xia, W. Li, Y. Song, X. Yang, X. Liu, M. Zhao, Y. Xia, C. Song, T. W. Wang and D. Zhu, et al., Tunable Magnetism in Carbon-Ion-Implanted Highly Oriented Pyrolytic Graphite, Adv. Mater., 2008, 20, 4679–4683 CrossRef CAS.
- V. M. Sánchez, M. Sued and D. A. Scherlis, First-principles Molecular Dynamics Simulations at Solid-liquid Interfaces with a Continuum Solvent, J. Chem. Phys., 2009, 131, 174108 CrossRef PubMed.
- W. Im, D. Beglov and B. Roux, Continuum Solvation Model: Computation of Electrostatic Forces from Numerical Solutions to the Poisson-Boltzmann Equation, Comput. Phys. Commun., 1998, 111, 59–75 CrossRef CAS.
- A. Held and M. Walter, Simplified Continuum Solvent Model with a Smooth Cavity Based on Volumetric Data, J. Chem. Phys., 2014, 141, 174108 CrossRef PubMed.
- A. Aarva, T. Laurila and M. A. Caro, Doping as a Means to Probe the Potential Dependence of Dopamine Adsorption on Carbon-based Surfaces: A First-principles Study, J. Chem. Phys., 2017, 146, 234704 CrossRef PubMed.
- R. L. McCreery, Advanced Carbon Electrode Materials for Molecular Electrochemistry, Chem. Rev., 2008, 108, 2646–2687 CrossRef CAS PubMed.
- L. Cançado, K. Takai, T. Enoki, M. Endo, A. Kim, H. Mizusaki, A. Jorio, L. N. Coelho, R. M. Magalhães-Paniago and A. Pimenta, General Equation for the Determination of the Crystallite Size L a of Nanographite by Raman Spectroscopy, Appl. Phys. Lett., 2006, 88, 163106 CrossRef.
- A. C. Ferrari and J. Robertson, Interpretation of Raman Spectra of Disordered and Amorphous Carbon, Phys. Rev. B: Condens. Matter Mater. Phys., 2000, 61, 14095 CrossRef CAS.
- S. Lee, J. Peng and C. Liu, Probing Plasma-induced Defect Formation and Oxidation in Carbon Nanotubes by Raman Dispersion Spectroscopy, Carbon, 2009, 47, 3488–3497 CrossRef CAS.
- J. Kim, X. Song, K. Kinoshita, M. Madou and R. White, Electrochemical Studies of Carbon Films from Pyrolyzed Photoresist, J. Electrochem. Soc., 1998, 145, 2314–2319 CrossRef CAS.
- S. Ranganathan, R. Mccreery, S. M. Majji and M. Madou, Photoresist-derived Carbon for Microelectromechanical Systems and Electrochemical Applications, J. Electrochem. Soc., 2000, 147, 277–282 CrossRef CAS.
- A. Singh, J. Jayaram, M. Madou and S. Akbar, Pyrolysis of Negative Photoresists to Fabricate Carbon Structures for Microelectromechanical Systems and Electrochemical Applications, J. Electrochem. Soc., 2002, 149, E78–E83 CrossRef CAS.
- S. H. Duvall and R. L. McCreery, Self-catalysis by Catechols and Quinones During Heterogeneous Electron Transfer at Carbon Electrodes, J. Am. Chem. Soc., 2000, 122, 6759–6764 CrossRef CAS.
- J. Zen and P. Chen, A Selective Voltammetric Method for Uric Acid and Dopamine Detection Using Clay-modified Electrodes, Anal. Chem., 1997, 69, 5087–5093 CrossRef CAS.
- R. M. Wightman, L. J. May and A. C. Michael, Detection of Dopamine Dynamics in the Brain, Anal. Chem., 1988, 60, 769–779 CrossRef.
- M. Hadi and A. Rouhollahi, Simultaneous Electrochemical Sensing of Ascorbic Acid, Dopamine and Uric Acid at Anodized Nanocrystalline Graphite-like Pyrolytic Carbon Film Electrode, Anal. Chim. Acta, 2012, 721, 55–60 CrossRef CAS PubMed.
- M. K. Zachek, P. Takmakov, B. Moody, R. M. Wightman and G. S. McCarty, Simultaneous Decoupled Detection of Dopamine and Oxygen Using Pyrolyzed Carbon Microarrays and Fast-Scan Cyclic Voltammetry, Anal. Chem., 2009, 81, 6258–6265 CrossRef CAS PubMed.
- Y. Lim, J. I. Heo and H. Shin, Fabrication and Application of a Stacked Carbon Electrode Set Including a Suspended Mesh Made of Nanowires and a Substrate-bound Planar Electrode Toward for an Electrochemical/biosensor Platform, Sens. Actuators, B, 2014, 192, 796–803 CrossRef CAS.
- M. Hupert, A. Muck, J. Wang, J. Stotter, Z. Cvackova, S. Haymond, Y. Show and G. M. Swain, Conductive Diamond Thin-films inElectrochemistry, Diamond Relat. Mater., 2003, 12, 1940–1949 CrossRef CAS.
- M. L. Heien, P. E. Phillips, G. D. Stuber, A. T. Seipel and R. M. Wightman, Overoxidation of Carbon-fiber Microelectrodes Enhances Dopamine Adsorption and Increases Sensitivity, Analyst, 2003, 128, 1413–1419 RSC.
- J. Zhao, J. P. Lu, J. Han and C. Yang, Noncovalent Functionalization of Carbon Nanotubes by Aromatic Organic Molecules, Appl. Phys. Lett., 2003, 82, 3746–3748 CrossRef CAS.
- R. M. Wightman, M. R. Deakin, P. M. Kovach, W. G. Kuhr and K. J. Stutts, Methods to Improve Electrochemical Reversibility at Carbon Electrodes, J. Electrochem. Soc., 1984, 131, 1578–1583 CrossRef CAS.
- A. W. Sternson, R. McCreery, B. Feinberg and R. N. Adams, Electrochemical Studies of Adrenergic Neurotransmitters and Related Compounds, J. Electroanal. Chem., 1973, 46, 313–321 CrossRef CAS.
- O. V. Tovchiga and S. Y. Shtrygol, S.Y. Uric Acid and Central Nervous System Functioning (a Literature Review), Biol. Bull. Rev., 2014, 4, 210–221 CrossRef.
- G. L. Bowman, J. Shannon, B. Frei, J. A. Kaye and J. F. Quinn, Uric Acid as a CNS Antioxidant, J. Alzheimer's Dis., 2010, 19, 1331–1336 CrossRef CAS PubMed.
Footnote |
| † http://https://wiki.fysik.dtu.dk/gpaw/ |
| This journal is © The Royal Society of Chemistry 2017 |