Biowaste-derived 3D honeycomb-like porous carbon with binary-heteroatom doping for high-performance flexible solid-state supercapacitors†
Yuxi
Liu
,
Zechuan
Xiao
,
Yongchang
Liu
and
Li-Zhen
Fan
 *
*
Institute of Advanced Materials and Technology, University of Science and Technology Beijing, Beijing 100083, China. E-mail: fanlizhen@ustb.edu.cn; Fax: +86-10-62334311; Tel: +86-10-62334311
First published on 22nd November 2017
Abstract
Corncob sponge is a type of agricultural abandoned byproduct and abundant around the world. Herein, a facile one-pot carbonization and activation method is developed to convert corncob sponge into three-dimensional (3D) interconnected honeycomb-like porous carbon, followed by an effective binary-heteroatom doping to fabricate nitrogen and sulfur co-doped activated corncob sponge (denoted as N,S-ACS). The resultant products possess a high accessible surface area (1874 m2 g−1) induced by the 3D honeycomb-like framework and a highly porous structure that benefits a large ion storage and a rapid ion transfer. In addition to the electrical double layer capacitance, heteroatom doping evokes faradic contribution. N,S-ACS demonstrates a remarkable specific capacitance of 404 and 253 F g−1 at the current densities of 0.1 and 10 A g−1 in a 6 mol L−1 KOH electrolyte, respectively, along with a high cycling stability with only 1% loss over 10![[thin space (1/6-em)]](https://www.rsc.org/images/entities/char_2009.gif) 000 cycles. Furthermore, the assembled symmetric flexible solid-state supercapacitors with the electrode of N,S-ACS and the electrolyte of a PVA/KOH gel display a high integrated energy–power density of 30 W h kg−1 at 8 kW kg−1 and a 99% capacitance retention after 10
000 cycles. Furthermore, the assembled symmetric flexible solid-state supercapacitors with the electrode of N,S-ACS and the electrolyte of a PVA/KOH gel display a high integrated energy–power density of 30 W h kg−1 at 8 kW kg−1 and a 99% capacitance retention after 10![[thin space (1/6-em)]](https://www.rsc.org/images/entities/char_2009.gif) 000 cycles at 3 A g−1. The fascinating performance significantly endows N,S-ACS with great prospects as a supercapacitor electrode.
000 cycles at 3 A g−1. The fascinating performance significantly endows N,S-ACS with great prospects as a supercapacitor electrode.
1. Introduction
Supercapacitors have attracted worldwide attention owing to their superior power delivery, fast charge/discharge rate, and long cycle life (105 cycles).1–4 However, supercapacitors suffer from a low energy density (4–10 W h kg−1),5,6 which would limit their further application in the areas where both energy and power are required such as in electric vehicles. Therefore, it is necessary to design electrode materials with a simultaneous improvement of energy and power densities.According to the equation E = 1/2CV2, the actual energy stored in the supercapacitor is proportional to its capacitance and the square of the operating voltage of the electrolytes.7 Both values are mainly determined by the specific surface area, pore structure, and the heteroatom doping effects of the electrode materials. Owing to the high specific surface area, adjustable porosity, moderate cost, and abundance of raw materials, activated carbons are widely employed as electrode materials for supercapacitors.8,9 However, most of the commercial porous active carbons usually exhibit low specific capacitances (<200 F g−1) and poor rate performance that limit their energy density (5–8 W h kg−1) and power density.10,11 It is of great significance to design an appropriate structure with a full or high utilization of the specific surface area. To achieve a highly accessible surface area, the key process is to develop hierarchically porous carbons with a rational distribution of interconnected macro, meso, and micropores. On the other hand, construction of three-dimensional (3D) scaffold frameworks of porous carbons is also vital, which can avoid overlapping-induced specific surface area loss and favor the ion diffusion by providing short pathways. Significant efforts have been devoted towards the fabrication of two kinds of activated carbon materials, but complicated and expensive synthesis with irritant or corrosive substances is often used.12–18
Recently, hierarchically porous carbons, such as macro/mesoporous graphene frameworks19–21 and porous graphene/carbon nanotube paper,22 have drawn significant research attention as electrodes for supercapacitors. Nevertheless, in terms of the economy and efficiency of preparation method, graphene materials cannot compete with direct pyrolysis of carbon precursors, such as biowaste23–25 or biomass.26–30 Corncob sponge is a type of agricultural abandoned byproduct and abundant around the world. To date, corncob is generally burnt, which not only wastes the resources but also leads to air pollution. Herein, we were surprised to find that it is an ideal carbon precursor for the synthesis of the value-added activated carbon through a one-pot carbonization and activation method.
Besides structural engineering, a proper surface functionality also helps to improve the performance of activated carbons. Recently, heteroatom (N, S, B, and P etc.) doping into carbon has been proven to be an efficient strategy to achieve a higher specific capacitance with the introduction of the extra surface redox reactions of pseudocapacitor behavior.31–34 Furthermore, the introduction of heteroatoms can decrease the charge transfer resistance and improve the wettability, thereby enhancing the capacitive performance. In view of the synergistic effect of binary-heteroatom doping in the fields of electrochemical energy storage/conversion (e.g. lithium ion batteries,35 sodium-ion batteries,36 and oxygen reduction reaction),37 N and S co-doping is considered as an achievable way to realize supercapacitor electrode materials with a high energy–power density. To date, only a few N and S co-doped materials have been identified. Therefore, it is paramount to explore the common characteristics and underlying rules of the doping mechanism.
In this study, we report a facile and cost-effective method to produce honeycomb-like porous carbon using biowaste corncob sponge as the precursor. After carbonization and activation, the as-prepared activated corncob sponge (ACS) with a high specific surface area and interconnected micro-meso-macropores subsequently undergoes N and S binary doping to form the nitrogen and sulfur co-doped activated corncob sponge (N,S-ACS). When used as an electrode for supercapacitors, the obtained N,S-ACS shows an outstanding electrochemical performance with a high specific capacitance of 404 and 253 F g−1 at the current densities of 0.1 and 10 A g−1 in a 6 mol L−1 KOH electrolyte, respectively. Moreover, the high cycling stability (1% loss over 10![[thin space (1/6-em)]](https://www.rsc.org/images/entities/char_2009.gif) 000 cycles) significantly endows the product with great supercapacitor application prospects. More impressively, the assembled symmetric flexible solid-state supercapacitors with the electrode of N,S-ACS in a gel electrolyte display a high integrated energy–power density of 30 W h kg−1 at 8000 W kg−1 and a 99% capacitance retention after 10
000 cycles) significantly endows the product with great supercapacitor application prospects. More impressively, the assembled symmetric flexible solid-state supercapacitors with the electrode of N,S-ACS in a gel electrolyte display a high integrated energy–power density of 30 W h kg−1 at 8000 W kg−1 and a 99% capacitance retention after 10![[thin space (1/6-em)]](https://www.rsc.org/images/entities/char_2009.gif) 000 cycles at 3 A g−1.
000 cycles at 3 A g−1.
2. Experimental
2.1 Synthesis of ACS
Corncob sponge was utilized as a precursor for the ACS preparation. Briefly, corncob sponge was washed with acetone and deionized water (DI water) and then dried at 120 °C for 12 hours. Subsequently, the corncob sponge (5.0 g) was mixed with a certain amount of KOH with the ratio of 1![[thin space (1/6-em)]](https://www.rsc.org/images/entities/char_2009.gif) :
:![[thin space (1/6-em)]](https://www.rsc.org/images/entities/char_2009.gif) 0, 1
0, 1![[thin space (1/6-em)]](https://www.rsc.org/images/entities/char_2009.gif) :
:![[thin space (1/6-em)]](https://www.rsc.org/images/entities/char_2009.gif) 1, 2
1, 2![[thin space (1/6-em)]](https://www.rsc.org/images/entities/char_2009.gif) :
:![[thin space (1/6-em)]](https://www.rsc.org/images/entities/char_2009.gif) 1, and 4
1, and 4![[thin space (1/6-em)]](https://www.rsc.org/images/entities/char_2009.gif) :
:![[thin space (1/6-em)]](https://www.rsc.org/images/entities/char_2009.gif) 1 (0, 5.0, 10.0, and 20.0 g) in DI water and then dried until all DI water was evaporated. The remnant mixture was pyrolyzed in a tubular furnace at 400 °C for 2 hours and then up to 850 °C for 1 hour at a heating rate of 5 °C min−1 under a N2 atmosphere. The resultant samples (ACS) were obtained by washing with DI water and drying at 90 °C overnight. Thus, the resultant carbon materials were obtained and denoted as CS, ACS1:1, ACS2:1, and ACS4:1.
1 (0, 5.0, 10.0, and 20.0 g) in DI water and then dried until all DI water was evaporated. The remnant mixture was pyrolyzed in a tubular furnace at 400 °C for 2 hours and then up to 850 °C for 1 hour at a heating rate of 5 °C min−1 under a N2 atmosphere. The resultant samples (ACS) were obtained by washing with DI water and drying at 90 °C overnight. Thus, the resultant carbon materials were obtained and denoted as CS, ACS1:1, ACS2:1, and ACS4:1.
2.2 Synthesis of N,S co-doped ACS
Thiourea (CN2H4S) was used as both a N and S source to synthesize the N,S-co-doped ACS. Typically, thiourea (4.0 g) and ACS2:1 (1.0 g) were mixed in DI water under vigorous stirring followed by drying at 90 °C overnight. Then, thermal treatment was performed at 800 °C for 1 h at a heating rate of 5 °C min−1 under a N2 atmosphere. The resulting sample (N,S-ACS2:1) was obtained by washing with DI water and drying at 90 °C. For comparison, the N-doped sample without S doping (N-ACS2:1) was prepared using urea (CO(NH2)2) as the N source with the same thermal history.2.3 Material characterization
The morphology and microstructure were characterized by field-emission scanning electron microscopy (FESEM, ZEISS supro55). The pore structure was determined through N2 adsorption/desorption isotherms at 77 K using an ASAP 2460 (Micromeritics) analyzer. The surface chemical species of the samples were revealed by X-ray photoelectron spectroscopy (XPS) with Al Kα radiation using a PHI-5300 instrument. Raman spectroscopy analysis was performed using HR800 (Horiba Jobin Yvon) with a 514.5 nm laser source.2.4 Electrochemical measurements
The electrochemical performance of the samples was determined in a three-electrode cell with the basic aqueous solutions. The working electrode was prepared by mixing the carbon samples and acetylene black with polytetrafluoroethylene (PTFE, used as a binder) in a weight ratio of 80![[thin space (1/6-em)]](https://www.rsc.org/images/entities/char_2009.gif) :
:![[thin space (1/6-em)]](https://www.rsc.org/images/entities/char_2009.gif) 15
15![[thin space (1/6-em)]](https://www.rsc.org/images/entities/char_2009.gif) :
:![[thin space (1/6-em)]](https://www.rsc.org/images/entities/char_2009.gif) 5, and then, the mixture was pressed onto a nickel foam. The mass loading of the working electrode was about 10.0 mg cm−2. For the three-electrode configuration, Pt and a Hg/HgO electrode were used as the counter and reference electrodes, respectively, whereas a KOH solution (6 mol L−1) was employed as the electrolyte. The electrochemical performance of N,S-ACS2:1 was further examined by a two-electrode device with a gel electrolyte. In a typical preparation, polyvinyl alcohol (PVA) powder (2 g) was dissolved in DI water (20 mL) under vigorous stirring at 85 °C until a stable PVA aqueous was formed. Then, two working electrodes with a separator in between were stacked and further immersed in the PVA aqueous solution, followed by addition of an excessive KOH aqueous solution (6 mol L−1). Finally, the PVA-based gel was settled for 24 h, allowing the formation of a robust flexible all-solid-state device. The galvanostatic charge/discharge curves were obtained at various current densities using LAND-CT2001A (Wuhan Jinnuo Electronics. Ltd.). Cyclic voltammetry (CV) at different scanning rates and electrochemical impedance spectroscopy (EIS) in the frequency range from 100 kHz to 0.1 Hz at the amplitude of 5 mV were carried out using a Solartron electrochemical workstation (1260 + 1287).
5, and then, the mixture was pressed onto a nickel foam. The mass loading of the working electrode was about 10.0 mg cm−2. For the three-electrode configuration, Pt and a Hg/HgO electrode were used as the counter and reference electrodes, respectively, whereas a KOH solution (6 mol L−1) was employed as the electrolyte. The electrochemical performance of N,S-ACS2:1 was further examined by a two-electrode device with a gel electrolyte. In a typical preparation, polyvinyl alcohol (PVA) powder (2 g) was dissolved in DI water (20 mL) under vigorous stirring at 85 °C until a stable PVA aqueous was formed. Then, two working electrodes with a separator in between were stacked and further immersed in the PVA aqueous solution, followed by addition of an excessive KOH aqueous solution (6 mol L−1). Finally, the PVA-based gel was settled for 24 h, allowing the formation of a robust flexible all-solid-state device. The galvanostatic charge/discharge curves were obtained at various current densities using LAND-CT2001A (Wuhan Jinnuo Electronics. Ltd.). Cyclic voltammetry (CV) at different scanning rates and electrochemical impedance spectroscopy (EIS) in the frequency range from 100 kHz to 0.1 Hz at the amplitude of 5 mV were carried out using a Solartron electrochemical workstation (1260 + 1287).
3. Results and discussion
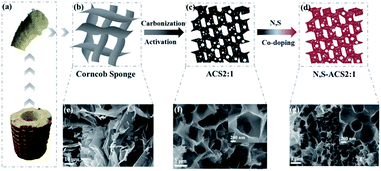
The 3D honeycomb-like N,S-ACS samples were prepared via facile one-pot carbonization and activation, followed by an effective binary-heteroatom doping method. Typically, a piece of corncob sponge was used as the raw material (Fig. 1a). The synthetic process is shown in Fig. 1b–d. At first, the corncob sponge was mixed with a KOH aqueous solution and heat-treated for carbonization and activation. Subsequently, the obtained ACS sample (Fig. 1c) was mixed with thiourea (N and S sources) and thermally treated under a N2 atmosphere. Finally, the resultant N,S-ACS sample (Fig. 1d) was achieved by washing with DI water and drying overnight.The corresponding morphology was examined by scanning electron microscopy (SEM), as shown in Fig. 1e–g. The SEM image of the CS without KOH activation suggests a typical 2D interconnected wrinkling graphene-like nanosheets (Fig. 1e). After KOH activation, ACS2:1 reveals a 3D interconnected honeycomb-like microstructure (Fig. 1f), which is a unique structure that can effectively prevent the nanosheets from restacking/agglomerating on a large scale. The activation mechanism of corncob sponge with KOH is described as 6KOH + 2C ↔ 2K + 3H2 + 2K2CO3, followed by the decomposition of K2CO3 and the reaction of K/K2CO3/CO2 with carbon.11 The thickness of the carbon wall is estimated in the range from 10 to 20 nm. With an increase in the addition amount of KOH, the carbon wall thickness of ACS gradually decreases. Noteworthily, due to the lack of adequate KOH activation (Fig. S1a†), only a small portion of corncob sponge turns into 3D porous carbon. At the ratios of KOH/corncob sponge ≥4 (Fig. S1b†), the carbon wall is too thin to hold the 3D frameworks; this leads to the collapse of partial sections. The 3D architecture of ACS2:1 with the interconnected macro, meso, and microporous structure will allow a full access of the electrolyte to the contact sites, shorten the distance of ion transport, and minimize the high-rate diffusional losses.38 Furthermore, ACS2:1 can be used as a scaffold for doping heteroatom to enhance the specific capacitance. After N and S binary doping, the sample N,S-ACS2:1 (Fig. 1g) was obtained. Note that the original honeycomb-like structure still does not change after the heteroatom doping; this can result in a good capacitance and high rate performance.
The porous structure of the obtained samples was analyzed by N2 adsorption/desorption at 77 K. The isotherm plots in Fig. 2a clearly show that the ACS samples have much higher N2 sorption capacities as compared to CS, which displays type I sorption isotherms, suggesting a microporous carbon nature. The steep increase in the N2 adsorption observed in a low-pressure region (P/P0 = 0–0.1) and the hysteresis loops indicate the presence of micropores and mesopores in the ACS samples. Just as the pore size distributions shown in Fig. 2b (calculated by density functional theory), all samples except CS have pore distribution peaks between 0.5 and 4 nm with a high density of micropores and mesopores. Moreover, the specific surface areas of the samples can be efficiently increased by KOH treatment (Table 1), and the porous characteristics are strongly dependent on the KOH contents. When the mass ratios of KOH to corncob sponge increase from 1![[thin space (1/6-em)]](https://www.rsc.org/images/entities/char_2009.gif) :
:![[thin space (1/6-em)]](https://www.rsc.org/images/entities/char_2009.gif) 1 to 2
1 to 2![[thin space (1/6-em)]](https://www.rsc.org/images/entities/char_2009.gif) :
:![[thin space (1/6-em)]](https://www.rsc.org/images/entities/char_2009.gif) 1, the surface area and the pore volume are enlarged from 1540 to 1909 m2 g−1 and 0.801 to 0.852 cm3 g−1, respectively. However, ACS4:1 presents a smaller surface area (1793 m2 g−1) than ACS2:1. This may be attributed to the structural collapse caused by over-etching and agrees with the SEM observations. Moreover, after single N-doping and N and S co-doping, the specific surface area and the pore volume of ACS2:1 change slightly. The N,S-ACS2:1 sample possesses a specific surface area of 1874 m2 g−1 and a pore volume of 0.945 cm3 g−1.
1, the surface area and the pore volume are enlarged from 1540 to 1909 m2 g−1 and 0.801 to 0.852 cm3 g−1, respectively. However, ACS4:1 presents a smaller surface area (1793 m2 g−1) than ACS2:1. This may be attributed to the structural collapse caused by over-etching and agrees with the SEM observations. Moreover, after single N-doping and N and S co-doping, the specific surface area and the pore volume of ACS2:1 change slightly. The N,S-ACS2:1 sample possesses a specific surface area of 1874 m2 g−1 and a pore volume of 0.945 cm3 g−1.
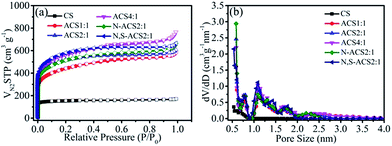 | ||
| Fig. 2 (a) N2 absorption–desorption isotherms and (b) pore size distribution of CS, ACS1:1, ACS2:1, ACS4:1, N-ACS2:1, and N,S-ACS2:1. | ||
| Samples | S total (m2 g−1) | S micro (m2 g−1) | S meso+macro (m2 g−1) | V total (cm3 g−1) | V micro (cm3 g−1) | V meso+macro (cm3 g−1) | APSc (nm) |
|---|---|---|---|---|---|---|---|
| a The surface areas for total (Stotal) and micropores (Smicro) were obtained from multipoint Brumauer–Emmett–Teller (BET) plots and V–t plots, respectively, and the surface area of the meso/macropores (Smeso+macro) was acquired by subtracting Smicro from Stotal. b The total pore volume (Vtotal) was determined at P/P0 = 0.99, and the micropore volume (Vmicro) was calculated from the V–t plot. The algorithm of meso/macropore (Vmeso+macro) was similar to that of Smeso+macro. c Average pore size (APS). | |||||||
| CS | 560 | 540 | 20 | 0.170 | 0.168 | 0.002 | 1.038 |
| ACS1:1 | 1540 | 780 | 760 | 0.801 | 0.563 | 0.238 | 2.080 |
| ACS2:1 | 1909 | 1209 | 700 | 0.852 | 0.701 | 0.151 | 1.784 |
| ACS4:1 | 1793 | 831 | 962 | 1.040 | 0.729 | 0.311 | 2.327 |
| N-ACS2:1 | 1827 | 1112 | 715 | 0.878 | 0.738 | 0.140 | 1.788 |
| N,S-ACS2:1 | 1874 | 1138 | 736 | 0.945 | 0.788 | 0.157 | 1.880 |
Raman analysis was also carried out to further evaluate the structural feature of the carbon samples (Fig. S2†). The D band (∼1350 cm−1) is attributed to the disordered structure induced by the defects and impurities, whereas the G band (∼1580 cm−1) is a characteristic of the graphitic layers. The intensity ratio of these two peaks partially depends on the degree of graphitization.39 It is noted that the ID/IG (0.88) of CS is relatively low, whereas the value of ACS2:1 is 0.98, indicating the increased defects with the KOH activation. Moreover, the enhanced ID/IG ratios of both N-ACS2:1 (1.03) and N,S-ACS2:1 (1.05) imply more degree of defect generation after the introduction of heteroatom; this confirms the successful doping of N and N,S into the samples, which has also been verified by the XPS spectra shown hereinafter.
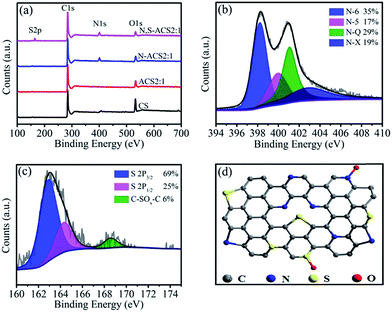
The XPS measurements were performed to gain insight into the chemical configurations of the CS, ACS2:1, N-ACS2:1, and N,S-ACS2:1 (Fig. 3a). Compared with the cases of CS and ACS2:1, we can clearly see the existence of N in N-ACS2:1 and N,S in N,S-ACS2:1 after heteroatom doping. The N and S contents of N,S-ACS2:1 determined by XPS are 5.11% and 2.86%, respectively, and the corresponding N 1s and S 2p spectra are shown in Fig. 3b and c. The high-resolution N 1s spectra can be primarily deconvoluted to four peaks: pyridinic-N (N-6, 398.2 eV, 35%), pyrrolic-N (N-5, 399.9 eV, 17%), quaternary-N (N-Q, 401.0 eV, 29%), and pyridine-N-oxide (N-X, 402.5 eV, 19%).40 The high-resolution S 2p spectra exhibit three peaks at the binding energies of 163.2 (69%), 164.3 (25%), and 168.6 (6%) eV.41 The former two dominated peaks can be assigned to the S 2p3/2 and S 2p1/2 peaks for the –C–S–C– covalent bond, and the small peak corresponds to the C–SOx–C bond formed by the oxidation of a small part of –C–S–C–. All these results prove that the S atoms are successfully doped into N,S-ACS2:1. Fig. 3d shows the possible locations for N and S incorporated into the carbon network. The contribution of binary-heteroatom doping to improve the supercapacitor performance is summarized. At first, N-6 and N-5 could create the defects to provide more open channels and active sites, as well as induce pseudocapacitance. On the other hand, N-Q can enhance electron transfer during the charge–discharge process.42,43 Moreover, owing to the synergistic activation of conjugated carbon in combination with the electron-rich element S, more electron density is located on the surface of N,S-ACS2:1. Furthermore, the introduction of the dopant S provides more polarized surface as well as reversible pseudo-sites, resulting in a superior electrochemical performance.44
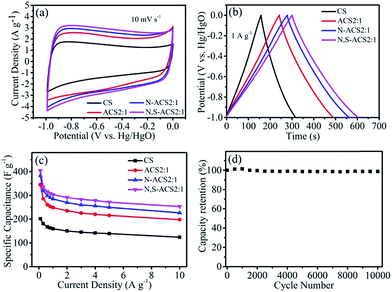
Based on the typical 3D porous honeycomb-like carbon nanostructures, high specific surface area, and rich nitrogen- and sulfur-containing functional groups, N,S-ACS2:1 is expected to be an excellent electrode material for supercapacitors. The electrochemical performances of the ACS2:1, N-ACS2:1, N,S-ACS2:1, and CS electrodes were first investigated by cyclic voltammetry (CV), galvanostatic charge/discharge, and electrochemical impedance spectroscopy (EIS) in a three-electrode system with a 6.0 mol L−1 KOH electrolyte. As shown in Fig. 4a, the samples present the rectangle-like CV curves at a scan rate of 10 mV s−1, indicating ideal double-layer capacitor and pseudocapacitor behaviors. At a low scan rate of 1 mV s−1, the CV curve of N,S-ACS2:1 displays clear faradaic humps (Fig. S3†), suggesting capacity contribution from the redox reaction. Compared with CS, the ACS2:1 electrode apparently possesses a much larger area, suggesting an increased electrochemical performance. On the basis of activation and heteroatom doping, the N-ACS2:1 and N,S-ACS2:1 display a much larger area with an enhanced energy storage capability owing to the interconnected porous honeycomb-like structure and the effective heteroatom doping, especially N and S binary doping. The possible role of S in the redox faradic reactions is illustrated in the eqn (1) and (2).44
| –SO2− + 2e− + H2O ⇌ –SO− + 2OH− | (1) |
| –SO− + e− + H2O ⇌ –S(OH)− + OH− | (2) |
The oxygen heteroatom can also contribute to the pseudo-capacitance and improve the wettability between electrode materials and electrolytes.45 As seen in Fig. 4b, the galvanostatic charge–discharge profiles illustrate almost isosceles triangles at the current density of 1 A g−1, implying a low equivalent series resistance and a great electrochemical reversibility.46 In addition, the low electrical resistance (∼0.18 ohm) is confirmed by the EIS spectra, as shown in Fig. S4.†
The specific capacitance (Fig. 4c) can be calculated from the discharge curves according to the equation Cs = I × t/V/m,47 where Cs (F g−1) is the specific capacity, I (A g−1) is the response current density, t (s) is the discharge time, V (V) is the potential, and m (g) is the mass of active materials. Owing to the high specific surface area, the well-developed porous structure, and the effective N and S binary doping, the N,S-ACS2:1 shows the highest specific capacitances of 404, 304, and 253 F g−1 at the current densities of 0.1, 1, and 10 A g−1, respectively, in agreement with the CV and charge/discharge characterization results (Fig. 4a and b). These values are much higher than those obtained with CS (201, 159, and 124 F g−1 at 0.1, 1, and 10 A g−1, respectively), ACS2:1 (345, 248, and 198 F g−1 at 0.1, 1, and 10 A g−1, respectively), and N-ACS2:1 (383, 285, and 226 F g−1 at 0.1, 1, and 10 A g−1, respectively). Furthermore, compared with other biomass/biowaste-derived previously reported carbon as supercapacitor electrodes, N,S-ACS2:1 is very competitive, as shown in Table S1.† In addition, the N,S-ACS2:1 electrode displays a negligible capacitance degradation and retains a high retention of 99% after 10![[thin space (1/6-em)]](https://www.rsc.org/images/entities/char_2009.gif) 000 cycles at a current density of 3 A g−1, demonstrating an excellent long-term cycling stability (Fig. 4d). Additionally, the electrochemical performance of the ACS1:1 and ACS4:1 was investigated, and the results are shown in Fig. S5,† showing a worse performance as compared to ACS2:1, N-ACS2:1, and N,S-ACS2:1.
000 cycles at a current density of 3 A g−1, demonstrating an excellent long-term cycling stability (Fig. 4d). Additionally, the electrochemical performance of the ACS1:1 and ACS4:1 was investigated, and the results are shown in Fig. S5,† showing a worse performance as compared to ACS2:1, N-ACS2:1, and N,S-ACS2:1.
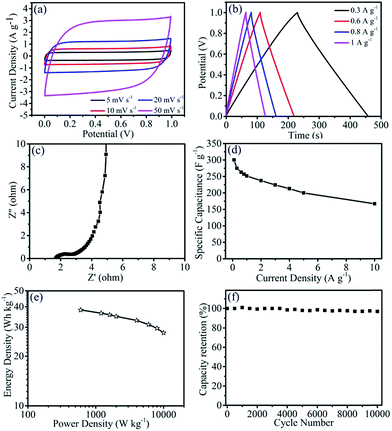
Herein, two-electrode symmetrical solid-state supercapacitors (Fig. S6†) have also been assembled to examine the electrochemical performance of N,S-ACS2:1 in the PVA/KOH gel electrolyte. As shown in Fig. 5a, the CV curves of the solid-state supercapacitor with N,S-ACS2:1 at the scan rates varying from 5 to 50 mV s−1 exhibit quasi-rectangular shapes with no obvious distortion, which indicate a typical double-layer capacitive behavior. In addition, the galvanostatic charge/discharge voltage profiles of the N,S-ACS2:1 (Fig. 5b) display symmetrically linear forms with no distinct voltage drop presented, indicating a low equivalent series resistance and a good electrochemical reversibility. As shown in the EIS (Fig. 5c), the Nyquist plot of the devices suggests a small impedance (∼1.1 ohm) with a vertical line in the low-frequency region, suggesting the fast ionic transport in the solid-state PVA/KOH gel electrolyte. The specific capacitance of the two-electrode device was calculated by the equation of Cs = 2I × t/V/m,48 where m is the mass of the N,S-ACS2:1 in one electrode. As shown in Fig. 5d, the specific capacitance can reach 300 F g−1 at the current density of 0.1 A g−1. In addition, the specific energy density (E) and the power density (P) of one electrode in the supercapacitor estimated according to the relations of E = Csc × V2/7.2 (W h kg−1) and P = E × 3600/t (W kg−1) are shown in Fig. 5e,48 indicating a high energy density of 30 W h kg−1 at a power density of 8000 W kg−1. More impressively, the N,S-ACS2:1 symmetric solid-state supercapacitor exhibits a 99% retention of its initial capacitance over 10![[thin space (1/6-em)]](https://www.rsc.org/images/entities/char_2009.gif) 000 cycles at a current density of 3 A g−1, verifying the long-term cyclic stability (Fig. 5f).
000 cycles at a current density of 3 A g−1, verifying the long-term cyclic stability (Fig. 5f).
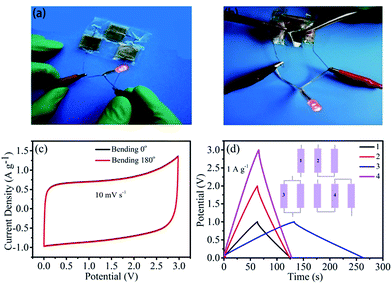
To meet the practical application requirements for modern wearable and portable energy storage devices, we further investigated the characteristics of the flexibility and working window. As shown in Fig. 6a, three flexible solid-state supercapacitors with the N,S-ACS2:1 electrode were assembled in series within a voltage window of 0–3 V, which lit a red LED lamp. Subsequently, the device was mechanically bent in 180° with no change in the glowing LED lamp (Fig. 6b); this indicated an excellent flexibility and stability. The CV curves at 10 mV s−1 also manifest the abovementioned result (Fig. 6c), showing almost no distortion before and after bending. In addition, to realize various working windows and prolonged discharging time, the devices were assembled by the series/parallel connection, as shown in the inset of Fig. 6d, and the corresponding charge/discharge profiles are given in Fig. 6d. At the same current density, it can be seen that the operating voltage of three devices in series is about three times that of a single device; on the other hand, the discharge time of two devices in parallel is about two times that of a single device. The abovementioned results suggest that this flexible solid-state supercapacitor can work at different potential windows and play an important role in the future electronic application.
4. Conclusion
In summary, a unique 3D honeycomb-like porous carbon with a large specific surface area was prepared by a one-step carbonization and activation method using corncob sponge as a carbon precursor. Followed by a novel nitrogen and sulfur binary doping, N,S-co-doped carbon was obtained with more open ionic channels and active sites, which further improved the electrochemical performance. As expected, the electrode of N,S-ACS2:1 delivered a high specific capacitance of 404 F g−1 at 0.1 A g−1. In addition, the assembled symmetric flexible solid-state supercapacitor exhibited a high energy density (30 W h kg−1) and a power density (8000 W kg−1), as well as a good cycling stability of a 99% capacitance retention after 10![[thin space (1/6-em)]](https://www.rsc.org/images/entities/char_2009.gif) 000 cycles in a PVA/KOH gel electrolyte. These promising results reveal that the facile and cost-effective synthesis strategy for the production of the carbon electrode materials would open up a new direction in commercial supercapacitors for large-scale energy storage applications.
000 cycles in a PVA/KOH gel electrolyte. These promising results reveal that the facile and cost-effective synthesis strategy for the production of the carbon electrode materials would open up a new direction in commercial supercapacitors for large-scale energy storage applications.
Conflicts of interest
There are no conflicts to declare.Acknowledgements
This work was supported by the Natural Scientific Foundation of China (51532002, 51372022 and 51575030) and National Basic Research Program of China (2015CB932500).References
- J. R. Miller and P. Simon, Science, 2008, 321, 651–652 CrossRef CAS PubMed.
- L. Hao, X. Li and L. Zhi, Adv. Mater., 2013, 25, 3899–3904 CrossRef CAS PubMed.
- J. Yan, Q. Wang, T. Wei and Z. Fan, Adv. Energy Mater., 2014, 4, 1300816 CrossRef.
- L. Yu, B. Y. Guan, W. Xiao and X. W. Lou, Adv. Energy Mater., 2015, 5, 1500981 CrossRef.
- L. Sun, C. Tian, Y. Fu, Y. Yang, J. Yin, L. Wang and H. Fu, Chem.–Eur. J., 2014, 20, 564–574 CrossRef CAS PubMed.
- Z. S. Wu, K. Parvez, X. L. Feng and K. Mullen, Nat. Commun., 2013, 4, 2487 Search PubMed.
- L. Zhao, L. Z. Fan, M. Q. Zhou, H. Guan, S. Qiao, M. Antonietti and M. M. Titirici, Adv. Mater., 2010, 22, 5202 CrossRef CAS PubMed.
- W. Zhang, H. Lin, Z. Lin, J. Yin, H. Lu, D. Liu and M. Zhao, ChemSusChem, 2015, 8, 2114–2122 CrossRef CAS PubMed.
- J. Wang and Q. Liu, RSC Adv., 2015, 5, 4396–4403 RSC.
- Z. S. Wu, W. Ren, D. W. Wang, F. Li, B. Liu and H. M. Cheng, ACS Nano, 2010, 4, 5835–5842 CrossRef CAS PubMed.
- P. Yu, Z. Zhang, L. Zheng, F. Teng, L. Hu and X. Fang, Adv. Energy Mater., 2016, 6, 1601111 CrossRef.
- L. Qie, W. Chen, H. Xu, X. Xiong, Y. Jiang, F. Zou, X. Hu, Y. Xin, Z. Zhang and Y. Huang, Energy Environ. Sci., 2013, 6, 2497–2504 Search PubMed.
- S. S. Zheng, H. Ju and X. Lu, Adv. Energy Mater., 2015, 5, 1500871 CrossRef.
- J. Hou, C. Cao, F. Idrees and X. Ma, ACS Nano, 2015, 9, 2556–2564 CrossRef CAS PubMed.
- X. Zheng, J. Luo, W. Lv, D. W. Wang and Q. H. Yang, Adv. Mater., 2015, 27, 5388–5395 CrossRef CAS PubMed.
- J. Huang, J. Wang, C. Wang, H. Zhang, C. Lu and J. Wang, Chem. Mater., 2015, 27, 2107–2113 CrossRef CAS.
- P. Hao, Z. Zhao, J. Tian, H. Li, Y. Sang, G. Yu, H. Cai, H. Liu, C. P. Wong and A. Umar, Nanoscale, 2014, 6, 12120–12129 RSC.
- X. M. Fan, C. Yu, J. Yang, Z. Ling, C. Hu, M. D. Zhang and J. S. Qiu, Adv. Energy Mater., 2014, 5, 1401761 CrossRef.
- H. F. Ju, W. L. Song and L. Z. Fan, J. Mater. Chem. A, 2014, 2, 10895 CAS.
- L. L. Zhang, X. Zhao, M. D. Stoller, Y. Zhu, H. Ji, S. Murali, Y. Wu, S. Perales, B. Clevenger and R. S. Ruoff, Nano Lett., 2012, 12, 1806–1812 CrossRef CAS PubMed.
- S. C. Han, L. F. Hu, Z. Q. Liang, S. Wageh, A. A. Al-Ghamdi, Y. S. Chen and X. S. Fang, Adv. Funct. Mater., 2014, 24, 5719–5727 CrossRef CAS.
- W. Fan, Y.-E. Miao, L. Zhang, Y. Huang and T. Liu, RSC Adv., 2015, 5, 31064–31073 RSC.
- Z. Li, L. Zhang, B. S. Amirkhiz, X. Tan, Z. Xu, H. Wang, B. C. Olsen, C. Holt and D. Mitlin, Adv. Energy Mater., 2012, 2, 431–437 CrossRef CAS.
- B. Xu, S. Hou, G. Cao, F. Wu and Y. Yang, J. Mater. Chem., 2012, 22, 19088–19093 RSC.
- M. Lee, G.-P. Kim, H. D. Song, S. Park and J. Yi, Nanotechnology, 2014, 25, 345601 CrossRef PubMed.
- X. Liu, M. Zheng, Y. Xiao, Y. Yang, L. Yang, Y. Liu, B. Lei, H. Dong, H. Zhang and H. Fu, ACS Appl. Mater. Interfaces, 2013, 5, 4667–4677 CAS.
- A. Ganesan, R. Mukherjee, J. Raj and M. M. Shaijumon, J. Porous Mater., 2014, 21, 839–847 CrossRef CAS.
- S. Hu, S. Zhang, N. Pan and Y.-L. Hsieh, J. Power Sources, 2014, 270, 106–112 CrossRef CAS.
- C. Bommier, R. Xu, W. Wang, X. Wang, D. Wen, J. Lu and X. Ji, Nano Energy, 2015, 11, 600–610 CrossRef.
- M. Sevilla, W. Gu, C. Falco, M. Titirici, A. Fuertes and G. Yushin, J. Power Sources, 2014, 267, 26–32 CrossRef CAS.
- W. Tian, Q. Gao, L. Zhang, C. Yang, Z. Li, Y. Tian, W. Qian and H. Zhang, J. Mater. Chem. A, 2016, 4, 8690–8699 CAS.
- K. N. Wood, R. O'Hayre and S. Pylypenko, Energy Environ. Sci., 2014, 7, 1212–1249 CAS.
- Z. Li, L. Zhang, B. S. Amirkhiz, X. Tan, Z. Xu, H. Wang, B. C. Olsen, C. M. B. Holt and D. Mitlin, Adv. Energy Mater., 2012, 2, 431–437 CrossRef CAS.
- X. Yu and H. S. Park, Carbon, 2014, 77, 59–65 CrossRef CAS.
- W. Ai, Z. Luo, J. Jiang, J. Zhu, Z. Du, Z. Fan, L. Xie, H. Zhang, W. Huang and T. Yu, Adv. Mater., 2014, 26, 6186–6192 CrossRef CAS PubMed.
- D. Xu, C. Chen, J. Xie, B. Zhang, L. Miao, J. Cai, Y. Huang and L. Zhang, Adv. Energy Mater., 2016, 6, 1501929 CrossRef.
- F. Razmjooei, K. P. Singh, M. Y. Song and J. S. Yu, Carbon, 2014, 78, 257–267 CrossRef CAS.
- J. Ding, H. L. Wang, Z. Li, K. Cui, D. Karpuzov, X. H. Tan, A. Kohandehghan and D. Mitlin, Energy Environ. Sci., 2015, 8, 941–955 CAS.
- M. H. Naveen, K. Shim, M. S. Hossain, J. H. Kim and Y. B. Shim, Adv. Energy Mater., 2017, 7, 1602002 CrossRef.
- B. Duan, X. Gao, X. Yao, Y. Fang, L. Huang, J. Zhou and L. Zhang, Nano Energy, 2016, 27, 482–491 CrossRef CAS.
- W. Li, M. Zhou, H. Li, K. Wang, S. Cheng and K. Jiang, Energy Environ. Sci., 2015, 8, 2916–2921 CAS.
- L. Jiang, L. Sheng, X. Chen, T. Wei and Z. Fan, J. Mater. Chem. A, 2016, 4, 11388–11396 CAS.
- L. Sun, L. Wang, C. Tian, T. Tan, Y. Xie, K. Shi, M. Li and H. Fu, RSC Adv., 2012, 2, 4498–4506 RSC.
- X. Zhao, Q. Zhang, C. M. Chen, B. Zhang, S. Reiche, A. Wang, T. Zhang, R. Schlögl and D. S. Su, Nano Energy, 2012, 1, 624–630 CrossRef CAS.
- L. Hao, X. Li and L. Zhi, Adv. Mater., 2013, 25, 3899–3904 CrossRef CAS PubMed.
- H. Wang, Z. Xu, A. Kohandehghan, Z. Li, K. Cui, X. Tan, T. J. Stephenson, C. K. King’ondu, C. M. Holt, B. C. Olsen, J. K. Tak, D. Harfield, A. O. Anyia and D. Mitlin, ACS Nano, 2013, 7, 5131–5141 CrossRef CAS PubMed.
- R. Raccichini, A. Varzi, S. Passerni and B. Scrosati, Nat. Mater., 2015, 14, 271–279 CrossRef CAS PubMed.
- Y. M. Fan, W. L. Song, X. Li and L. Z. Fan, Carbon, 2017, 111, 658–666 CrossRef CAS.
Footnote |
| † Electronic supplementary information (ESI) available. See DOI: 10.1039/c7ta09055b |
| This journal is © The Royal Society of Chemistry 2018 |

