
From anti-perovskite to double anti-perovskite: tuning lattice chemistry to achieve super-fast Li+ transport in cubic solid lithium halogen–chalcogenides†
Zhuo
Wang
 ab,
Hongjie
Xu
ab,
Minjie
Xuan
ab and
Guosheng
Shao
*ab
ab,
Hongjie
Xu
ab,
Minjie
Xuan
ab and
Guosheng
Shao
*ab
aState Center for International Cooperation on Designer Low-carbon & Environmental Materials (CDLCEM), Zhengzhou University, 100 Kexue Avenue, Zhengzhou 450001, China. E-mail: gsshao@zzu.edu.cn
bZhengzhou Materials Genome Institute (ZMGI), Zhongyuanzhigu, Xingyang 450100, China
First published on 6th November 2017
Abstract
Using a materials genome approach on the basis of density functional theory, we have formulated a new class of inorganic electrolytes for the fast diffusion of Li+ ions by fine-tuning the lattice chemistry of anti-perovskite structures. Systematic modelling was carried out to determine the structural stability and ion transport characteristics in Li3AX-based cubic anti-perovskites by alloying on the chalcogen lattice site (A) and alternative occupancy of the halogen site (X). In addition to identifying effective ways of reducing diffusion barriers for Li+ ions in anti-perovskite phases via the suitable designation of lattice occupancy, the current theoretical study has led to the discovery and synthesis of a new phase with a double-anti-perovskite structure, Li6OSI2 (or Li3O0.5S0.5I). This new compound has a fairly low activation barrier for Li+ diffusion, together with a wide energy band gap to hinder the conduction of electrons.
Introduction
Solid-state electrolytes (SSE) for lithium-ion batteries (LIB) have attracted significant attention due to their advantage of highly superior safety as compared to organic liquid ionic conductors and their great potential in offering improved electrochemical capacity with the lithium anode.1–4 The extensive substitution of SSE for liquid organic electrolytes is yet desired, unless related technologies are further improved to meet the following key criteria: (a) high Li+ ionic conductivity, greater than 1 mS cm−1 (the current technical requirement for liquid organic electrolytes); (b) low electric conductivity to avoid self-discharging in service; (c) broad working temperature for stable operation from −100 to 300 °C; (d) being electrochemically compatible with lithium anode;5 and (e) being light, economical, and environmentally friendly.As a landmark breakthrough, a new family of SSEs based on multi-component sulfides has been shown to provide significantly increased ionic conductivity, making them potential candidates as fast ion conductors for solid lithium-ion batteries. The discovery of Li10GeP2S12 (LGPS),6,7 with high bulk Li+ ion conductivity of over 10 mS cm−1 at room temperature, demonstrated for the first time that Li+ ionic conductivity in solid electrolytes could be superior to that in organic liquid electrolytes. The efficient conduction pathway for Li+ was along the longer c-axis of the tetragonal phase of Li10GeP2S12, with an activation barrier of 0.22–0.25 eV for Li+ diffusion.6,7 The motivation for replacing the expensive Ge content led to the discovery of a cheaper candidate, Li9.54Si1.74P1.44S11.7Cl0.3,8,9 which exhibited an even higher ionic conductivity of about 25 mS cm−1 at room temperature. However, this latter electrolyte was shown not to be electrochemically stable with the lithium anode, and this is considered an issue that limits the full potential of the lithium metal anode, which has the highest energy density (3860 mA h g−1) and lowest potential (−3.4 V vs. standard hydrogen electrode).10
Indeed, interface-related problems are still major hurdles hindering the progress in the development of all-solid-state LIBs.10–12 Although SSE are electrochemically stable at the anode Li/SSE interface,10,11 an adequate concentration difference in Li+ ions across the SSE/cathode interface is desired, since it helps to overcome the interfacial resistance and thus facilitates Li+ diffusing into the cathode materials.12 It is therefore important to develop various alternative SSEs that are able to accommodate higher concentrations of Li+ while offering adequate electrochemical voltage windows for improved stability.
Recently, lithium-rich compounds with the anti-perovskite structure, Li3OX (X = Cl, Br, etc.), were synthesized.13,14 The Li3OX crystal contains Li6O+4 octahedral units that are connected via all six vertices to form a three-dimensional framework with a negative monovalent halogen anion X− sitting at the center.14 This has been considered a promising alternative to SSE,15–17 since it (a) exhibits good thermodynamic and electrochemical stability; (b) is compatible with lithium metal anode; (c) has a large band gap to hinder electric conduction; and (d) has Li+ ions occupying 60% of the atomic positions in Li3OCl with each Li+ having abundant nearest Li+ sites. Also, its cubic structure offers the further advantage of permitting three-dimensionally equivalent diffusion of Li+ ions. The experimentally measured Li+ conductivities for Li3OX were, however, rather scattered. For example, the anti-perovskite Li3OCl films deposited by pulsed laser deposition (PLD)15,16 showed ionic conductivity of 0.2 mS cm−1 with an activation energy Ea = 0.35 eV. Work was also carried out to synthesize Li3OCl by heating at 360 °C under vacuum for several days.17 The measured Li+ ionic conductivity for the latter was 0.85 mS cm−1 together with an activation energy of 0.26 eV at room temperature.
Some theoretical efforts were made to account for the scattered experimental data from the Li3OX alloys of interest.18–20 It was suggested that there are two avenues for Li+ diffusion in Li3OCl, either by vacancy18–20 or interstitial Li+.20 The first was realized by Li+ migration into a neighboring vacant site of its kind. The activation energy along this pathway was determined to be in the range from 0.31 to 0.37 eV, by the nudged elastic band (NEB) method or from ab initio molecular dynamics (AIMD) simulation.18–20 Such theoretically predicted activation energies are in good agreement with the experimentally measured value of 0.35 eV.15,16 The second mechanism was fulfilled via migrating an interstitial Li+ to a neighboring site of its kind through an interstitial channel in the form of a dumbbell-like pathway. It was suggested that such an interstitial pathway would enable ultrafast Li+ diffusion channels with activation energies in the range from 0.145 to 0.175 eV.20 This indicated that moderate variation of Li+ concentration in the SSE could have a significant impact on the Li+ transportation. The ionic conductivity achieved in Li3OCl was still, however, far inferior to that of the LGPS family (0.85 vs. 10 mS cm−1). Subsequent experimental work showed that slight deviation from the standard Li3OCl stoichiometry resulted in a glassy Li2.99Ba0.005O1+xCl1−2x alloy with significantly improved ionic transport properties, with Li+ conductivity (σ) being over 10 mS cm−1 and a negligible activation energy of 0.06 eV.21 It was postulated that the significant improvement in performance was because of the absence of an anode-electrolyte interphase (AEI, similar to SEI in liquid electrolytes), with a glassy type of electrolyte discouraging nucleation of AEI crystals.
To date, systematic theoretical efforts are desirable to guide materials designed for ultrafast Li+ conductivity, via the fine-tuning of alloy chemistry within the anti-perovskite structure. The Li3OCl phase tends to decompose into more stable LiCl and Li2O phases at service temperatures of interest for LIBs.22,23 Since the Li2O phase is a rather poor ionic conductor, it would be useful in examining the feasibility of the substitution of O by other chalcogen elements such as S. It is recognized that Li2S is a much better ionic conductor, than Li2O.24–26
Herein, we aim to identify effective ways for radical reduction of diffusion barriers to Li+ ions in anti-perovskite phases Li3AX (chalcogen A, halogen X), through either slight deviation from the standard stoichiometry of the tri-lithium halogen–chalcogenides, or by variation of the lattice chemistry associated with the A and X sites. We show that low activation energy for Li+ diffusion can be achieved with the combined effect of Li and A enrichment and X deficiency. A new double anti-perovskite compound with the stoichiometry of Li6OSI2 is identified theoretically and is then successfully synthesized. Such a double anti-perovskite phase is thermodynamically stable, with ionic conductivity rivalling that of the well-known LGPS sulfide. The outcome of this work is expected to open a new avenue in the synthesis of novel Li-rich halogen–chalcogenide SSE suitable for all-solid LIBs.
Method
Theoretical calculations were performed using the Vienna Ab Initio Simulation Package (VASP),28,29 with the ionic potentials including the effect of core electrons being described by the projector augmented wave (PAW) method.30,31 In this work, the Perdew–Burke–Ernzerhof (PBE) GGA exchange–correlation (XC) functionals32,33 are used to study the structural stabilities in the Li3AX family. For the geometric relaxation of the structures, summation over the Brillouin Zone (BZ) is performed with 3 × 3 × 3 and 5 × 5 × 5 Monkhorst–Pack k-point mesh for the conventional and primitive cells, respectively. A plane-wave energy cutoff of 600 eV was used in all calculations. All structures were geometrically relaxed until the total force on each ion was reduced below 0.01 eV Å−1. For the calculations of electronic energy band structures, we used the HSE06 functional to predict more accurate values of band gaps.34,35 We employed a convergence criterion of 10−6 eV, suitable for electronic self-consistent cycles.The climb image nudged elastic band (CI-NEB) method with the limited-memory Broyden–Fletcher–Goldfarb–Shanno (LBFGS) optimizer36,37 was used to search the Li+ diffusion channel in the electrolytes of interest. The initial and final configurations were obtained after full structural relaxation. The number of inserted images used in the CI-NEB calculations depends on the reaction coordinates between the initial and final configurations. This method is useful not only in estimating the activation barrier, but also in locating the bottleneck along the Li+ transporting pathway.
We also carried out ab initio molecular dynamics (AIMD) simulations using system units containing 40 atoms and a 2 fs time step in the NVT ensembles with a constant volume and with a Nosé–Hoover thermostat, as a complimentary approach to the CI-NEB method for deriving full diffusion coefficient while checking the activation energy from the statistical point of view.18 Each AIMD simulation lasted for 80 ps after a 10 ps pre-equilibrium run. In order to shorten the simulation time, elevated temperatures from 750 K up to 2000 K were applied to speed up the ion-hopping process.
The universal structure predictor (USPEX)38,39 based on energy minimization was employed to predict stable or metastable structures for any given composition. For each composition, a population of 200 possible structures was randomly created with varied symmetries in the first generation. When the full structure relaxation was reached, the most stable and metastable structures, through the comparison of enthalpy of formation, were placed into the next generation. Afterwards, each subsequent generation would be created through heredity, with lattice mutation and permutation operators being applied and assessed energetically for the selection of a population of 60 for next run. USPEX would continue screening the structures until the most stable configuration remained unchanged for a further 20 generations to safeguard the global equilibrium.
The phonon frequency spectrum of a theoretically predicted structure was used for examining its dynamical stability. The super-cell method in the PHONOPY package40,41 was employed to perform the relevant frozen-phonon calculations based on harmonic approximation. The supercells of relaxed structures were used for the phonon calculations. The stability criterion is that the amplitude of imaginary frequency is less than 0.3 THz,42,43 to accommodate acceptable numerical errors in phonon calculations.
The energy (enthalpy) of formation for each LiaObScId compound was defined with respect to the chemical potentials of constituent elements as
| Ef = (Ecomp − aμLi − bμO − cμS − dμI)/(a + b + c + d), |
Results and discussion
Global search for low-energy structure configurations
We started by identifying the stable/metastable structures in each Li3AX phase through the isovalent replacement of either the chalcogen A site or the halogen X site, using the USPEX method for global energy minimization of each chemical configuration.38,39 Such a theoretical approach is particularly useful when little is known about phase structures in a new material system to be formulated, so that potential phase structures can be predicted with associated properties simulated at 0 K. Table 1 summarizes the USPEX search results for stable structures with geometrically relaxed lattice parameters for compositions covering Li3OCl, Li3OI, and Li6OSI2, which have thermodynamically preferred structures based on the anti-perovskite phase (Pm![[3 with combining macron]](https://www.rsc.org/images/entities/char_0033_0304.gif) m). It is worth noting that complete substitution of Cl with I in the Li3OCl perovskite phase leads to some moderate increases in lattice parameters. Complete replacement of O by S in the Li3OI phase, on the other hand, gives rise to significant increases in lattice parameters together with considerable lattice distortion of the perovskite symmetry. It is amazing to note that the stable structure gains higher symmetry when half of the O site is replaced by S, with Li6OSI2 having a face-centered cubic space group (Fmm) instead of a primitive cubic structure.
m). It is worth noting that complete substitution of Cl with I in the Li3OCl perovskite phase leads to some moderate increases in lattice parameters. Complete replacement of O by S in the Li3OI phase, on the other hand, gives rise to significant increases in lattice parameters together with considerable lattice distortion of the perovskite symmetry. It is amazing to note that the stable structure gains higher symmetry when half of the O site is replaced by S, with Li6OSI2 having a face-centered cubic space group (Fmm) instead of a primitive cubic structure.
| a | b | c (Å) | α | β | γ (°) | Sym | |
|---|---|---|---|---|---|---|---|
| Li3OCl | 3.89 | 3.89 | 3.89 | 90 | 90 | 90 |
Pmm |
| Li3OI | 4.16 | 4.16 | 4.16 | 90 | 90 | 90 |
Pmm |
| Li3SI | 4.74 | 4.75 | 4.74 | 90.03 | 89.99 | 90 | P1 |
| Li6OSI2 | 8.60 | 8.60 | 8.60 | 90 | 90 | 90 |
Fmm |
| Prim | 6.08 | 6.08 | 6.08 | 60 | 60 | 60 |
Fig. 1 compares the energies of formation for each stable/metastable configuration in the ground state. Here, we follow the convention to formulate the energy of formation with respect to the chemical potentials of stable structures for constituent elements. We find that binding is stronger when the chalcogen site is occupied by O rather than S, while Cl occupancy of the halogen site leads to a more stable structure than it being occupied by I, OH−, or NH2−. Apparently, weakened binding due to A or X substitution leads to increased lattice parameters.
 | ||
| Fig. 1 The global USPEX searched energies of formation for Li3AB alloys: layered (black), anti-perovskite (blue), and anti-perovskite-like (green). | ||
The stable structure for the Li3OCl composition is of the anti-perovskite lattice, as is shown in Fig. 2(a), where the Li6O4+ octahedral unit is on the corners of a cubic frame, leaving Cl− sitting at the body center, thus leading to an overall lattice symmetry of Pmm (221). However, such a cubic structure is not energetically favored once the chalcogen site is replaced by S, with the Li3SCl tending to adopt a layered structure, Fig. 2(b). Such a layered structure is typical for the tri-lithium chlorine-sulfide when Cl−1 is further replaced by Br− or a non-halogen function groups such as NH2− of OH−. Owing to the significant increase in lattice parameters associated with weakened binding by substituting O with S, it is reasonable to reckon that the ionic radius of Cl− is too small to support the framework of Li6S octahedrons, thus leading to the collapse of the anti-perovskite structure. Indeed, when a bigger halogen ion I− is used to replace Cl−, the perovskite structure is largely maintained, Fig. 2(c), albeit experiencing some lattice distortion (Table 1). This indicates the applicability of a tolerance factor such as the well-known Goldschmidt rule that dictates the maintenance of the cubic anti-perovskite structure.27
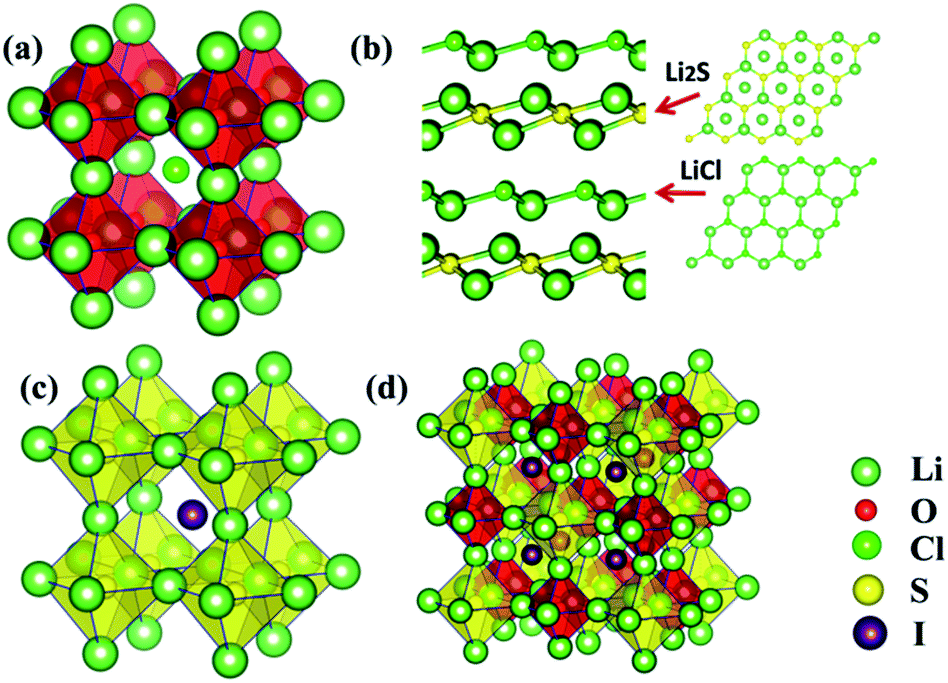 | ||
| Fig. 2 Associated fully-relaxed structures for (a) Li3OCl, (b) Li3SCl, (c) Li3SI, and (d) Li6OSI2. | ||
The Goldschmidt factor for the ionic radius tolerance factor for an anti-perovskite phase Li3AX can be defined as
| Ions and ionic radius (Å) | Tolerance factor |
|---|---|
| Li (0.68), O (1.4), Cl (1.81) | 0.85 |
| Li (0.68), O (1.4), Br (1.96) | 0.9 |
| Li (0.68), O (1.4), I (2.2) | 0.98 |
| Li (0.68), S (1.84), Cl (1.81) | 0.7 |
| Li (0.68), S (1.84), Br (1.96) | 0.74 |
| Li (0.68), S (1.84), I (2.2) | 0.81 |
| Li (0.68), S (1.84), CH3 (2.6) | 0.92 |
| Li (0.68), S (1.84), OH (1.40) | 0.58 |
| Li (0.68), S (1.84), NH2 (1.71) | 0.67 |
| {Li (0.68), O (1.4), I (2.2), Li (0.68), S (1.84), I (2.2)} | {0.98, 0.81} → 0.895 |
Since both Li3OI and Li3SI are of anti-perovskite type structures (Fig. 2(a)vs.Fig. 2(c)), one would be encouraged to mix O2− and S2− in the chalcogen site. The tolerance factor for a structure based on such isovalent mixing of O and S on the A site can be estimated by the weighted sum of the ionic radii for O and S, so that RA = (1 − x)RO + xRS, with x being the atomic fraction of S on the A site. The replacement of every other O site with S therefore leads to a tolerance factor of 0.89, which is well above 0.8 and thus helps to stabilize superlattice structures based on the perovskite lattice. Indeed, global energy minimization from the USPEX process leads to a double anti-perovskite structure, which is constructed using alternating Li6O and Li6S octahedrons over a face-centered cubic lattice; Li6OSI2 as shown in Fig. 2(d). Such a face centered structure, due to the alternating arrangement of the Li6O and Li6S units from two anti-perovskite lattices, is thus referred to as a double anti-perovskite phase (in the same spirit to define the double perovskite structure in the literature). The relaxed half lattice parameter is equal to 4.3 Å (8.6/2), being slightly smaller than the average from 4.16 Å for Li3OI and 4.735 Å for Li3SI. Such a negative deviation from the linear average of the lattice parameters for the constituent phases, 4.44 Å, is as a result of enhanced binding from alloying on the chalcogen site.
Dynamic stability
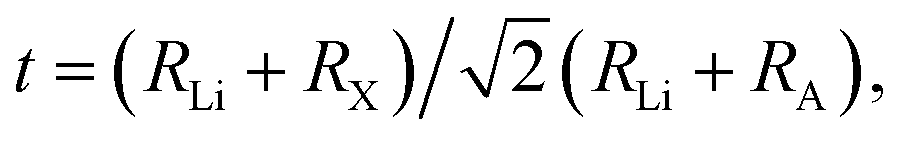
Dynamic stabilities of the fully relaxed structures of energetically stable configurations at 0 K from USPEX searching are checked through examining the characteristics of their phonon band structures. A phase is dynamically stable when no phonon bands are associated with imaginary frequencies, and such a phase is then considered more likely to exist in nature, due to safeguarded mechanical stability. Fig. 3(a)–(d) are calculated phonon band structures for 2 × 2 × 2 supercell (40 atoms) of (a) Li3OCl, (b) Li3OI, and (c) Li3SI. The unit cell for Li6OSI2 (d) is based on the anti-perovskite supercell and contains the same number of atoms. The absence of imaginary frequencies from the phonon band structures of Li3OCl and Li3OI configurations correspond to their big tolerance factors to sustain dynamically stable structures without noticeable lattice distortion. On the other hand, in the phonon band structure for Li3SI, there are some imaginary frequencies below the −0.3 THz border line, which is also in accord with the marginal value of the tolerance factor and associated slight lattice distortion from the cubic lattice, albeit the degree of dynamic instability is rather trivial. When the Li3SI is alloyed with the much more stable Li3OI into a double anti-perovskite phase of Li6OSI2, its significantly larger tolerance factor of 0.89 then leads to a dynamically/mechanically stable phase, Fig. 3(d).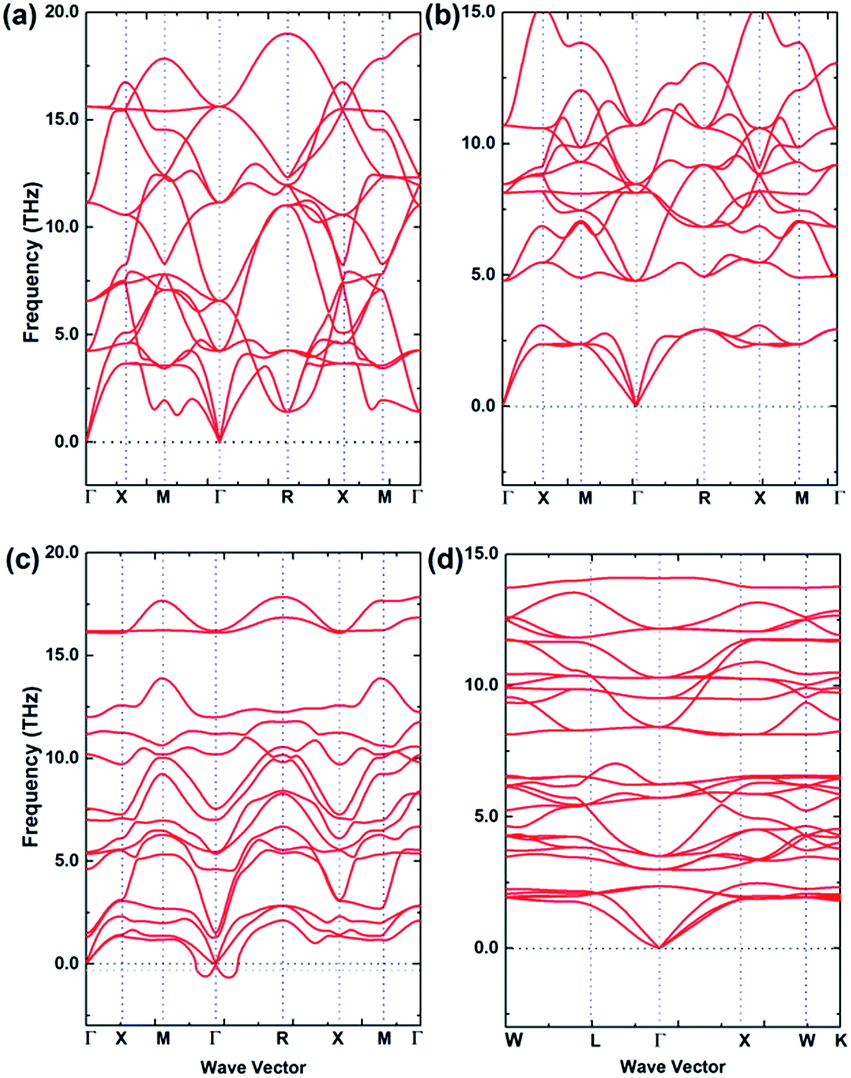 | ||
| Fig. 3 Calculated phonon band structures of the stable structures for (a) Li3OCl, (b) Li3OI, (c) Li3SI and (d) Li6OSI2. | ||
Entropy effect on phase equilibria
We then checked the stability of the above identified ternary or quaternary compounds with respect to stable constituent binary phases. We constructed pseudo-ternary phase diagrams of interest at 0 K, based on energies of formation, with reference to their potential constituent binary phases such as those collected in the Materials Project (MP).44Fig. 4 shows pseudo-ternary phase diagrams containing the Li3OCl, Li3SI, and Li6OSI2 phases, respectively, and none of them is stable with respect to their constituent phases at 0 K. Due to their energies of formation being less negative than the linear combinations of their respective constituent phases, energetically they tend to decompose without consideration of any thermal effect:| Li3OCl → Li2O + LiCl, |
| Li3SI → Li2S + LiI, |
| Li6OSI2 → Li2O + Li2S + 2LiI, |
 | ||
| Fig. 4 Phase diagrams for (a) Li3OCl, (b) Li3SI, and (d) Li6OSI2. Black circles represent stable compounds, and colored circles refer to metastable phases with the hull energy being positive. | ||
We now examine the thermal effects on free energies of compounds within the quasi-harmonic approximation to consider the phonon entropy.22,45 The free energies for Li3OCl, Li3SI, and Li6OSI2 can be calculated against stable constituent compounds by the following:
| ΔGLi3OCl = GLi3OCl − GLi2O − GLiCl, |
| ΔGLi3SI = GLi3SI − GLi2S − GLiI, |
| ΔGLi6OSI2 = GLi6OSI2 − GLi2O − GLi2S − 2GLiI, |
The critical temperatures to enable negative ΔG for the cubic phases Li3OCl, Li3SI, and Li6OSI2 are indicated in Fig. 5. This suggests that the cubic Li3OCl will be more stable than the combination of Li2O and LiCl above 538 K, which is below its experimentally measured melting point of 282 °C (555 K),17 and thus explains why the phase was successfully synthesized at elevated temperatures. The critical temperature to stabilize Li3SI is about the same (520 K). For comparison, the critical temperature to thermally stabilize Li6OSI2 is significantly lower than those for Li3OCl and Li3SI, which is only 145 °C (418 K). The critical temperatures for thermal stabilization of Li6OSI2 and Li3SI are reasonably low, which is helpful for their synthesis. This is because such moderate critical temperatures (Tc) make it easier to hinder their decomposition during cooling after synthesis, since cooling such materials through a range of low temperatures below Tc does not tend to permit long-range diffusion of any chemical species other than Li+. In practice, one is advised to fabricate the materials at a temperature slightly above Tc, followed by quickly cooling the products adequately to avoid the nucleation and growth of low-temperature stable phase/s. Indeed, under the guidance of the current theoretical work, the newly discovered double anti-perovskite phase Li6OSI2 has been successfully synthesized within our team, solely by cold pressing mechanically alloyed powders, since gaining mechanical energy from cold pressing helped to thermally activate the nucleation and growth of the double anti-perovskite phase. The experimental results are briefly summarized in the ESI,† with the X-ray diffraction pattern from the new phase being in excellent agreement with the simulated diffraction pattern, Fig. S1.† The ionic conductivity of Li+ at room temperature is 7.89 mS cm−1, which is about an order higher than the best data reported for Li3OCl,15–17 and is close to that for a typical LGPS alloy. Such superb ionic conductivity is adequate for all-solid LIBs. Work is underway for extensive characterization of the new class of SSE materials, particularly on their incorporation into solid batteries.
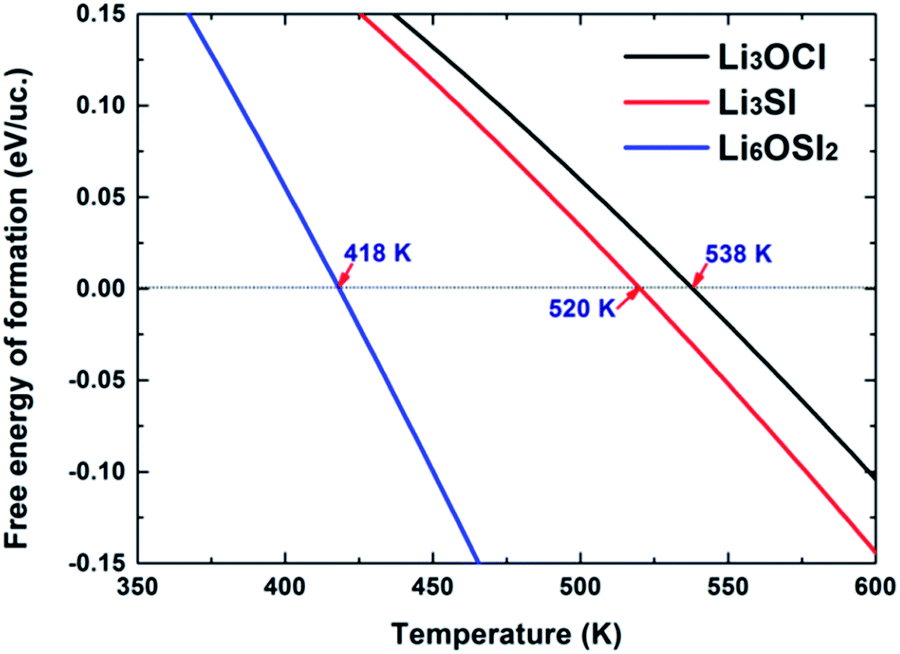 | ||
| Fig. 5 Free energy of formation per unit cell (uc) for the compounds of Li3OCl, Li3SI, and Li6OSI2. | ||
It is worth pointing out that all recently discovered solid-state electrolytes such as the well-known LGPS,6 Li3OCl,22 and Li6PA5X51 are only stable at elevated temperatures. Like the double anti-perovskite phase from this work, the feasibility of their synthesis lies in their capability to be entropically stabilized at moderately elevated temperatures. The moderate Tc for their decomposition makes it practical to maintain their crystal structures when being cooled down to room temperature, due to limitations in transformation kinetics involving long-range chemical ordering.
Electrochemical compatibility with Li anode
The electrochemically compatible window with the Li metal anode was examined according to interfacial reactions against Li uptake per formula unit (f.u.) of solid electrolyte.46–48 The average electrochemical potential,![[V with combining macron]](https://www.rsc.org/images/entities/i_char_0056_0304.gif) A→B, for the transition between state A (LixΠ) and state B (Lix + ΔxΠ), with reference to electrochemical potential for the lithium metal is related to total energies (Etotal) as follows:
A→B, for the transition between state A (LixΠ) and state B (Lix + ΔxΠ), with reference to electrochemical potential for the lithium metal is related to total energies (Etotal) as follows:| A→B = −1/z{[Etotal(Lix + ΔxΠ) − Etotal(LixΠ)]/Δx − Etotal(Li)} |
Fig. 6(a) and (b) plot the voltage above Li/Li+ against the Li uptake per formula unit of Li3OI and Li3SI, respectively. The solid electrolyte undergoes reduction and uptake of Li next to the alkali metal anode (Li rich side) at low voltage, while at high voltage (Li poor side), the electrolyte is oxidized to deplete Li. The intrinsic electrochemical window for the Li3OI composition corresponds to a range of voltage (0.0–2.4 V), while the width of the electrochemical window is between 0.0 and 2.15 V for Li3SI. In view of the electrochemical window according to the associated equilibria phases at 0 K, the upper limit of the electrochemical window for Li6OSI2 should be 2.15 V, in which both Li3OI and Li3SI will be electrochemically stable. Higher voltage leads to the formation of both lithium oxide/s and sulfide/s at the electrode surface, with the presence of the latter being helpful for lowering series resistance, due to their higher electrical conductivity.
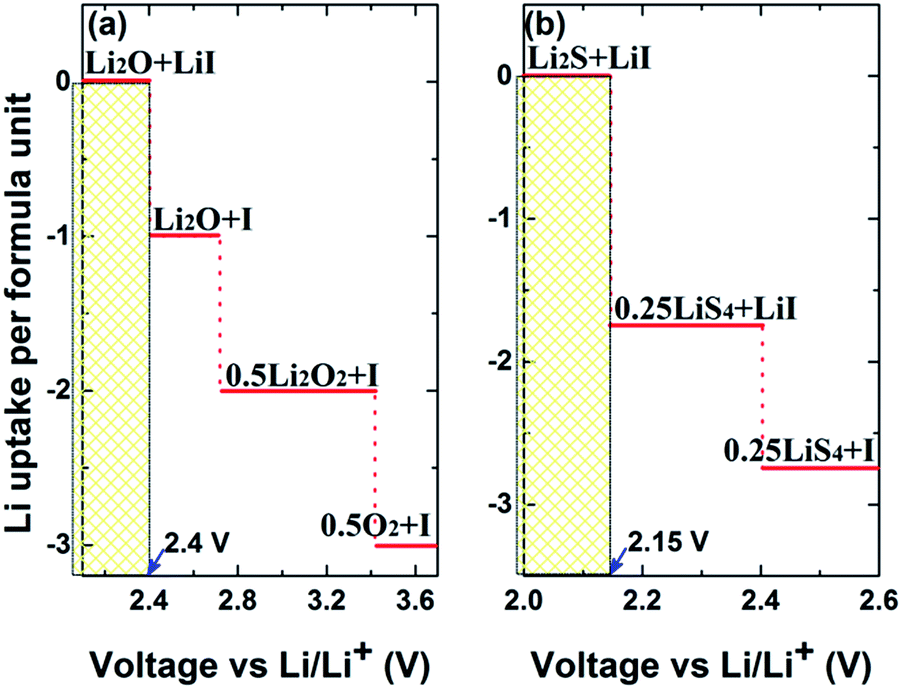 | ||
| Fig. 6 Plot of Li uptake per formula unit of solid electrolyte (red solid) against voltage vs. Li/Li+ for (a) Li3OI, and (b) Li3SI. Text indicates the predicted phase equilibria at corresponding regions at 0 K. | ||
Li+ diffusion along vacancy and interstitial transporting pathways
In addition to structural fluctuation due to the statistical effect associated with thermal excitation, USPEX energy minimization shows that vacancies on the Li+ sites occur when the Li content is lower than the stoichiometry, and similarly, interstitial Li+ ions are present when the Li content is higher than the standard stoichiometry. From the thermodynamic point of view, the energy cost for the formation of vacancies or interstitial Li+ can be readily defined from the difference in formation energies between the defect-containing phase (vacancy or interstitial) and the standard stoichiometric compound (std):| ΔEint = E(Liint) − E(std) − μLi |
| ΔEvac = E(Livac) − E(std) + μLi |
Starting from Li transport in anti-perovskite structures, diffusion paths associated with Li+ vacancies occur with a Li+ ion migrating into a nearest vacancy site of its kind, thus leaving a vacancy behind. The process for such a migration mechanism is identified from CI-NEB, as is illustrated in the lower panel images of Fig. 7(a), which captures the typical states for a Li+ ion diffusing into a neighboring vacancy along the edge of an S centered octahedral unit (Li6S) in Li3SI. The activation energy barrier is 0.27 eV (Table 3), which is very close to that in a typical LGPS electrolyte.6,7
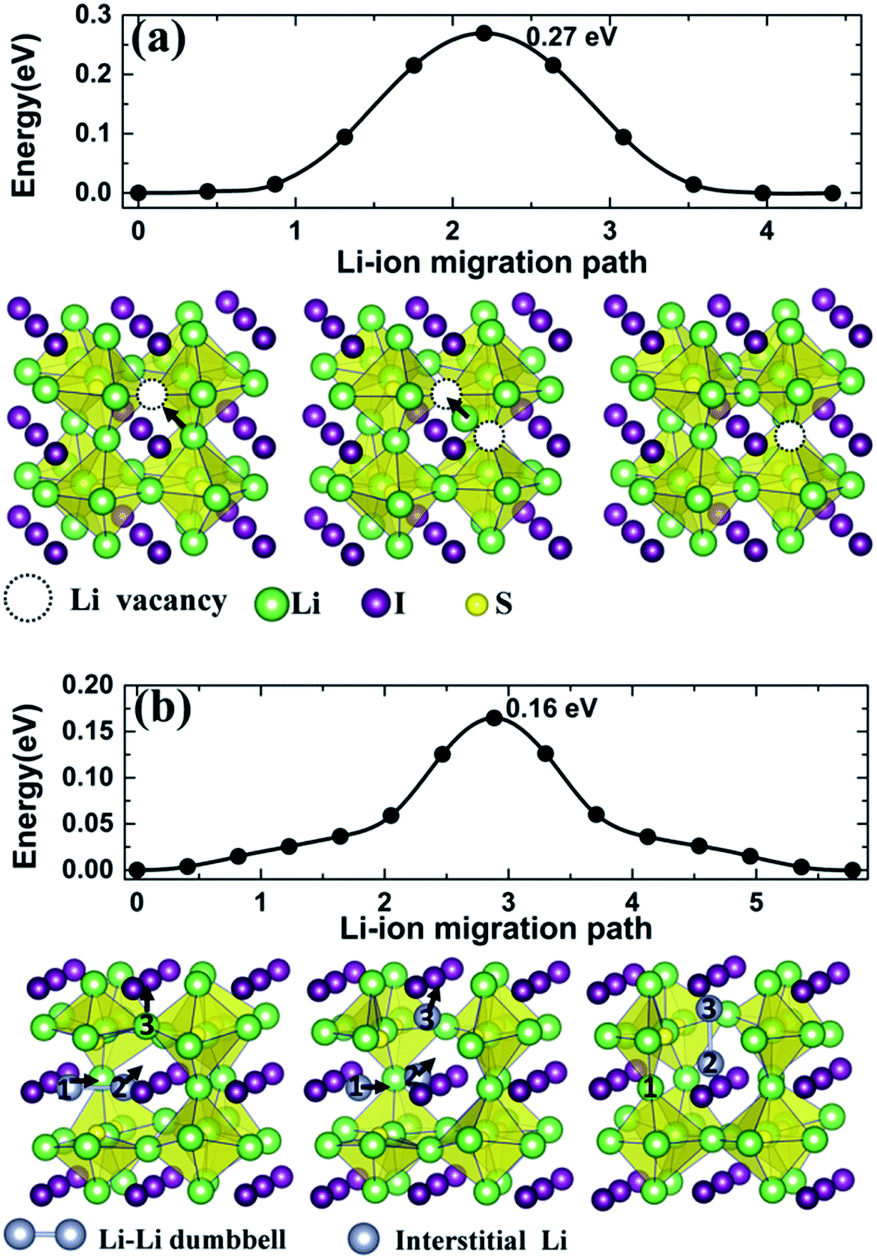 | ||
| Fig. 7 Calculated energy barriers for the migration of Li+ ions in Li3SI along (a) the Li+ vacancy diffusive pathway and (b) the interstitial channel in a dumbbell pathway. | ||
| System | E a (eV) | ρ (1023 cm−3) | D 300 K (cm2 s−1) | σ (mS cm−1) | |
|---|---|---|---|---|---|
| 300K | 223K | ||||
| Li3OCl vac | 0.35exp15,16 | 0.488 | 3.23 × 10⁻¹⁰ | 0.2exp16 | |
| 0.303AIMD18 | 0.12AIMD18 | ||||
| 0.34CINEB19 | |||||
| 0.35CINEB | |||||
| 0.31AIMD | 0.1AIMD | ||||
| Li3OCl int | 0.26exp17 | 0.530 | 3.53 × 10⁻⁹ | 0.85exp17 | |
| 0.17CINEB19 | |||||
| 0.162CINEB | |||||
| 0.27AIMD | 1.1AIMD | ||||
| Li3SI vac | 0.27CINEB | ||||
| Li3SI int | 0.16CINEB | ||||
| Li6OSI2 vac | 0.26AIMD | 0.393 | 8.09 × 10⁻⁹ | 1.03AIMD | |
| Li6OSI2 int | 0.107, 0.16CINEB | ||||
| 0.22AIMD | 0.393 | 2.07 × 10⁻⁸ | 5.0AIMD | ||
| Li25O4S5I7 | 0.026, 0.053CINEB | ||||
| 0.18AIMD | 0.393 | 5.11 × 10⁻⁸ | 12.5AIMD | 1.1AIMD | |
| LGPS | 0.22exp6,7 | 0.205 | 7.63 × 10⁻⁸ | 10exp6,7 | 0.5AIMD |
| 0.21AIMD50 | 9AIMD50 | ||||
| 0.23AIMD | 9.7AIMD | ||||
| 0.217CINEB c-axis | |||||
| 0.615CINEB a-axis | |||||
For the migration of an interstitial Li+ ion in an anti-perovskite phase such as Li3SI, structural relaxation reveals that the presence of an interstitial Li+ tends to offset a vertex Li+ of an Li6S octahedron from its ideal position, thus forming a dumbbell coordination with the approaching interstitial Li+ at the vertex point. Such a dumbbell formation-decomposition was identified by Emly et al. as the dictating mechanism for the migration of interstitial Li+ ions.20 The dumbbell-linked pathway for the transportation of an interstitial Li+ is depicted in the lower panel images of Fig. 7(b). Initially, the first interstitial Li+ (1) offsets its vertex neighbor into the second position (2) to form a dumbbell-like microscopic configuration (1–2), while the third Li+ stays at another vertex site. It follows that the first Li+ then fills the previous vertex site of Li+ (2) when the latter offsets Li+ (3) to form another dumbbell coordination (2–3). The activation energy barrier along such a pathway is 0.16 eV, which is about one-third lower than that associated with the vacancy mechanism.
Similarly, Li+ diffusing along vacancy and dumbbell pathways in the Li3OCl compound were also calculated. Along the vacancy pathway, the activation barrier was 0.35 eV for Li3OCl, which is in excellent agreement with the reported value from NEB or AIMD simulation18–20 and the experimental value of 0.35 eV.15,16 Such an activation barrier is one-quarter higher than the 0.27 eV barrier in Li3SI. Along the dumbbell pathway in Li3OCl, the energy barrier is 0.162 eV, which agrees well with the previously calculated value of 0.17 eV.19
The charge density distributions for the mid-path sections along the vacancy pathway in Li3OCl and Li3SI are compared in Fig. 8(a) and (b). The charge maps correspond to the blue-dashed line linked frameworks as the bottlenecks for a Li+ ion to squeeze through. The triangular bottleneck gate constructed by Cl–O–Cl and I–S–I are considerably different in size, with S replacement of O leading to a larger gate, making it easier for Li to go through. The lower electronegativity of S than that of O is behind the weaker bonding associated with S substitution of O. Obvious charge overlap between Cl− and Li+ can be found from Fig. 8(a), while there is little charge overlap between I− and Li+ in Fig. 8(b). Therefore, the weaker bonding in Li3SI leads to a lower activation barrier for Li+ diffusion than in Li3OCl.
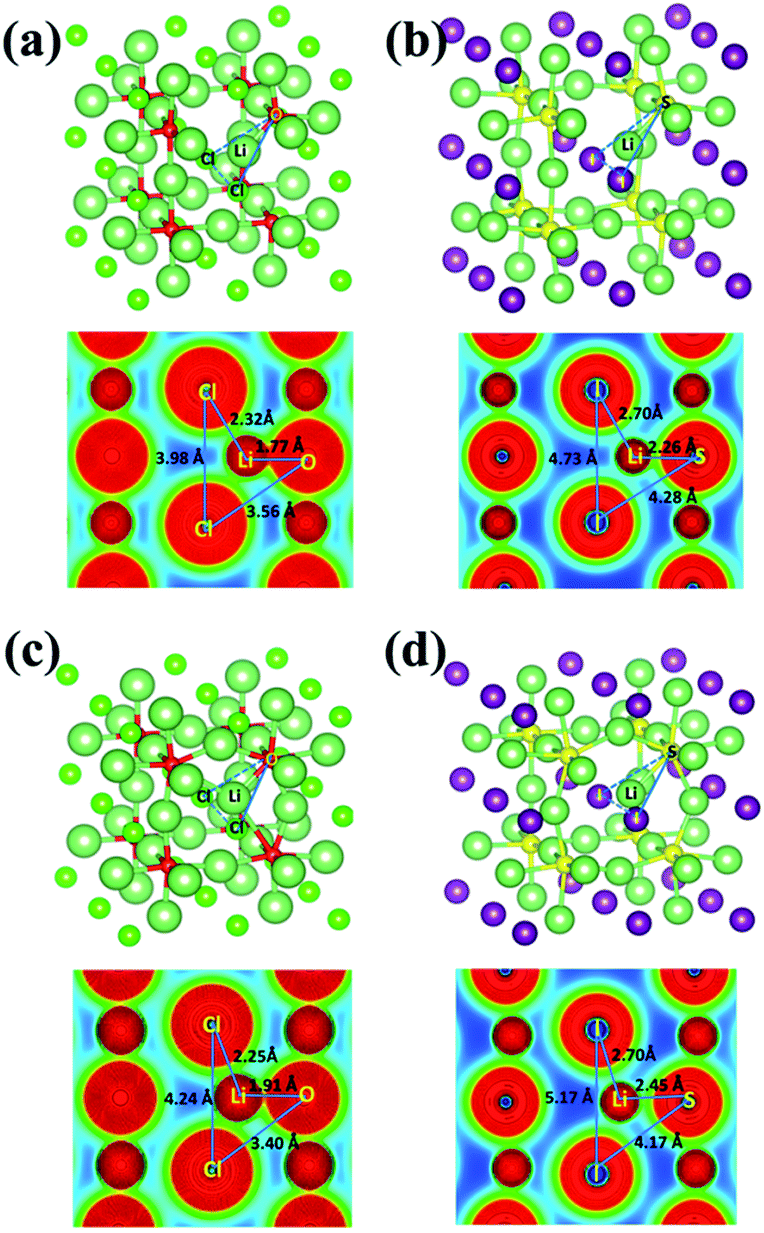 | ||
| Fig. 8 Charge distributions for the mid-path section of the vacancy diffusive pathway for (a) Li3OCl, (b) Li3SI, and the interstitial channel for (c) Li3OCl, (d) Li3SI. | ||
As is shown in Fig. 8(c) and (d), when excessive Li+ is incorporated into the systems, the bond length of Li–O increases from 1.77 Å to 1.91 Å, while the bond length of Li–S increases from 2.26 Å to 2.45 Å. The enlarged lengths between Li+ and the chalcogen anions suggest that the interactions between them are further weakened due to the presence of excessive Li+ in the systems. This makes it easier for Li+ migration, and the formation of a coordinated dumbbell next to the associated vertex site is effective in further reducing anion–cation interactions, due to diluted electrostatic interactions. Such combined effects lead to significantly reduced activation barriers for the migration of interstitial Li+ ions.
The double anti-perovskite Li6OSI2 identified in this work is made of alternating Li6O and Li6S octahedrons, together with halogen I− occupying the center of each cubic cage of the octahedrons. Each vertex Li+ is therefore shared by both Li6O and LI6S octahedrons, though the Li–chalcogen bond lengths are rather different in the different types of octahedrons. Naturally, the activation barriers associated with either the vacancy or interstitial Li+ diffusing pathways will be impacted by such two kinds of octahedrons. Taking the dumbbell mechanism for interstitial Li+ for example, there are two types of migrating modes associated with the two types of octahedrons, as shown in Fig. 9. While the activation barrier for a dumbbell unit to transport around Li6S is slightly larger than that in Li3SI and Li3OCl (0.166 eV vs. 0.16 eV), the activation barrier associated with the Li6O octahedron is somewhat lower, 0.107 eV.
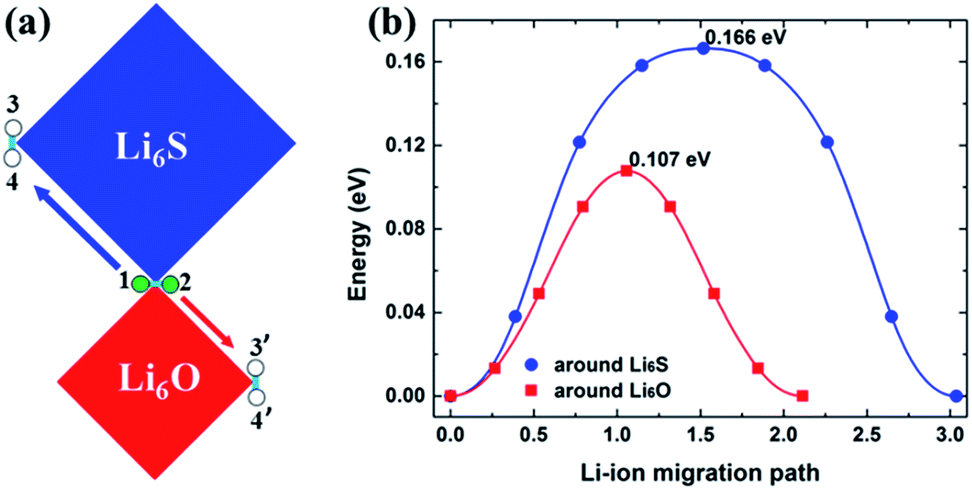 | ||
| Fig. 9 (a) Two options for the transport of dumbbell Li+ ions in the Li6OSI2 phase, from 1–2 to either 3–4 or 3′–4′. (b) Calculated energy barriers for the migration of Li+ ions around the Li6S octahedron and Li6O octahedron. | ||
The effect of off-stoichiometric components on Li+ transportation
Recently, Deng et al. reported that in the cubic argyrodite phase of Li6PS5Cl, a slightly off-stoichiometric composition such as Li6.25PS5.25Cl0.75 brings about significant enhancement in ionic conductivity.49 This effect is also observed in the current alloys, with extraneous Li+ together with chalcogen substitution for halogen to maintain overall charge neutrality. The energetic cost for such a slight off-stoichiometric drift can be rather trivial. For example, with some slight deviation from the Li6OSI2 (Li24O4S4I8) stoichiometry, the formation energy for Li25O4S5I7 (Li24+1O4S4+1I8−1) is only 0.015 eV per atom above that for Li6OSI2, suggesting a high likelihood for realization in experiments. The diffusion activation barrier for Li for the former is reduced to only 0.026 and 0.053 eV for the dumbbell pathways around the Li6S and Li6O octahedrons, respectively (Table 3).AIMD simulation
Although the CI-NEB method can be used to assess the activation barriers for ionic diffusion through path searching over a static energy landscape at 0 K, it is desirable to assess the temperature dependence of the ionic diffusion coefficient D. Recent work has demonstrated the successful assessment of D by AIMD simulation at elevated temperatures from a statistics point of view.45,49–51 From an AIMD simulation, the diffusion coefficient D can be extracted via the following equation:| D = [Δr(t)]2/2dt, |
The dimensionality factor, d, is equal to 3 for three-dimensional structures, and [Δr(t)]2 is the average mean square displacement (MSD) over a time duration, t. Correction of the MSD from artefactual errors due to the periodic boundary condition is necessary for dependable AIMD evaluation of D, using the “unwrapped” trajectories to help achieve significant improvement in sampling statistics from limited simulation data, typical for tractable AIMD runs.52
On the basis of the Arrhenius relation, the diffusion coefficient, D = D0exp(−Ea/kBT), can then be derived by simulating D at a series of temperatures, T (Ea is the activation barrier for Li+ ion transport, kB is the Boltzmann constant, and D0 is a constant). Fig. 10 plots the Arrhenius relationships by the logarithmic value of D versus 1/T, with linear fitting resulting in the activation energies and diffusion coefficient D. The diffusion data for various alloys are listed in Table 3 for comparison with data obtained from the CI-NEB method and reported data from the literature.
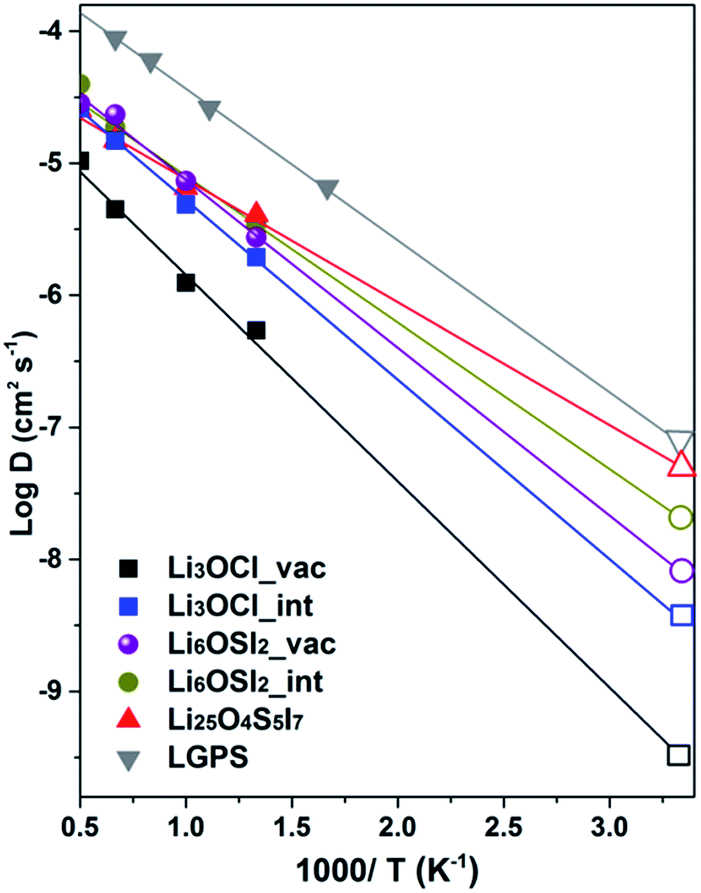 | ||
| Fig. 10 Diffusion coefficients for lithium ions from AIMD simulation. The D values at room temperature are presented by open patterns on the right side of the figure panel. | ||
The AIMD method has been successfully tested in the well documented LGPS alloy,51 leading to excellent agreement with experimental and theoretically predicted data in literature,7,50 shown in Table 3. For the anti-perovskite and double anti-perovskite phases, the AIMD data based on the vacancy mechanism predict activation barriers for Li+ transport that agree well with the CI-NEB results19 and the reported AIMD values.18 On the other hand, the AIMD activation energies associated with interstitial Li+ are only moderately lower than values from the vacancy mechanism, thus being significantly larger than those from the dumbbell mechanism. The summarized data in Table 3 indicate that the AIMD data from this work can account for the discrepancy in the reported experimental data between different groups for Li3OCl, so that lower ionic conductivity with larger activation energy15,16 is associated with the vacancy mechanism, while somewhat higher ionic conductivity with smaller activation energy17 is associated with interstitial Li+.
Overall, AIMD is considered more reliable than CI-NEB for transport properties of interstitial Li+ ions, as the dumbbell mechanism from static CI-NEB path searching is not evidenced by trajectory examination. This suggests that the complexity of coordinated migration in the dumbbell association hinders their occurrence, due to a lowered statistical probability, typical of molecular dynamics. It is useful to note that enrichment of Li+ of 4%, together with S2− enrichment and I− deficiency to maintain charge neutrality, i.e. Li25O4S5I7vs. Li6OSI2 (Li24O4S4I8), results in a 30% reduction in the activation energy (0.18 eV) with respect to that from the vacancy mechanism (0.26 eV). This suggests that the presence of interstitial Li+ leads to more effective enhancement of Li+ transport than relying solely on Li+ vacancies. The fact that even in such a case, the activation energy from AIMD is still nearly four times the values from the CINEB barriers (0.026 and 0.053 eV) is further evidence that the role of the dumbbell mechanism is rather limited. The AIMD data are therefore preferred for self-consistent assessment of ionic transport in the alloys of interest in this work.
The alkali ionic conductivity at room temperature σ can be derived by the Nernst–Einstein equation as the product of the volume ion density ρ, the square of the ionic charge z, and the absolute mobility of the ion:51,53
| σ = ρz2F2D/RT, |
Bandgap
While SSE should be highly conductive to Li+ ions, it should be insulating for the conduction of electrons to avoid internal discharging. Fig. 11 summarizes the density of states (DOS) for the ionic conductors of interest to this work, using the HSE06 screened hybrid functional for improved accuracy in band structure calculation, by accounting for some non-local effects in the exchange–correlation functional. It can be seen that all materials of interest are insulating to electrons, due to the existence of rather large forbidden energy gaps between the valence band maximum (VBM) and conduction band minimum (CBM). Both the VBM and CBM are dominated by electron states of anions in all compounds. Moreover, the forbidden gap is shown to be mainly determined by the type of chalcogen species (O, S), so that the gap value is correlated to the overall bonding strength. The most strongly bonded O containing material has the largest forbidden gap, compared to the S based materials, Li3OCl (6.2 eV) > Li3OI (5.3 eV) > Li6OSI2 (4.5 eV) > Li3SI (4.43 eV). The charge neutrality in Li25O4S5I7 is shown to safeguard its intrinsic nature as a wide gap material, without any defect states being present in the forbidden gap, Fig. S2.†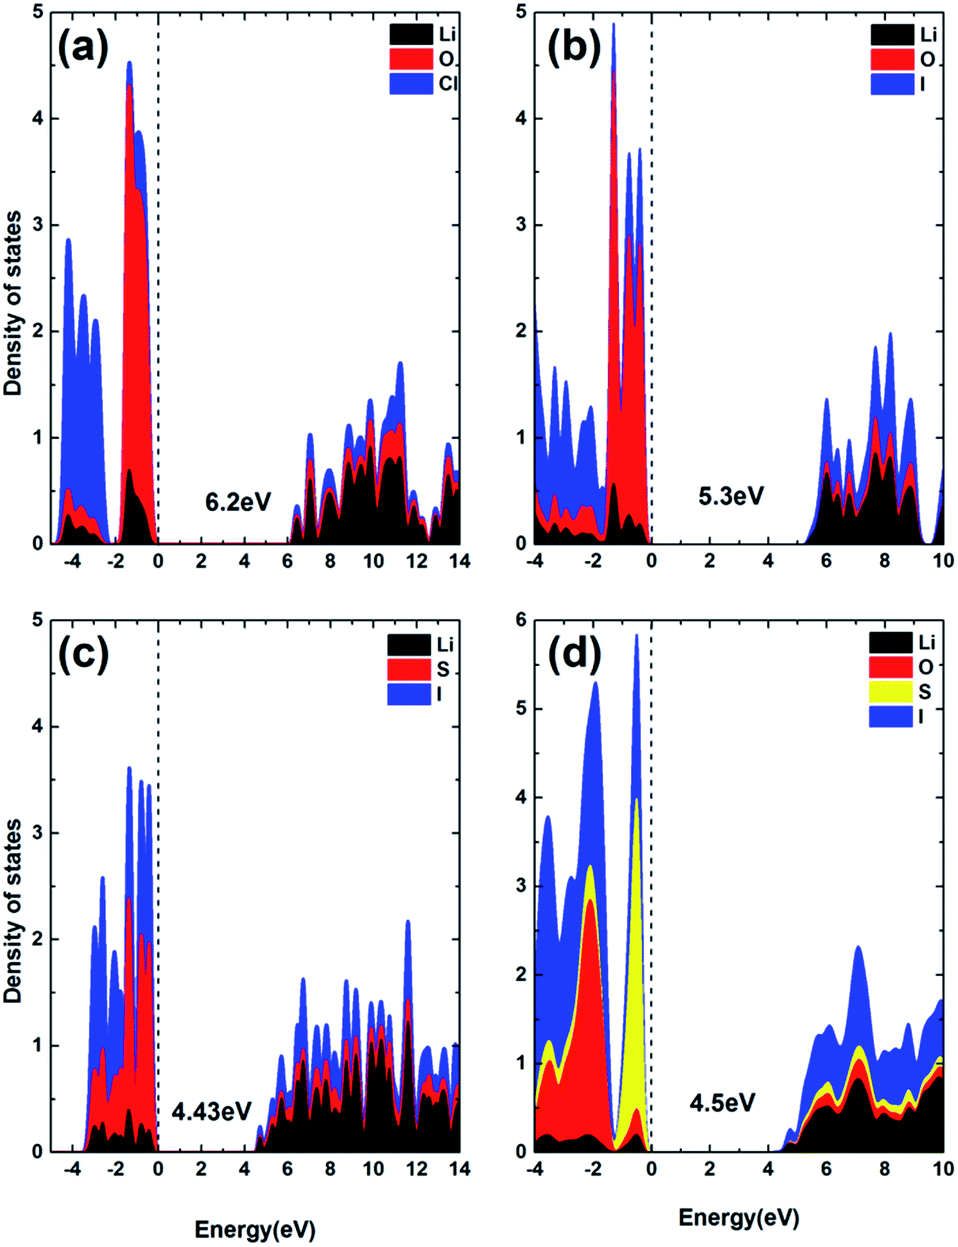 | ||
| Fig. 11 The projected density of states calculated using the HSE06 functional: (a) Li3OCl, (b) Li3OI, (c) Li3SI, and (d) Li6OSI2. | ||
Conclusions
Systematic modeling has been carried out to design fast Li+ ion conductors based on the anti-perovskite structure. This enables discovery of two new phases, the anti-perovskite Li3SI and the double anti-perovskite Li6OSI2. The latter is especially attractive due to combined energetic and dynamic stability. Both new phases are of attractively low activation energies for the diffusion of Li+ ions, leading to excellent Li+ conductivity at room temperature.AIMD simulation shows that moderate off-stoichiometric compositional deviation in the double-anti-perovskite materials can lead to considerable reduction of the activation barrier for Li+ transportation. This includes moderate enrichment of Li ions together with chalcogen excess and halogen deficiency to maintain charge neutrality. The combined effect can lead to low activation energy of about 0.18 eV for the double anti-perovskite phase (Li25O4S5I7), making it particularly attractive for low temperature applications in fully solid LIBs.
Conflicts of interest
There are no conflicts of interest to declare.Acknowledgements
This work is supported in part by the 1000 Talents Program of China, the Zhengzhou Materials Genome Institute, the National Natural Science Foundation of China (No. 51001091, 111174256, 91233101, 51602094, 11274100), and the Fundamental Research Program from the Ministry of Science and Technology of China (no. 2014CB931704).Notes and references
- M. Armand and J. M. Tarascon, Nature, 2008, 451, 652–657 CrossRef CAS PubMed.
- B. Dunn, H. Kamath and J. M. Tarascon, Science, 2011, 334, 928–935 CrossRef CAS PubMed.
- B. Scrosati, J. Hassoun and Y. K. Sun, Energy Environ. Sci., 2011, 4, 3287–3295 CAS.
- Q. S. Wang, P. Ping, X. Zhao, G. Chu, J. Sun and C. Chen, J. Power Sources, 2012, 208, 210–224 CrossRef CAS.
- M. Tatsumisago, M. Nagao and A. Hayashi, J. Australas. Ceram. Soc., 2013, 1, 17–25 CrossRef.
- A. Kuhn, V. Duppel and B. V. Lotsch, Energy Environ. Sci., 2013, 6, 3548–3552 CAS.
- N. Kamaya, K. Homma, Y. Yamakawa, M. Hirayama, R. Kanno, M. Yonemura, T. Kamiyama, Y. Kato, S. Hama, K. Kawamoto and A. Mitsui, Nat. Mater., 2011, 10, 682–686 CrossRef CAS PubMed.
- Y. Hu, Nat. Energy, 2016, 1(4), 16042 CrossRef CAS.
- Y. Kato, S. Hori, T. Saito, K. Suzuki, M. Hirayama, A. Mitsui, M. Yonemura, H. Iba and R. Kanno, Nat. Energy, 2016, 1, 16030 CrossRef CAS.
- X. Han, Y. Gong, K. Fu, X. He, G. T. Hitz., J. Dai, A. Pearse, B. Liu, H. Wang, G. Rubloff, Y. Mo, V. Thangadurai, E. D. Wachsman and L. Hu, Nat. Mater., 2017, 16, 572–579 CrossRef CAS PubMed.
- V. Thangadurai, D. Pinzaru, S. Narayanan and A. K. Baral, J. Phys. Chem. Lett., 2015, 6, 292–299 CrossRef CAS PubMed.
- C. Luntz, J. Voss and K. Reuter, J. Phys. Chem. Lett., 2015, 6, 4599–4604 CrossRef PubMed.
- S. Li, J. Zhu, Y. Wang, W. J. Howard, X. Lü, Y. Li, S. R. Kumar, L. Wang, L. L. Daemen and Y. Zhao, Solid State Ionics, 2016, 284, 14–19 CrossRef CAS.
- O. Reckeweg, B. Blaschkowski and T. Schleid, Z. Anorg. Allg. Chem., 2012, 638, 2081–2086 CrossRef CAS.
- X. Lü, G. Wu, J. W. Howard, A. Chen, Y. Zhao, L. L. Daemen and Q. Jia, Chem. Commun., 2014, 50, 11520–11522 RSC.
- X. Lü, J. W. Howard, A. Chen, J. Zhu, S. Li, G. Wu, P. Dowden, H. Xu, Y. Zhao and Q. Jia, Adv. Sci., 2016, 3, 1500359 CrossRef PubMed.
- Y. Zhao and L. L. Daemen, J. Am. Chem. Soc., 2012, 134, 15042–15047 CrossRef CAS PubMed.
- Y. Zhang, Y. Zhao and C. Chen, Phys. Rev. B: Condens. Matter Mater. Phys., 2013, 87, 134303 CrossRef.
- Z. Deng, B. Radhakrishnan and S. P. Ong, Chem. Mater., 2015, 27, 3749–3755 CrossRef CAS.
- A. Emly, E. Kioupakis and A. Van der Ven, Chem. Mater., 2013, 25, 4663–4670 CrossRef CAS.
- M. H. Braga, N. S. Grundish, A. J. Murchisona and J. B. Goodenough, Energy Environ. Sci., 2016, 116, 140–162 Search PubMed.
- M.-H. Chen, A. Emly and A. Van der Ven, Phys. Rev. B: Condens. Matter Mater. Phys., 2015, 91, 214306 CrossRef.
- T. W. D. Farley, W. Hayes, S. Hull, M. T. Hutchings and M. Vrtis, J. Phys.: Condens. Matter, 1991, 3, 4761–4781 CrossRef CAS.
- Y. Wang, W. D. Richards, S. P. Ong, L. J. Miara, J. C. Kim, Y. Mo and G. Ceder, Nat. Mater., 2015, 14, 1026–1031 CrossRef CAS PubMed.
- Z. Lin, Z. Liu, N. J. Dudney and C. Liang, ACS Nano, 2013, 7, 2829–2833 CrossRef CAS PubMed.
- F. Han, J. Yue, X. Fan, T. Gao, C. Luo, Z. Ma, L. Suo and C. Wang, Nano Lett., 2016, 16, 4521–4527 CrossRef CAS PubMed.
- V. M. Goldschmidt, Naturwissenschaften, 1926, 14, 477–485 CrossRef CAS.
- G. Kresse and J. Hafner, Phys. Rev. B: Condens. Matter Mater. Phys., 1993, 47, 558 CrossRef CAS.
- G. Kresse and J. Hafner, Phys. Rev. B: Condens. Matter Mater. Phys., 1994, 49, 14251 CrossRef CAS.
- P. E. Blöchl, Phys. Rev. B: Condens. Matter Mater. Phys., 1994, 50, 17593 CrossRef.
- G. Kresse and D. Joubert, Phys. Rev. B: Condens. Matter Mater. Phys., 1999, 59, 1758–1775 CrossRef CAS.
- G. Kresse and J. Hafner, Phys. Rev. B: Condens. Matter Mater. Phys., 1993, 48, 13115–13118 CrossRef CAS.
- J. P. J. Perdew, K. Burke and M. Ernzerhof, Phys. Rev. Lett., 1996, 77, 3865–3868 CrossRef CAS PubMed.
- J. Heyd, G. E. Scuseria and M. Ernzerhof, J. Chem. Phys., 2003, 118, 8207 CrossRef CAS.
- J. Heyd, G. E. Scuseria and M. Ernzerhof, J. Chem. Phys., 2006, 124, 219906 CrossRef.
- G. Henkelman, B. P. Uberuaga and H. Jósson, J. Chem. Phys., 2000, 113, 9901–9904 CrossRef CAS.
- G. Henkelman and H. Jósson, J. Chem. Phys., 2000, 113, 9978–9985 CrossRef CAS.
- R. Oganov and C. W. Glass, J. Chem. Phys., 2006, 124, 244704 Search PubMed.
- W. Glass, A. R. Oganov and N. Hansen, Comput. Phys. Commun., 2006, 175, 713–720 CrossRef.
- K. Parlinski, Z. Q. Li and Y. Kawazoe, Phys. Rev. Lett., 1997, 78, 4063 CrossRef CAS.
- A. Togo, F. Oba and I. Tanaka, Phys. Rev. B: Condens. Matter Mater. Phys., 2008, 78, 134106 CrossRef.
- T. D. Huan, V. N. Tuoc and N. V. Minh, Phys. Rev. B, 2016, 93, 094105 CrossRef.
- F. Brivio, J. M. Frost, J. M. Skelton, A. J. Jackson, O. J. Weber, M. T. Weller, A. R. Goñi, A. M. A. Leguy, P. R. F. Barnes and A. Walsh, Phys. Rev. B: Condens. Matter Mater. Phys., 2015, 92, 144308 CrossRef.
- A. Jain, S. P. Ong, G. Hautier, W. Chen, W. D. Richards, S. Dacek, S. Cholia, D. Gunter, D. Skinner, G. Ceder and K. A. Persson, APL Mater., 2013, 1, 011002 CrossRef.
- I.-H. Chu, H. Nguyen, S. Hy, Y.-C. Lin, Z. Wang, Z. Xu, Z. Deng, Y. Meng and S. P. Ong, ACS Appl. Mater. Interfaces, 2016, 8, 7843–7853 CAS.
- M. K. Aydinol, A. F. Kohan, G. Ceder, K. Cho and J. Joannopoulos, Phys. Rev. B: Condens. Matter Mater. Phys., 1997, 56, 1354–1365 Search PubMed.
- I. Courtney, J. Tse, O. Mao, J. Hafner and J. Dahn, Phys. Rev. B: Condens. Matter Mater. Phys., 1998, 58, 15583 CrossRef CAS.
- J. Morris, C. P. Grey and C. J. Pickard, Phys. Rev. B: Condens. Matter Mater. Phys., 2014, 90, 054111 CrossRef.
- Z. Deng, Z. Zhu, L. H. Chu and S. P. Ong, Chem. Mater., 2017, 29(1), 281–288 Search PubMed.
- Y. F. Mo, S. P. Ong and G. Ceder, Chem. Mater., 2012, 24, 15–17 CrossRef CAS.
- Z. Wang and G. Shao, J. Mater. Chem. A, 2017, 5, 21846–21857 CAS.
- M. V. Agnihotri, S. H. Chen, C. Beck and S. J. Singer, J. Phys. Chem. B, 2014, 118, 8170–8178 CrossRef CAS PubMed.
- C. Bachman, S. Muy, A. Grimaud, H. H. Chang, N. Pour, S. F. Lux, O. Paschos, F. Maglia, S. Lupart, P. Lamp, L. Giordano and S. H. Yang, Chem. Rev., 2016, 116, 140–162 CrossRef PubMed.
Footnote |
| † Electronic supplementary information (ESI) available. See DOI: 10.1039/c7ta08698a |
| This journal is © The Royal Society of Chemistry 2018 |