 Open Access Article
Creative Commons Attribution 3.0 Unported Licence
Understanding the stability of mixed A-cation lead iodide perovskites†
Bethan
Charles
,
Jessica
Dillon
,
Oliver J.
Weber
,
M. Saiful
Islam
 * and
Mark T.
Weller
 *
*
Centre for Sustainable Chemical Technologies, Department of Chemistry, University of Bath, Bath, BA2 7AY, UK. E-mail: m.t.weller@bath.ac.uk; m.s.islam@bath.ac.uk
First published on 17th October 2017
Abstract
The routes and kinetics of the degradation of thin films of methylammonium (MA)/formamidinium (FA) lead iodide perovskites (MA1−xFAxPbI3, 0 ≤ x ≤ 1) under dry atmospheric conditions have been investigated. MA-rich phases decompose to the precursor iodide salts and PbI2, while FA-rich phases convert mainly to the yellow hexagonal phase. The reactivity is strongly inhibited for mixed cation phases of MA1−xFAxPbI3, for x = 0.4 to 0.6, where the decomposition routes available to end member phases become less favourable. It is shown that for pristine films with x = 0.6, PbI2 formation can be completely suppressed for up to 10 days. Kinetic analysis reveals that the rate of PbI2 formation decays exponentially with increasing FA content until x = 0.7, beyond which the FA containing perovskite transforms rapidly to the hexagonal phase. Ab initio simulations of the decomposition reaction energies fully support the increased kinetic stability found experimentally for the mixed A-cation perovskites.
Hybrid lead halide perovskites have recently risen to prominence as highly versatile materials for optoelectronic technologies, particularly high efficiency, solution processed solar cells.1–4 They display near optimal band gap for solar light absorption, high absorption coefficients, steep absorption onsets and significant charge carrier lifetimes (and thus diffusion lengths).2,5 These properties, combined with the processability of these materials,6,7 have resulted in solar cell device efficiencies rising rapidly to over 22%.8 However, the commercial applicability of these materials is hampered by their relative lack of stability compared to established inorganic and organic semiconductors.9–11 By chemical site-substitution at any of the A, B or X sites of the ABX3 perovskite structure, it has been found that it is possible to tune the properties and, most pertinently, the stability of the resultant material.12–14
The archetypal hybrid perovskite methylammonium (MA) lead iodide (CH3NH3PbI3), MAPI, crystallises in the tetragonal space group I4/mcm at room temperature.15 Formamidinium (FA) lead iodide (CH(NH2)2PbI3), FAPI, by contrast preferentially crystallises in the yellow, 2H hexagonal perovskite type polymorph at room temperature, which can be driven to transform to the black cubic perovskite polymorph (required for photovoltaic applications) by heating above room temperature.16–19 Such varying phase behaviour can be accounted for by the different sizes and hydrogen bonding mechanisms of these dissimilar organic cations, MA and FA.
Both MA and FA cations display directional hydrogen bonding, a factor of increasing importance in controlling phase behaviour as the system temperature is reduced and also for defining the relative stability of the two polymorphs of FAPI.20 Stabilisation of mixed A site compounds relative to the end members of the series can be rationalised using geometrical arguments in which the perovskite tolerance factor is tuned using differently sized cations, as well as an entropic factor due to cation mixing.21
It has been established that by combining the MA and FA cations in solid solutions, the cubic perovskite phase is stabilised versus decomposition.22–25 We have previously shown that for compositions MA1−xFAxPbI3 0 < x < 0.2 the structures are best described by a tetragonal unit cell from X-ray diffraction, while the rest of the composition range, 0.2 ≤ x ≤ 1, forms with a cubic cell, space group Pm![[3 with combining macron]](https://www.rsc.org/images/entities/char_0033_0304.gif) m.26
m.26
The compositional space for A site substitution between FA and MA has been explored in the literature.27,28 Huang et al.23 studied the charge transport characteristics of single MA1−xFAxPbI3 single crystals over the composition ranges 0 < x < 0.2 and 0.8 < x < 1 in increments of x = 0.05. High carrier mobilities and lifetimes were obtained for x = 0.1 and 0.15. Promising performance has also been demonstrated recently in photovoltaic devices,22,29 where MA0.9FA0.1PbI3 delivered an efficiency improvement to 20.2%, versus 18.6% for pure MAPI. Links between crystallinity, crystal phase stability, good optoelectronic properties and operational stability have been drawn,24 indicating that highly crystalline compositions also suppress effects such as mixed halide phase segregation.
Furthermore, for the synthesis and efficient operation of devices the perovskite materials need to be stabilised with respect to the phase transition to the undesirable hexagonal 2H-perovskite polymorph, as occurs for FAPI and FA-rich solid solutions.23,25 The phase stability of MA1−xFAxPbI3 has been studied for samples stored under a nitrogen atmosphere, indicating that for FA-rich compositions with x > 0.76, partial transition to the hexagonal phase is observed within days, while for compositions with more MA, the hexagonal phase is not observed by X-ray diffraction.30 The propensity for hybrid perovskites to react with water has also been reported.31 While high photovoltaic performance for MA1−xFAxPbI3 has been demonstrated, the extended stability lifetime and decomposition of these compounds under moderately dry atmospheric conditions, likely to be similar to those used in device processing, have yet to be fully reported and are not completely understood.
In this work, for the first time, the degradation of MA1−xFAxPbI3 thin films over the full compositional range 0 < x < 1, in increments of x = 0.1, in air has been systematically investigated. The results provide a full understanding of the processes, thermodynamics and kinetics involved in the degradation of mixed A-cation lead perovskites.
Powder X-ray diffraction (PXD) data from MA1−xFAxPbI3 were initially collected on as-made pristine films (see ESI S1 and S2†). Further diffraction patterns were subsequently obtained from the same samples after 1, 3, 5, 7 and 10 days. The films were stored below 30% relative humidity in the dark in order to control exposure to high levels of moisture and intense light, which are already known to cause degradation.31 Raw diffraction data were corrected for sample height displacement and analysed using the EVA diffraction suite.
PXD patterns for samples with 0 ≤ x ≤ 1 displayed the emergence of a peak centred at 2θ = 12.7°, representing the (001) reflection for PbI2 (Fig. 1). For 0 ≤ x ≤ 0.3, this reflection grew in intensity over time, surpassing the relative intensity of the (100) perovskite reflection centred at 2θ = 14° after 10 days. However, consideration of PXD data from samples with x ≥ 0.4 showed that the presence of increasing levels of FA cation suppress the formation of PbI2, with the relative intensity of the (001) PbI2 reflection decreasing with increasing x, for the same time period of exposure to air. For the film composition x = 0.6, no PbI2 is observed after 7 days by PXD, with only trace amounts present after 10 days.
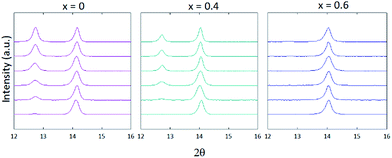 | ||
| Fig. 1 Powder X-Ray patterns of MA1−xFAxPbI3 thin films where x = 0, 0.4 and 0.6. Patterns were measured immediately after synthesis (bottom trace) then through days 1, 3, 5, 7 and 10 (top trace). | ||
For compositions x ≥ 0.7, the hexagonal δ-phase is observed immediately after film fabrication. As previously observed for FAPI, increasing the annealing temperature to 180° C achieves full conversion to the perovskite α-phase for MA1−xFAxPbI3, x ≥ 0.8.32 However, these films convert back to the hexagonal δ-phase within 30 minutes of exposure to air. Suppression of δ-phase formation was observed for x = 0.7.
The presence of small amounts of PbI2 in the as-made films was found, for several values of x, to cause markedly increased rates of degradation. This was investigated further through the synthesis of x = 0.6 films that contained varying amounts of PbI2 in the as-made thin films. PXD analysis of these films over a 10 day period following exposure to air showed the intensity of the PbI2 (001) reflection grew most rapidly for samples that contained observable levels of PbI2 in the as-made sample (see ESI S3†). It is apparent from the data that phase pure perovskite films are required to suppress the growth rates of PbI2, as even trace amounts of PbI2 present in as-made films markedly catalyse the rate of further PbI2 formation. At the low moisture level used in this study neither sunlight nor laboratory lighting had a discernible effect on the rate of material degradation.
The kinetics of the decomposition of thin films of MA1−xFAxPbI3 0.0 ≤ x ≤ 0.6 were investigated through analysis of the rate of PbI2 phase formation. This was modelled through the following Johnson–Mehl–Avrami–Kolmogorov (JMAK) equation,
| α = 1 − exp(−(kt)m) | (1) |
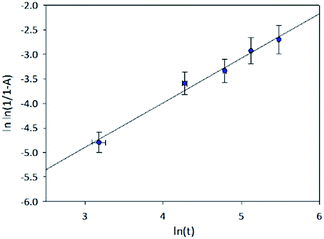
From the JMAK equation a linear relationship is expected when plotting ln(t) with ln![[thin space (1/6-em)]](https://www.rsc.org/images/entities/char_2009.gif) ln(1/1 − A) (Fig. 2). For x = 0.0–0.3 this linear relationship was observed up to 5 days. After this time, with very high levels of PbI2 present, the change in the peak area of the (001) PbI2 reflection is unlikely to be representative of the true phase fraction of PbI2 present in the surface of the film. For x ≥ 0.4, with the lower levels of PbI2 formed, the linearity was observed for the full duration of the 10 day study. Extracting the gradient and intercept of the linear model for each composition, x, a trend in rate constant modelled to a simple exponential decay can be observed (Fig. 3). It should be noted these results do not give absolute values for the rate constant of PbI2 formation, due to the peak area approximation employed to yield the level of PbI2. Nevertheless, the exponential decay seen in Fig. 3 demonstrates a clear trend of increasing resistance in MA1−xFAxPbI3 film degradation to PbI2 as x increases from 0.0 and approaches 0.6.
ln(1/1 − A) (Fig. 2). For x = 0.0–0.3 this linear relationship was observed up to 5 days. After this time, with very high levels of PbI2 present, the change in the peak area of the (001) PbI2 reflection is unlikely to be representative of the true phase fraction of PbI2 present in the surface of the film. For x ≥ 0.4, with the lower levels of PbI2 formed, the linearity was observed for the full duration of the 10 day study. Extracting the gradient and intercept of the linear model for each composition, x, a trend in rate constant modelled to a simple exponential decay can be observed (Fig. 3). It should be noted these results do not give absolute values for the rate constant of PbI2 formation, due to the peak area approximation employed to yield the level of PbI2. Nevertheless, the exponential decay seen in Fig. 3 demonstrates a clear trend of increasing resistance in MA1−xFAxPbI3 film degradation to PbI2 as x increases from 0.0 and approaches 0.6.
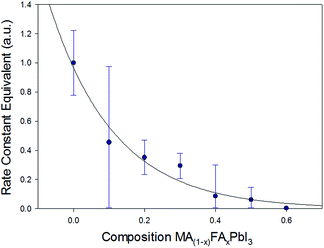 | ||
| Fig. 3 Rate constant equivalents for PbI2 growth fitted using an exponential decay function, calculated by extracting the intercept and gradient of linear models in the JMAK kinetic plots (Fig. 2), plotted using the peak area of the (001) PbI2 reflection as an approximation for the phase fraction of PbI2 transformed. | ||
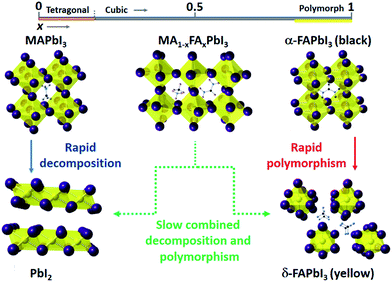
The degradation routes observed for MA1−xFAxPbI3 are summarised in Fig. 4. High rates of PbI2 formation are found for x ≤ 0.3, although increasing the FA content strongly suppresses this decomposition pathway. For x ≥ 0.7 this decomposition route competes with a phase transformation to the hexagonal δ-phase.
Morphology and crystallite size within the thin films are factors that might affect the degradation rate. Therefore SEM images were acquired for the as-prepared MA1−xFAxPbI3 films (ESI S5†). For films with x increasing from 0.0 to 0.6 the morphology was very similar and the average crystallite size (a few microns) only increased slightly with increasing FA content. For films with x = 0.7, which coincides with the appearance of a portion of the hexagonal δ-phase, a very different crystallite morphology and much larger crystallite size was observed. Therefore it seems likely that thermodynamics, as opposed to film morphology, is a major factor contributing to the decomposition kinetics.
To complement our experimental diffraction and kinetic measurements, we performed ab initio simulations on pure MAPI and a range of mixed MA/FA compositions to obtain insights into the trends in energetics of the degradation process. Such density functional theory (DFT) methods have been applied successfully to other recent studies on hybrid perovskites.34–36
Using direct calorimetric techniques, Navrotsky et al.37 have shown MAPI to be thermodynamically unstable with respect to decomposition to PbI2 and MAI. Here, the same intrinsic decomposition reaction was investigated involving the formation of PbI2 and organic iodides as well as decomposition to the δ-phase:
| MA1−xFAxPbI3 → (1 − x)MAI + xFAI + PbI2 | (2) |
Other decomposition routes and the effect of the cubic to tetragonal phase transition for MA-rich phases are discussed further in the ESI S4.† The reaction energies were calculated for a range of compositions (x) and the values are presented in Fig. 5. The results reveal three main features.
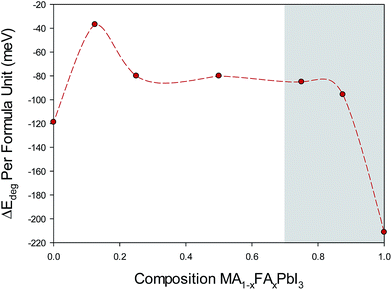 | ||
| Fig. 5 Calculated energies for the decomposition reaction (2) for MA1−xFAxPbI3 as a function of FA content (x). For consistent comparison, starting structural configurations based on pseudo-cubic, high order structures are presented here (with full data showing the same trends found in ESI S4†). The shaded region indicates that in the preparation of compositions x > 0.7 the yellow hexagonal (non-perovskite) polymorph is observed. | ||
First, pure MAPI shows a highly exothermic energy indicating thermodynamic instability with respect to the reaction products PbI2 and the organic iodide, which agrees well with experimental calorimetric measurements.37 Second, all the mixed MA1−xFAxPbI3 compositions (0.0 ≤ x ≤ 0.6) show less favourable energetics, and hence a greater degree of stability, than pure MAPbI3. These results are consistent with our observation that formation of PbI2 was suppressed for increasing FA content with only trace amounts of PbI2 found after 10 days for x = 0.6. We note that Brivio et al.38 find very small entropy terms for halide ion mixing in MAPI-based perovskites, which would further increase the stability of mixed cation compositions. Third, when we consider the decomposition reaction energy for perovskite-structured alpha-FAPbI3 we find a highly exothermic energy suggesting a thermodynamically unstable structure. Indeed, it is known that in the preparation of compositions x ≥ 0.7 the yellow hexagonal (non-perovskite) δ-phase is observed at room temperature.
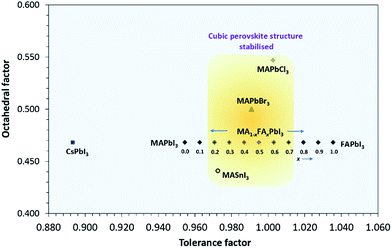
The kinetic and thermodynamic stability results are further supported through the theoretical optimum A-cation size suggested by the Goldschmidt and octahedral tolerance factors. Fig. 6 shows the effect of A site mixing on the Goldschmidt tolerance factor and octahedral factor, indicating which compositions are geometrically likely to adopt a cubic perovskite unit cell. Other well-known hybrid/inorganic halide perovskite compounds substituted at the A, B, or X sites are plotted for comparison. The octahedral factor is defined as:
 | (3) |
And the Goldschmidt tolerance factor as:
 | (4) |
In conclusion, thin films of the mixed organic cation perovskite system MA1−xFAxPbI3 undergo degradation in air to non-perovskite phases at a much slower rate than the end-member MAPI and FAPI phases. For example, the composition MA0.4FA0.6PbI3 synthesised with no contaminating PbI2 phase is stable in air for up to 10 days. Ab initio simulations of the decomposition reaction energies fully support the observed increased stability of the mixed A-cation perovskites. The reduced reactivity of these phases is likely to be related to suppression of the two possible degradation mechanisms of (i) decomposition to PbI2 and MAI, as found for MA-rich phases, and (ii) phase change as occurs for FA-rich phases. As FAPI does not degrade readily to FAI and PbI2, and MAPI adopts a single structure type, then any decomposition route of a mixed cation phase, such as MA0.4FA0.6PbI3, requires the simultaneous formation of three new structure types, namely yellow FAPI, PbI2 and MAI. We have shown that such a degradation route is less thermodynamically favourable and also has much slower kinetics. This combined experimental–computational study provides a greater understanding of the degradation routes of mixed A-cation perovskite halides, which is crucial for controlling and enhancing the long-term stability of perovskite solar cell materials.
Conflicts of interest
These is no conflict of interest to declare.Acknowledgements
B. C. and O. J. W. thank the EPSRC for PhD studentship funding via the EPSRC CDT in Sustainable Chemical Technologies (EP/G03768X/1, EP/L016354/1). J. D. and M. S. I. acknowledge support from the University of Bath (URS PhD studentship) and the Materials Chemistry Consortium (EP/L000202) for Archer HPC facilities.Notes and references
- G. Xing, N. Mathews, S. Sun, S. S. Lim, Y. M. Lam, M. Grätzel, S. Mhaisalkar and T. C. Sum, Science, 2013, 342, 344–347 CrossRef CAS PubMed.
- S. D. Stranks, G. E. Eperon, G. Grancini, C. Menelaou, M. J. P. Alcocer, T. Leijtens, L. M. Herz, A. Petrozza and H. J. Snaith, Science, 2013, 342, 341–344 CrossRef CAS PubMed.
- J. M. Ball, M. M. Lee, A. Hey and H. J. Snaith, Energy Environ. Sci., 2013, 6, 1739 CAS.
- H. J. Snaith, J. Phys. Chem. Lett., 2013, 4, 3623–3630 CrossRef CAS.
- S. D. Stranks, V. M. Burlakov, T. Leijtens, J. M. Ball, A. Goriely and H. J. Snaith, Phys. Rev. Appl., 2014, 2, 34007 CrossRef.
- M. T. Klug, A. Osherov, A. A. Haghighirad, S. D. Stranks, P. R. Brown, S. Bai, J. T.-W. Wang, X. Dang, V. Bulović, H. J. Snaith and A. M. Belcher, Energy Environ. Sci., 2017, 10, 236–246 CAS.
- J. J. B. K. Xerxes Steirer, P. Schulz, G. Teeter, V. Stevanovic, M. Yang and K. Zhu, ACS Energy Lett., 2016, 1, 360–366 CrossRef.
- M. A. Green, K. Emery, Y. Hishikawa, W. Warta, E. D. Dunlop, D. H. Levi and A. W. Y. Ho-Baillie, Prog. Photovolt. Res. Appl., 2017, 25, 3–13 CrossRef.
- W. Rehman, D. P. McMeekin, J. B. Patel, R. L. Milot, M. B. Johnston, H. J. Snaith and L. M. Herz, Energy Environ. Sci., 2017, 10, 361–369 CAS.
- H. Kim, J. Seo and N. Park, ChemSusChem, 2016, 9, 2528–2540 CrossRef CAS PubMed.
- D. Li, P. Liao, X. Shai, W. Huang, S. Liu, H. Li, Y. Shen and M. Wang, RSC Adv., 2016, 6, 89356–89366 RSC.
- M. T. Klug, A. Osherov, A. A. Haghighirad, S. D. Stranks, P. R. Brown, S. Bai, J. T. Wang, X. Dang, V. Bulovic, H. J. Snaith and A. M. Belcher, Energy Environ. Sci., 2017, 10, 236–246 CAS.
- C. C. Stoumpos, C. D. Malliakas and M. G. Kanatzidis, Inorg. Chem., 2013, 52, 9019–9038 CrossRef CAS PubMed.
- T. Leijtens, G. E. Eperon, N. K. Noel, S. N. Habisreutinger, A. Petrozza and H. J. Snaith, Adv. Energy Mater., 2015, 5, 1500963 CrossRef.
- M. T. Weller, O. J. Weber, P. F. Henry, A. M. Di Pumpo and T. C. Hansen, Chem. Commun., 2015, 51, 4180–4183 RSC.
- M. T. Weller, O. J. Weber, J. M. Frost and A. Walsh, J. Phys. Chem. Lett., 2015, 6, 3209–3212 CrossRef CAS.
- D. H. Fabini, C. C. Stoumpos, G. Laurita, A. Kaltzoglou, A. G. Kontos, P. Falaras, M. G. Kanatzidis and R. Seshadri, Angew. Chem., Int. Ed., 2016, 55, 15392–15396 CrossRef CAS PubMed.
- T. Chen, B. J. Foley, C. Park, C. M. Brown, L. W. Harriger, J. Lee, J. Ruff, M. Yoon, J. J. Choi and S.-H. Lee, Sci. Adv., 2016, 2(10), 1601650 Search PubMed.
- D. Araújo, M. J. Romero, F. Morier-Genoud and R. García, Mater. Sci. Eng., B, 1999, 66, 151–156 CrossRef.
- G. Kieslich, S. Sun and A. K. Cheetham, Chem. Sci., 2014, 5, 4712–4715 RSC.
- C. Yi, J. Luo, S. Meloni, A. Boziki, N. Ashari-Astani, C. Grätzel, S. M. Zakeeruddin, U. Rothlisberger and M. Grätzel, Energy Environ. Sci., 2015, 9, 656–662 Search PubMed.
- Y. Zhang, G. Grancini, Y. Feng, A. M. Asiri and M. K. Nazeeruddin, ACS Energy Lett., 2017, 2, 802–806 CrossRef CAS.
- Y. Huang, L. Li, Z. Liu, H. Jiao, Y. He, X. Wang, R. Zhu, D. Wang, J. Sun, Q. Chen and H. Zhou, J. Mater. Chem. A, 2017, 14, 38–44 Search PubMed.
- W. Rehman, D. P. McMeekin, J. B. Patel, R. L. Milot, M. B. Johnston, H. J. Snaith and L. M. Herz, Energy Environ. Sci., 2017, 131, 6050–6051 Search PubMed.
- A. Binek, F. C. Hanusch, P. Docampo and T. Bein, J. Phys. Chem. Lett., 2015, 6, 1249–1253 CrossRef CAS PubMed.
- M. T. Weller, O. J. Weber and B. Charles, J. Mater. Chem. A, 2016, 4, 15375–15382 Search PubMed.
- J. T. Jacobsson, J. P. Correa Baena, M. Pazoki, M. Saliba, K. Schenk, M. Grätzel and A. Hagfeldt, Energy Environ. Sci., 2016, 9, 1706–1724 Search PubMed.
- Z. Yang, C.-C. Chueh, P.-W. Liang, M. Crump, F. Lin, Z. Zhu and A. K.-Y. Jen, Nano Energy, 2016, 22, 328–337 CrossRef CAS.
- C. Wang, C. Xiao, Y. Yu, D. Zhao, R. A. Awni, C. R. Grice, K. Ghimire, D. Constantinou, W. Liao, A. J. Cimaroli, P. Liu, J. Chen, N. J. Podraza, C.-S. Jiang, M. M. Al-Jassim, X. Zhao and Y. Yan, Adv. Energy Mater., 2017, 1700414 CrossRef.
- A. Pisanu, C. Ferrara, P. Quadrelli, G. Guizzetti, M. Patrini, C. Milanese, C. Tealdi and L. Malavasi, J. Phys. Chem. C, 2017, 121, 8746–8751 CAS.
- A. M. A. Leguy, Y. Hu, M. Campoy-Quiles, M. I. Alonso, O. J. Weber, P. Azarhoosh, M. van Schilfgaarde, M. T. Weller, T. Bein, J. Nelson, P. Docampo and P. R. F. F. Barnes, Chem. Mater., 2015, 27, 3397–3407 CrossRef CAS.
- V. L. Pool, B. Dou, D. G. Van Campen, T. R. Klein-Stockert, F. S. Barnes, S. E Shaheen, M. I. Ahmad, M. F. A. M. van Hest and M. F. Toney, Nat. Commun., 2017, 8, 14075 CrossRef CAS PubMed.
- M. Fanfoni and M. Tomellini, Il Nuovo Cimento D, 1998, 20, 1171–1182 CrossRef.
- C. Eames, J. M. Frost, P. R. F Barnes, B. C. O'Regan, A. Walsh and M. S. Islam, Nat. Commun., 2015, 6, 7497 CrossRef CAS PubMed.
- N. Aristidou, C. Eames, I. Sanchez-Molina, X. Bu, J. Kosco, M. S. Islam and S. A. Haque, Nat. Commun., 2017, 8, 15218 CrossRef PubMed.
- J. A. Dawson, A. J. Naylor, C. Eames, M. Roberts, W. Zhang, H. J. Snaith, P. G. Bruce and M. S. Islam, ACS Energy Lett., 2017, 2, 1818 CrossRef CAS.
- G. P. Nagabhushana, R. Shivaramaiah and A. Navrotsky, Proc. Natl. Acad. Sci. U. S. A., 2016, 113, 7717–7721 CrossRef CAS PubMed.
- F. Brivio, C. Caetano and A. Walsh, J. Phys. Chem. Lett., 2016, 7, 1083 CrossRef CAS PubMed.
- G. Kieslich, S. Sun and A. K. Cheetham, Chem. Sci., 2015, 6, 3430–3433 RSC.
- W. Travis, E. N. K. Glover, H. Bronstein, D. O. Scanlon and R. G. Palgrave, Chem. Sci., 2016, 7, 4548–4556 RSC.
Footnote |
| † Electronic supplementary information (ESI) available: Synthesis and characterisation methods, SEM micrographs, additional PXD patterns and kinetic analysis. Experimental and ab initio simulation methods. See DOI: 10.1039/c7ta08617b |
| This journal is © The Royal Society of Chemistry 2017 |

