 Open Access Article
The effect of the LiCoO2/Li7La3Zr2O12 ratio on the structure and electrochemical properties of nanocomposite cathodes for all-solid-state lithium batteries†
Hiroaki
Wakayama
 * and
Yasuaki
Kawai
Toyota Central R&D Laboratories, Inc., Nagakute, Aichi 480-1192, Japan. E-mail: wakayama@mosk.tytlabs.co.jp; Fax: +81-561-63-6125; Tel: +81-561-71-7861
First published on 11th August 2017
Abstract
Using a self-assembled block copolymer (BCP) structure as a template, an inorganic nanocomposite consisting of a cathode active material (LiCoO2) and an electrolyte (Li7La3Zr2O12) was synthesized as a candidate electrode material for all-solid state lithium batteries. The precursors of the cathode active material and those of the electrolyte were introduced into separate polymer blocks of the BCP, and then calcination was used to remove the BCP template and crystallize the cathode active material and the electrolyte. The LiCoO2/Li7La3Zr2O12 ratio that produced the optimum electrode structure was determined: the ratio of 90% resulted in the maximum capacity per active material, 135 mA h g−1, which is 98% of the theoretical value for LiCoO2. The obtained capacity was substantially larger than the values reported for other cathodes used in all-solid-state lithium batteries. The implication is that at the optimum LiCoO2/Li7La3Zr2O12 ratio, nanoscale three-dimensional conducting paths and an electrochemically effective interface between the active material and the electrolyte are formed as a result of templating by the self-assembled BCP structure.
1. Introduction
Lithium secondary batteries are widely used in consumer electronics, mobile phones, personal computers, and hybrid and electric vehicles. However, several problems with the safety, performance, and cost of these batteries remain to be solved, in particular, the safety problem presented by the flammable liquid electrolytes that are conventionally used.An alternative proposed as safe, reliable next-generation storage devices is all-solid-state lithium secondary batteries, which contain solid electrolytes. However, they present several challenges, such as the relatively poor ionic conductivity of solid electrolytes, low energy density, and, most importantly, low cathode capacity.
The main components of electrodes are the active materials and the electrolytes. To increase the capacity per electrode, the electrolyte content must be reduced as much as possible, and the utilization rate of the active materials must be high. However, lowering the electrolyte content decreases the conduction paths and thus decreases the utilization rate of the active materials, owing to limited charge transfer.
All-solid-state lithium batteries have solid–solid interfaces between the solid electrolytes and the solid active materials, whereas conventional lithium batteries have liquid–solid interfaces between the liquid electrolytes and the solid active materials. In attempts to construct electrochemically effective interfaces between electrolytes and active materials in all-solid-state lithium batteries, various methods have been used, including mechanochemical methods,1–9 thin films10–12 and three-dimensional structures.13–16 However, none of the methods investigated so far has resulted in a sufficiently high electrode capacity.
Some research on controlling the active material/electrolyte ratio to maximize cathode capacity has been conducted, and electrode capacities of 18.9–56.0 mA h g−1 at active material/electrolyte ratios of 37.7–70.0% have been achieved.11 However, the construction of optimized electrode structures that make the most of active materials and thus show high cathode capacity remains a challenge.
We have developed a process using a self-assembled block copolymer (BCP) structure as a template for the synthesis of an inorganic nanocomposite.17 In this study, we extended this process to the synthesis of nanocomposite oxides to evaluate the relationship between structures and electrochemical properties of electrode materials in all-solid-state Li ion batteries. The commonly used methods of synthesizing electrodes for all-solid-state Li-ion batteries use calcined particles of active materials roughly several microns in size. These particles are mixed with electrolyte microparticles and compressed into electrodes,1–9 the structures of which are mixtures on a scale of several microns in size. We hypothesized that use of self-assembled BCP templates would result in the formation of composite electrode structures on a scale of several tens of nanometers, two orders of magnitude smaller than the scale reported for commonly used synthetic methods, the result being a large interface between active materials and electrolytes. In this study, for the purpose of the optimization of the ratio of cathode active materials and electrolytes, various ratios of the precursors of the cathode active material (LiCoO2, LCO) and those of the electrolyte (Li7La3Zr2O12, LLZ) were introduced into a separate block of the BCP. Then calcination was used to remove the BCP template and crystallize the cathode active material and the electrolyte. The LiCoO2/Li7La3Zr2O12 ratio was adjusted to optimize the electrode structure, and the capacity was highest at the optimized cathode active material/electrolyte ratio. The implication is that at the optimum LCO/LLZ ratio, self-assembly of the precursor-containing BCP and subsequent calcination resulted in the formation of a nanocomposite with nanoscale, three-dimensional conducting paths and an electrochemically effective interface between the cathode active material and the electrolyte.
2. Experimental
Nanocomposite preparation
In a typical preparation procedure, lithium benzoate (C6H5COOLi, Sigma-Aldrich), tetrakis(2,4-pentanedionato) zirconium(IV) [Zr(acac)4, Tokyo Chemical Industries], lanthanum 2-ethylhexanoate toluene solution [La(C7H15COO)3, Wako Pure Chemical Industries, La 7%], dicobalt octacarbonyl [Co2(CO)8, Sigma-Aldrich], and N,N′-diphenyl-N,N′-di-p-tolylbenzene-1,4-diamine (C32H28N2, Sigma-Aldrich) were dissolved in a 0.5 wt% solution of polystyrene-b-poly(4-vinylpyridine) (PS-P4VP, polymer source, MPSn = 20.5 kg mol−1, MP4VPn = 36.0 kg mol−1, polydispersity index = 1.08) in a 78![[thin space (1/6-em)]](https://www.rsc.org/images/entities/char_2009.gif) :
:![[thin space (1/6-em)]](https://www.rsc.org/images/entities/char_2009.gif) 12 (v/v) mixture of toluene (Wako) and N,N-dimethylformamide (Wako). The Co2(CO)8/styrene and Co2(CO)8/C32H28N2 molar ratios were 1.0 and 0.5, respectively, and the LCO/LLZ ratio was 0.7–0.975. The solution was stirred and then transferred to a Petri dish and the residue was calcined up to 1023 K and maintained at that temperature for 6 h under a flow of air.
12 (v/v) mixture of toluene (Wako) and N,N-dimethylformamide (Wako). The Co2(CO)8/styrene and Co2(CO)8/C32H28N2 molar ratios were 1.0 and 0.5, respectively, and the LCO/LLZ ratio was 0.7–0.975. The solution was stirred and then transferred to a Petri dish and the residue was calcined up to 1023 K and maintained at that temperature for 6 h under a flow of air.
Nanocomposite characterization
Scanning transmission electron microscopy (STEM) and energy dispersive X-ray (EDX) spectroscopy mapping images were obtained with a JEOL JEM-2010 FEF(HR) transmission electron microscope. Three-dimensional EDX spectra were obtained with a JEOL JEM-ARM200F Dual-X atomic resolution analytical electron microscope. X-ray diffraction (XRD) patterns were collected on a Rigaku RINT-TTR (Cu Kα) operated at 40 kV and 50 mA. Scanning electron microscopy images were obtained with a Hitachi S-3600N scanning electron microscope.Electrochemical measurements
Polyethylene oxide (Sigma-Aldrich, MW = 600 K) doped with lithium bis(trifluoromethylsulfonyl)imide (Wako) was used as an electrolyte separator. Lithium metal was used as an active anode. Dense pellets of the LCO/LLZ nanocomposite with a thickness of 25 µm were prepared by pressing calcined samples onto Ni metal current collectors. The electrochemical properties were measured by cyclic voltammetry using a potentio-galvanostat equipped with an impedance analyzer (BioLogic, VMP3). The electrode potential was swept between 3.0 and 4.2 V at a potential sweep rate of 0.05 mV s−1. Charge–discharge curves were measured at a voltage between 3.0 and 4.2 V versus lithium and at a current density of 0.04 mA cm−2.3. Results and discussion
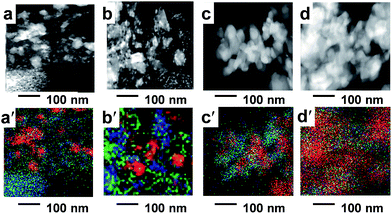
The scanning electron microscopy images of calcined samples prepared with various LCO content ratios are shown in Fig. 1a–d, along with the corresponding overlapping images of Co, Zr, and La (Fig. 1a′–d′). The images revealed nanoparticles on a scale of several tens of nanometers. A continuous structure consisting of LCO and LLZ was apparent at an LCO content ratio of 0.9 (Fig. 1c′). The STEM image of a spin-coated BCP–precursor nanocomposite sample with an LCO content ratio of 0.9 (Fig. S1†) revealed a self-assembled structure of spheres in a matrix (sphere diameter, ∼80 nm; repeat distance, ∼80–100 nm). EDX elemental analysis enabled the detection of the Co precursor in the spheres and the Zr and La precursors in the matrix (Table S1†). That is, the precursor of the active material (LCO) and the electrolyte (LLZ) had been selectively introduced into the spherical polymer block and into the matrix, respectively, forming a microphase-separated structure templated by the self-assembled BCP structure. The sphere formation was driven by the selective dissolution of the PS block in the toluene-based solvent18 which resulted in dissolution of the Co precursors into the P4VP block.The STEM images of samples obtained by calcining BCP–precursor nanocomposites at 723 K show that the self-assembled spheres-in-a-matrix structure was preserved after removal of the BCP and that the diameter of the spheres increased with decreasing Co concentration (Fig. S2a–c†). EDX maps of a calcined sample with an LCO content ratio of 0.9 clearly show that isolated Co spheres (diameter, 20–40 nm) were surrounded by a matrix of Zr and La (Fig. S2d–f†). Co was distributed in the bright areas in the dark-field STEM image; these areas correspond to more-electron-dense spheres than the surrounding matrix, which suggests that Co was densely distributed in the areas of crystallized LCO. In contrast, Zr and La were located in the dark area even though their electron densities are higher than the electron density of Co. This result suggests that La and Zr were sparsely distributed in the noncrystalline matrix.
At LCO content ratios of 0.7 and 0.8, a discontinuous LCO structure was observed (Fig. 1a′ and b′). As the LCO/LLZ ratio was increased, the LCO spread throughout the matrix (Fig. 1c′ and d′), becoming continuous while the structure of LLZ became discontinuous (Fig. 1d′). As the amount of LLZ decreased, the LCO nanoparticles likely agglomerated (Fig. 1d′).
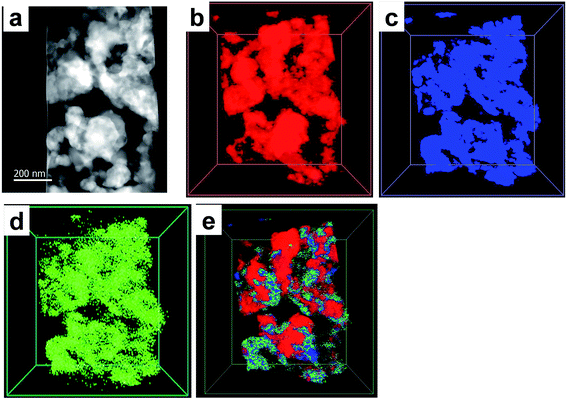
A high-angle annular dark-field STEM image of the sample prepared with an LCO content ratio of 0.9 was obtained (Fig. 2a), and three-dimensionally reconstructed EDX maps of Co, La, and Zr and the corresponding overlapped image were prepared (Fig. 2b–e). The EDX maps show that Zr and La were generally co-located and were present in the gaps between the Co nanoparticles. Most of the Co nanoparticles were spherical with diameters of 100–200 nm, whereas the particles of La and Zr were in an indeterminate form. The three-dimensionally reconstructed EDX maps of Co, La, and Zr, show that areas of co-located La and Zr surrounded three-dimensionally aggregated Co nanoparticles (Fig. 2b–e).
Fig. 3 is a schematic representation of the synthetic procedures using self-assembled BCP templates. BCP and precursors of LCO and LLZ were dissolved in a solution (Fig. 3a). Self-assembled structures of micro-phased polymer blocks containing precursors of LCO (core) and of LLZ (matrix) were formed in separate polymer blocks (Fig. 3b). After calcination, bicontinuous structures of LCO and LLZ were assembled (Fig. 3c). The nanocomposites used in this study were synthesized using a BCP composed of a PS polymer block containing the LLZ precursors and a P4VP polymer block containing the LCO precursors. During calcination, precursors that had condensed in polymer blocks of several tens of nanometers in width aggregated and crystallized. In contrast, in the synthesis of LCO/LLZ cathode materials for conventional all-solid-state lithium batteries, microparticulate precursors are used. High temperatures (>1073 K) are required for crystallization, owing to the need for diffusion and reaction of the precursors. Mutual diffusion of the precursors leads to the production of byproducts such as La2CoO4.19 When the method described in this paper was used, the LCO precursors diffused only a small distance before reacting with neighboring LCO precursors in the same polymer block, which was only several tens of nanometers wide. The implication is that reactions between the LCO and LLZ precursors that had condensed in different polymer blocks were suppressed and that continuous structures consisting of LCO and LLZ were therefore formed.
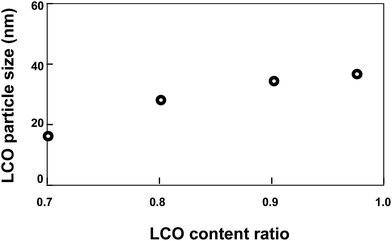
The relationship between LCO particle size and LCO content ratio (in the range from 0.7 to 0.975) in a sample calcined at 1023 K is shown in Fig. 4. As the LCO ratio increased, the LCO particle size increased.
LCO nanoparticles formed in the spherical structures of one of the polymer blocks of the BCP. Confinement of the LCO to an area with a size of several tens of nanometers and the co-existence of LLZ in the same area prevented aggregation of LCO nanoparticles in the LCO/LLZ nanocomposites. In nanocomposites that contained only a small amount of LLZ, the LCO aggregated because the amount of LLZ was insufficient to effectively prevent LCO aggregation.
XRD patterns of samples that were calcined at 1023 K and had LCO content ratios of 0.7–0.975 were obtained (Fig. 5). As the LCO/LLZ ratio increased, the LCO peaks increased and the LLZ peaks decreased. In the patterns of the samples with LCO content ratios of 0.7 and 0.8, peaks due to Li2CO3, La2O3, and LiOH–H2O impurities were observed (Fig. 5a and b). It has been suggested that Li2CO3 forms on the surface of LLZ by the reaction with CO2 after exposure to air.20,21 La2O3 and LiOH–H2O are produced as impurities during the synthesis of LLZ.22,23 The diffraction peaks of Li2CO3, La2O3, and LiOH–H2O in the calcined samples disappeared at LCO content ratios above 0.8 (Fig. 5c–e). This result was probably due to the gradual decrease of the LLZ content, and it was no longer detectable by XRD as the LCO content ratio increased from 0.9 to 0.975.
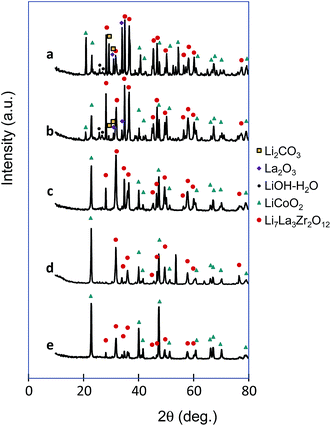 | ||
| Fig. 5 XRD patterns of calcined samples with LCO content ratios of 0.7 (a), 0.8 (b), 0.9 (c), 0.95 (d) and 0.975 (e). | ||
No significant impurity peaks were observed in the XRD patterns of the samples with LCO content ratios of 0.9–0.975. In this study, the LCO and LLZ precursors were introduced and condensed in the matrix of a BCP. Confinement of the precursors to a space of several tens of nanometers in the polymer block and the ease of diffusion in the polymer block prevented the formation of byproducts. However, when the LCO content ratio was 0.7 and 0.8, the LLZ spread into larger areas, LCO mixed with LLZ and byproducts formed.
In the scanning electron microscopy images of the samples with LCO content ratios of 0.7 and 0.8 (Fig. S3a and b†), many small nanoparticles that had aggregated into structures separated by cracks on a scale of several tens of micrometers were observed, and long shallow cracks were apparent in the sample with an LCO content ratio of 0.95 (Fig. S3d†), whereas continuous structures were observed in samples with LCO content ratios of 0.9 and 0.975 (Fig. S3c and e†).
Cole–Cole plots and plots of impedance versus LCO content ratio for all-solid-state lithium batteries fabricated from calcined samples with LCO content ratios of 0.7–0.975 are shown in Fig. 6a and b, respectively. Impedance, which was estimated from the Cole–Cole plots, was lowest at an LCO content ratio of 0.9. The impedance decreased as the LCO content ratio increased from 0.7 to 0.9. The XRD results show that the samples with LCO content ratios of 0.7 and 0.8 contained LCO, LLZ, and Li2CO3, La2O3, and LiOH–H2O impurities. Considering that Li2CO3, La2O3, and LiOH–H2O are high-resistance phases that hinder Li+ transport and decrease ion conductivity, it is reasonable to assume that the larger amounts of Li2CO3, La2O3, and LiOH–H2O in the sample with an LCO content ratio of 0.7 led to the lower observed ionic conductivity relative to samples with higher LCO content ratios.
Impedances were estimated with fitted data based on an equivalent circuit model consisting of two parallel resistance–capacitance (R–C) and capacitance (C) contributions (RbCb)(RgbCgb)(Cel), where the subscripts b, gb, and el denote the bulk, grain-boundary, and electrode, respectively.24 The increase of the impedance as the LCO content ratio increased from 0.9 to 0.975 was probably caused by the formation of discontinuous LLZ structures as the LCO/LLZ ratio increased: these structures, which were observed in the STEM images and EDX mapping images, prevented Li+ transport and decreased ionic conductivity. The calcined samples were compressed into discs for electrochemical measurements. As a result, dense aggregates were obtained. Although cracks were observed in the scanning electron microscope images of the calcined samples with LCO contents of 0.7, 0.8, and 0.95, the macroscopic structures observed in the scanning electron microscope images probably did not significantly affect the impedances compared with the effects of the microscopic structures observed in the STEM images and EDX mapping images.
Cyclic voltammograms of calcined samples with LCO content ratios of 0.7–0.975 were measured (Fig. 7). The charge–discharge current increased as the LCO content ratio increased from 0.7 to 0.9, that is, as the LCO/LLZ ratio increased. This behavior was due to an increase in the quantity of impurities as the LCO/LLZ ratio decreased, as indicated by the XRD results. As the LCO content ratio was increased from 0.9 to 0.975, the charge–discharge current decreased. The charge–discharge peaks were broad in the voltammograms of samples with LCO content ratios of 0.95 and 0.975.
The impedance of an all-solid-state lithium battery fabricated with calcined samples with LCO content ratios of 0.9–0.975 increased with increasing LCO/LLZ is shown in Fig. 6. The increased impedance in turn resulted in a drop in charge–discharge voltage as the amount of LLZ decreased.
The cyclic voltammograms and discharge capacities from cyclic voltammograms for all-solid-state lithium batteries fabricated from nanocomposite calcined samples with LCO content ratios of 0.7–0.975 are shown in Fig. 7. Discharge capacity increased with increasing LCO content ratio from 0.7 to 0.9, reaching a maximum at 0.9, and then decreased with increasing LCO content ratio from 0.9 to 0.975.
In the LCO content ratio range of 0.7–0.9, samples with more LLZ contained more of the Li2CO3, La2O3, and LiOH–H2O impurities, as indicated by the XRD results (Fig. 5). As the impurity content increased with increasing LLZ content, the impedance of the all-solid-state lithium batteries fabricated with these samples increased (Fig. 6). As a result, the capacity of the batteries decreased with increasing LLZ content.
For samples with LCO content ratios of 0.9–0.975, impedance increased with decreasing LLZ content, and the capacity decreased with decreasing LLZ content.
As shown in Fig. 8, the high capacity (135 mA h g−1) was obtained with a nanocomposite sample having an LCO content ratio of 0.9, which is much higher than the values reported for other all-solid-state lithium batteries.1–16 The excellent electrochemical properties of the electrode fabricated with the optimized nanocomposite can be ascribed to its unique three-dimensional bicontinuous structure on a scale of several tens of nanometers, which is 2 orders of magnitude smaller than the scale reported previously for composite electrodes fabricated from calcined microparticles.1–9 Our results suggest that conductive paths were most effectively formed in the sample with an LCO content ratio of 0.9 and minimal impurities. In contrast, the STEM images and the electrochemical properties suggest that in samples with little LLZ, and in samples containing impurities, conductive paths and an electrochemically effective LCO/LLZ interface were not effectively formed.
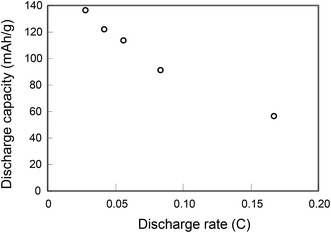
Charge–discharge curves and cycling performance of a calcined sample with an LCO content ratio of 0.9 at a rate of 1/6C are shown in Fig. 9. The good cycling performance apparent in Fig. 9b shows that the all-solid-state Li-ion battery ran smoothly at a rate of 1/6C.
 | ||
| Fig. 9 Charge–discharge curves and cycling performance for the calcined sample with an LCO content ratio of 0.9 at the rate of 1/6C. | ||
4. Conclusions
Nanocomposite materials consisting of a cathode active material and an electrolyte for all-solid-state lithium batteries were synthesized by using a self-assembled BCP structure as a template. The ratio of the cathode active material to the electrolyte was adjusted to optimize the electrode structure and the capacity was highest at the optimized cathode active material/electrolyte ratio. The capacity was substantially larger than the capacities reported for other cathodes used in all-solid-state lithium batteries. At the optimized active material/electrolyte ratio, nanoscale conductive paths and an electrochemically effective interface are formed in this nanocomposite synthesized by means of templating with a BCP.This versatile technique can be expected to be applicable also to the preparation of other highly functional nanocomposite materials and devices such as quantum dot solar cells, thermoelectric materials, and solid oxide fuel cells.
Conflicts of interest
The authors declare no competing financial interest.References
- K. H. Kim, Y. Iriyama, K. Yamamoto, S. Kumazaki, T. Asaka, K. Tanabe, C. A. J. Fisher, T. Hirayama, R. Murugan and Z. Ogumi, J. Power Sources, 2011, 196, 764–767 CrossRef CAS.
- T. Kato, T. Hamanaka, K. Yamamoto, T. Hirayama, F. Sagane, M. Motoyama and Y. Iriyama, J. Power Sources, 2014, 260, 292–298 CrossRef CAS.
- M. E. Donders, W. M. Arnoldbik, H. C. M. Knoops, W. M. M. Kessels and P. H. L. Notten, J. Electrochem. Soc., 2013, 160, A3066–A3071 CrossRef CAS.
- A. Sakuda, A. Hayashi and M. Tatsumisago, Chem. Mater., 2010, 22, 949–956 CrossRef CAS.
- K. Chen, Y. Shen, Y. Zhang, Y. Lin and C. Nan, J. Power Sources, 2014, 249, 306–310 CrossRef CAS.
- Y. J. Nam, S. J. Cho, D. Y. Oh, J. M. Lim, S. Y. Kim, J. H. Song, Y. G. Lee, S. Y. Lee and Y. S. Jung, Nano Lett., 2015, 15, 3317–3323 CrossRef CAS PubMed.
- S. Ito, A. Unemoto, H. Ogawa, T. Tomai and I. Honma, J. Power Sources, 2012, 208, 271–275 CrossRef CAS.
- H. Kitaura, A. Hayashi, T. Ohtomo, S. Hama and M. Tatsumisago, J. Mater. Chem., 2011, 21, 118–124 RSC.
- T. Ohtomo, F. Mizuno, A. Hayashi, K. Tadanaga and M. Tatsumisago, J. Power Sources, 2005, 146, 715–718 CrossRef CAS.
- M. Tatsumisago, F. Mizuno and A. Hayashi, J. Power Sources, 2006, 159, 193–199 CrossRef CAS.
- F. Mizuno, A. Hayashi, K. Tadanaga and M. Tatsumisago, J. Power Sources, 2005, 146, 711–714 CrossRef CAS.
- A. Sakuda, A. Hayashi and M. Tatsumisago, Sci. Rep., 2013, 3, 2261 CrossRef PubMed.
- M. M. Shaijumon, E. Perre, B. Daffos, P. L. Taberna, J. M. Tarascon and P. Simon, Adv. Mater., 2010, 22, 4978–4981 CrossRef CAS PubMed.
- M. Hara, H. Nakano, K. Dokko, S. Okuda, A. Kaeriyama and K. Kanamura, J. Power Sources, 2009, 189, 485–489 CrossRef CAS.
- M. Kotobuki, Y. Suzuki, H. Munakata, K. Kanamura, Y. Sato, K. Yamamoto and T. Yoshida, J. Power Sources, 2010, 195, 5784–5788 CrossRef CAS.
- J. C. Meiner, A. Quintel-Ritzi, J. Mlynek, H. Elbs and G. Krausch, Macromolecules, 1997, 30, 4945–4951 CrossRef.
- H. Wakayama, H. Yonekura and Y. Kawai, ACS Macro Lett., 2013, 2, 284–287 CrossRef CAS.
- C. Burda, X. Chen, R. Narayan and M. A. El-Sayed, Chem. Rev., 2005, 105, 1025–1102 CrossRef CAS PubMed.
- K. H. Kim, Y. Iriyama, K. Yamamoto, S. Kumazaki, T. Asaka, K. Tanabe, C. A. J. Fisher, T. Hirayama, R. Murugan and Z. Ogumi, J. Power Sources, 2011, 196, 764–767 CrossRef CAS.
- L. Cheng, E. J. Crumlin, W. Chen, R. Qiao, H. Hou, S. F. Lux, V. Zorba, R. Russo, R. Kostecki, Z. Liu, K. Persson, W. Yang, J. Cabana, T. Richardson, G. Chen and M. Doeff, Phys. Chem. Chem. Phys., 2014, 16, 18294–18300 RSC.
- Y. Wang and W. Lai, J. Power Sources, 2015, 275, 612–620 CrossRef CAS.
- M. Matsui, K. Sakamoto, K. Takahashi, A. Hirano, Y. Takeda, O. Yamamoto and N. Imanishi, Solid State Ionics, 2014, 262, 155–159 CrossRef CAS.
- G. Hongxia, C. Kai, Y. Di, M. Ao, H. Mian, L. Yuanhua and N. Cewen, Rare Met. Mater. Eng., 2016, 45, 612–616 CrossRef.
- V. Thangadurai and W. Weppner, Adv. Funct. Mater., 2005, 15, 107–112 CrossRef CAS.
Footnote |
| † Electronic supplementary information (ESI) available. See DOI: 10.1039/c7ta05527g |
| This journal is © The Royal Society of Chemistry 2017 |

