
 Open Access Article
 This Open Access Article is licensed under a
 Creative Commons Attribution 3.0 Unported Licence
Hydrogen storage in polymer-based processable microporous composites†
Sébastien
Rochat
 *a,
Katarzyna
Polak-Kraśna
b,
Mi
Tian
c,
Leighton T.
Holyfield
cd,
Timothy J.
Mays
c,
Christopher R.
Bowen
b and
Andrew D.
Burrows
*a
*a,
Katarzyna
Polak-Kraśna
b,
Mi
Tian
c,
Leighton T.
Holyfield
cd,
Timothy J.
Mays
c,
Christopher R.
Bowen
b and
Andrew D.
Burrows
*a
aDepartment of Chemistry, University of Bath, Bath, BA2 7AY, UK. E-mail: s.rochat@bath.ac.uk; a.d.burrows@bath.ac.uk
bDepartment of Mechanical Engineering, University of Bath, Bath, BA2 7AY, UK
cDepartment of Chemical Engineering, University of Bath, Bath, BA2 7AY, UK
dDoctoral Training Centre in Sustainable Chemical Technologies, University of Bath, Bath, BA2 7AY, UK
First published on 23rd August 2017
Abstract
We report on a series of composites based on a polymer of intrinsic microporosity matrix (PIM-1) containing a high surface area porous aromatic framework filler (PAF-1). The hydrogen uptake and mechanical properties of the composites are presented along with an assessment of their potential for integration into high-pressure hydrogen storage tanks, either to increase storage capacity or to reduce operating pressure for the same uptake. The composites are more stable and processable than systems such as finely divided physisorbent materials, and they can be made into self-standing films. In addition to retaining the processability of PIM-1, they also possess enhanced surface areas and pore volumes approximately proportional to the amount of incorporated PAF-1. Hydrogen uptake measurements combined with theoretical modelling show that the composites can store up to 6.7 wt% H2 at 77.4 K. Tensile testing and dynamic mechanical thermal analyses indicate decreasing stress and strain to failure with increasing proportion of PAF-1, although the processability and elasticity of the compounds are maintained until the weight percentage of filler reaches 30%. These lightweight composites show promise as effective hydrogen storage materials, especially for applications where pressures up to 7.5 MPa are required. We also provide guidelines for the design of polymer-based porous composites for gas storage or separation.
Introduction
Hydrogen is an attractive, potentially carbon-free energy carrier that is widely expected to play a significant role in a post-fossil fuel global economy. It has an exceptional gravimetric energy density (with a higher heating value of 142 MJ kg−1) and is abundantly available from water and biomass, but its low volumetric energy density at ambient conditions makes it largely impractical for many real applications.1 A potential solution to this problem is to design low-cost, lightweight materials that are able to reversibly store significant amounts of hydrogen at close to ambient conditions. In this context, the US Department of Energy (DoE) recently set a 2025 hydrogen storage system target of 55 g H2 per kg (5.5 wt%) for onboard hydrogen storage systems in light-duty fuel cell vehicles.2 This value applies to an entire storage system, meaning that the performance of the storage material itself has to be considerably higher in order to compensate for the mass of the tank and valves, regulators, piping and other balance-of-plant equipment.Solid-state hydrogen storage has the potential to significantly improve upon conventional forms of technologies such as liquefaction or compression.3 Adsorbents with large surface areas and high hydrogen uptakes incorporated into storage tanks can, in principle, improve the volumetric density of stored hydrogen, or decrease the operating pressure for a given amount of H2 stored. As a result, numerous materials have been developed in recent years that are able to store significant amounts of hydrogen via physisorption.4 Since the capacity of a material for H2 physisorption increases with its surface area, investigations of highly porous materials have been reported5 with particular emphasis on zeolites,6 activated carbons,7 metal–organic frameworks (MOFs),8 covalent organic frameworks (COFs),9 porous aromatic frameworks (PAFs),10 and microporous polymers.11 Several studies have demonstrated that while a large pore volume is necessary, the size of the pores needs to be tuned in order to maximize the hydrogen uptake. In this context, nanosized pores provide the most stabilizing environment as H2 molecules can interact with opposite pore walls.12 As a result, increasing the pore volume without controlling the pore size may lead to a decrease of the H2 adsorption capacity. When pores are significantly larger than the kinetic diameter of H2 (0.289 nm![[thin space (1/6-em)]](https://www.rsc.org/images/entities/char_2009.gif) 13), there can be unused void volume at the center of the pores, which reduces the volumetric uptake. Consequently, microporous materials (i.e., with pores smaller than 2 nm) with high surface areas and low densities are ideally suited for hydrogen storage applications.8a
13), there can be unused void volume at the center of the pores, which reduces the volumetric uptake. Consequently, microporous materials (i.e., with pores smaller than 2 nm) with high surface areas and low densities are ideally suited for hydrogen storage applications.8a
Despite promising successes, one of the main drawbacks of many of the above-mentioned materials is that they exist in powder or particulate forms, which limits their processability and mechanical properties. In this work, we are particularly interested in materials that can be incorporated as coatings or liners inside storage tanks to improve performance. In this context, composites combining solution-based processability, appropriate mechanical properties such as strength and flexibility, and high hydrogen adsorption capacity are highly desirable. Here we report a detailed study of composite membranes based on a polymer of intrinsic microporosity (PIM-1) as a supporting matrix that is “doped” with higher-surface area adsorbents. Owing to the microporosity created by its rigid, contorted molecular structure, PIM-1 has long been identified as a potential material for hydrogen storage,11b,14 but practical applications have been restricted by its relatively limited surface area and insufficient hydrogen uptake. In addition to its microporosity, an advantage of PIM-1 is that it can be easily processed into robust self-standing films. The attractive mechanical properties of the polymer and its potential use as a tank liner have been recently reported by our group.15 Mixed-matrix membranes based on PIM-1 combined with additives such as zeolitic imidazolate frameworks (ZIFs),16 molecular cages,17 hypercrosslinked nanoparticles18 or frameworks19 have been shown to possess enhanced gas separation and delayed aging properties. However, the use of polymer-based composite materials for hydrogen storage is limited and usually involves covalent bonding of hydrogen (e.g., metal hydrides or ammonia borane) rather than physisorption.20 Furthermore, while some techniques of predicting the mechanical properties of composites based on those of the individual components and on the architecture of composites are known,21 methods for estimating the porosity and hydrogen storage properties of composites are currently not available.
In this work, we have created PIM-1 based composites with large accessible surface areas and maintained microporosity in order to efficiently adsorb hydrogen molecules. This was achieved by adding various amounts (0–37.5 wt%) of high-surface area porous aromatic framework PAF-122 to a PIM-1 matrix (Fig. 1). While such composite materials have been found to possess improved gas separation properties and physical stability compared to PIM-1 alone,19 to the best of our knowledge, no studies on their hydrogen uptake or mechanical properties have been reported. By combining a very high-surface area additive, such as PAF-1, with PIM-1 we have been able to form composite materials possessing enhanced hydrogen storage capacity associated with the advantageous mechanical properties and processability of the polymer. High-pressure hydrogen uptake measurements were performed to confirm the potential of this approach to generate composite materials which are potentially able to meet the DoE gravimetric target under useful pressure conditions. We also carried out a detailed mechanical characterization of these new materials (uniaxial tensile testing and dynamic mechanical thermal analysis) in order to fully evaluate their potential for realistic applications. Besides hydrogen storage, the mechanical characteristics of membranes are crucial parameters for potential uses in gas separation technologies.
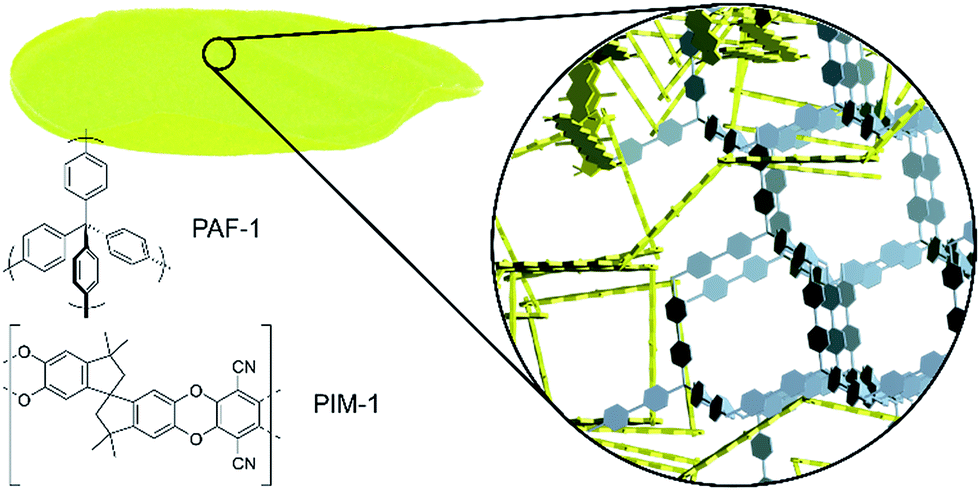 | ||
| Fig. 1 A self-standing composite membrane, with a schematic representation of the microporous structure resulting from a mixture of kinked PIM-1 (yellow) and diamondoid PAF-1 (grey), together with the chemical structures of PIM-1 and PAF-1. | ||
Experimental
General
Chemicals were obtained from Sigma-Aldrich, Fluorochem, VWR or Strem Chemicals, and used without further purification unless indicated. Air- or moisture-sensitive chemicals and reactions were handled under an atmosphere of dry dinitrogen using standard Schlenk techniques and with oven-dried glassware. 1H NMR analyses were performed at room temperature with an Agilent ProPulse 500 MHz spectrometer using residual solvent as an internal reference. Infrared spectra were collected on a Perkin-Elmer Frontier FTIR instrument equipped with a diamond attenuated total reflectance (ATR) head. Gel permeation chromatography (GPC) was performed in tetrahydrofuran (THF) at 1 mL min−1 and 35 °C with an Agilent Technologies 1260 Infinity instrument calibrated against polystyrene standards and equipped with refractive index, light scattering and viscosity detectors. Molecular weight distributions were calculated using the triple-detection mode of the Agilent GPC/SEC software (version A.02.01). Thermogravimetric analyses (TGAs) were performed using a Setaram Setsys Evolution 16 TGA instrument using air as carrier gas. The results were corrected for buoyancy by subtracting blank traces acquired under the same conditions.Syntheses
000 g mol−1, Mw = 562000 g mol−1. The synthesis could be scaled up to five times without noticeably affecting the obtained polymer's properties.
Preparation of composite films
A solution of PIM-1 and a suspension of PAF-1 were prepared separately in chloroform (typically 40 mg of material per mL) and stirred overnight. After mixing the solutions with each other to achieve the desired PIM-1/PAF-1 gravimetric proportions, the suspension was vigorously stirred overnight and cast into a glass Petri dish, covered and left to slowly evaporate over the course of 1–2 days. The formed membrane was then recovered and dried under vacuum at 80 °C.Surface characterization
Samples were degassed under high vacuum for at least 12 h at 150 °C prior to any N2, H2 or CO2 adsorption experiment, and the analysis temperatures of 77.4 K or 273 K were achieved using liquid nitrogen or ice baths, respectively.Mechanical properties
The mechanical properties of composites were investigated with static uniaxial tensile tests and dynamic mechanical thermal analysis (DMTA) in tension.Modelling of high-pressure hydrogen uptake isotherms
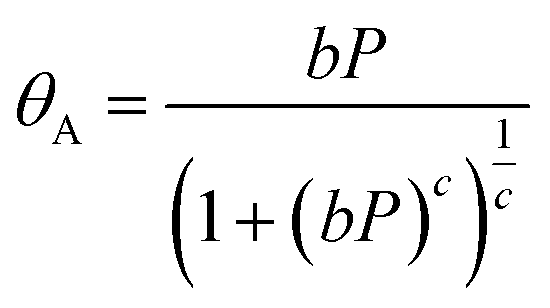
The experimental results (excess uptake in wt%) were fitted to eqn (1), using the Tóth equation (eqn (2)) to represent the filling fraction θA:25,26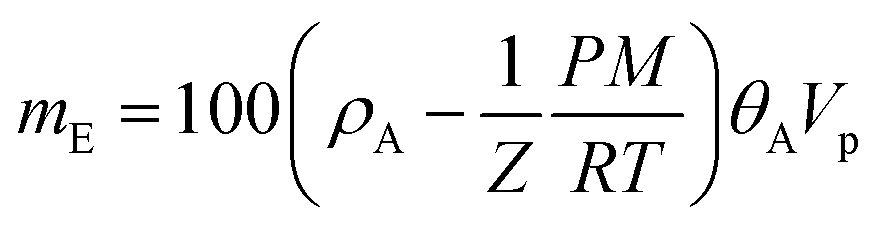 | (1) |
 | (2) |
 | (3) |
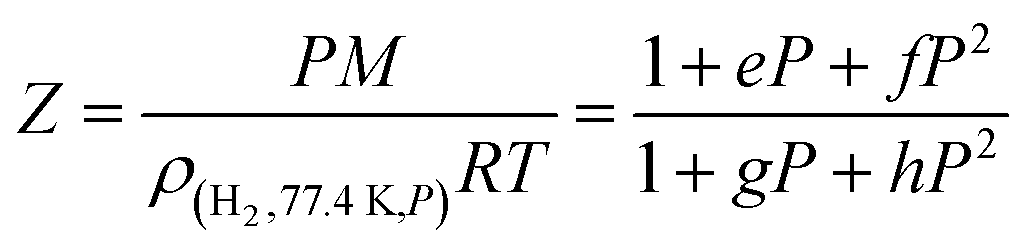
Using the densities of hydrogen at various pressures and 77.4 K available from the NIST,27 the following values were determined for the four parameters (P in MPa): e = −0.04548 MPa−1; f = 0.00455 MPa−2, g = 0.02805 MPa−1, h = 0.00275 MPa−2.
In our case, with Vp values available experimentally (total pore volumes), the fitting procedure gave access to ρA, b and c, which are summarized in Table S2.† Once the excess uptake mE has been fitted, the total uptake mtotal can be calculated as follows (mtotal and mE in wt%):
| mtotal = mE + ρbulkVp × 100 | (4) |
 | (5) |
Results and discussion
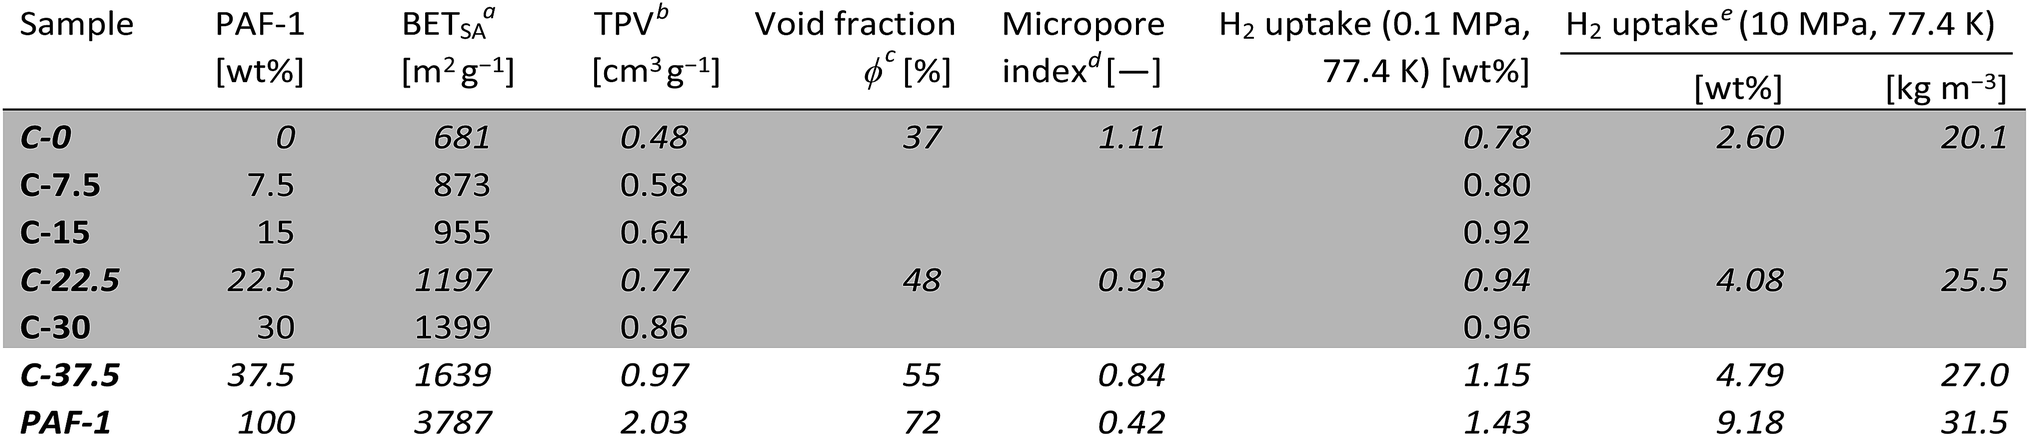
PIM-123 and PAF-122 were prepared according to published procedures, and N2 adsorption isotherms at 77.4 K were used to characterise their respective surface properties (Fig. S1†). The BET surface areas determined for PIM-1 (828 or 681 m2 g−1 in powder and film morphologies, respectively) are in good agreement with prior literature values.23a We determined a BET surface area of 3787 m2 g−1 for PAF-1, which is lower than the value reported by Ben et al.,22 despite using consistently similar synthetic and characterisation methods. The pores of PIM-1 have distributions centered at 0.5 and 1.3 nm, and PAF-1 has a narrow pore size distribution centered at 1.4 nm with a shoulder peak around 1.7 nm, as determined by NLDFT analysis of N2 isotherms. It is also noticeable that 50–60% of the pore volumes or surface areas of PIM-1 and PAF-1 correspond to micropores (Fig. S2†).
We created PIM-1 based self-standing composite membranes containing increasing quantities of PAF-1 filler. The prepared materials are listed in Table 1, where the sample number reflects the weight fraction of PAF-1 in the composite (C); e.g.C-15 contains 15 wt% PAF-1. Robust self-standing films containing up to 37.5 wt% PAF-1 were prepared. However, upon addition of more than 20 wt% PAF-1, batch-to-batch reproducibility decreases and the films tend to crack upon drying. N2 adsorption and thermal stability experiments were performed on composites containing 0–37.5 wt% PAF-1, and detailed surface analysis (pore size distribution, CO2 adsorption, pycnometry) on a subset of samples comprising compounds C-0 (PIM-1), C-22.5, C-37.5 and PAF-1, which were also studied in high-pressure hydrogen uptake experiments.‡ Mechanical tests were limited to the 0–30 wt% range as it was not possible to prepare robust and homogeneous films of sufficient quality and dimensions with a higher proportion of PAF-1.
| a Determined from N2 adsorption isotherms at 77.4 K. b Total pore volume determined by uptake at p/p0 ≈ 0.97 on N2 isotherms at 77.4 K. c Calculated from total pore volumes and skeletal densities. d Ratio of the microporous surface area determined by NLDFT and the BET surface area, both obtained from CO2 isotherms at 273 K. e Total uptakes. |
|---|
|
The surface area and total pore volume of the composite films (estimated based on N2 adsorption isotherms measured at 77.4 K, Fig. S3 and S4†) were found to increase proportionally to the concentration of PAF-1, with values slightly lower than predicted using the rule of mixtures, where the property of a composite (exemplified in eqn (6) by its surface area) is a weighted mean of the properties of its individual constituents, and where wPIM-1 and wPAF-1 are the weight fractions of PIM-1 and PAF-1, respectively, such that wPIM-1 + wPAF-1 = 1 (see ESI† for derivation).
| Surface area(composite) = wPIM-1 × surface area(PIM-1) + wPAF-1 × surface area(PAF-1) | (6) |
The slight discrepancies may be due to pores being obstructed at the interfaces of PIM-1 and PAF-1. In addition, slow mass transfer of N2 into the pores of the composite films may result in a systematic error slightly underestimating the surface area values, as has been observed for other microporous materials.28
The composite membrane containing 37.5 wt% PAF-1 (C-37.5) was found to have a surface area (BET) of 1639 m2 g−1, which represents a remarkable 2.4-fold increase over the BET surface area determined for a membrane made of PIM-1 only. Fitting experimental BET surface areas or total pore volumes of composites to rule of mixture equations allows in principle prediction of these properties for composites of any given composition (Fig. 2a and S5†).
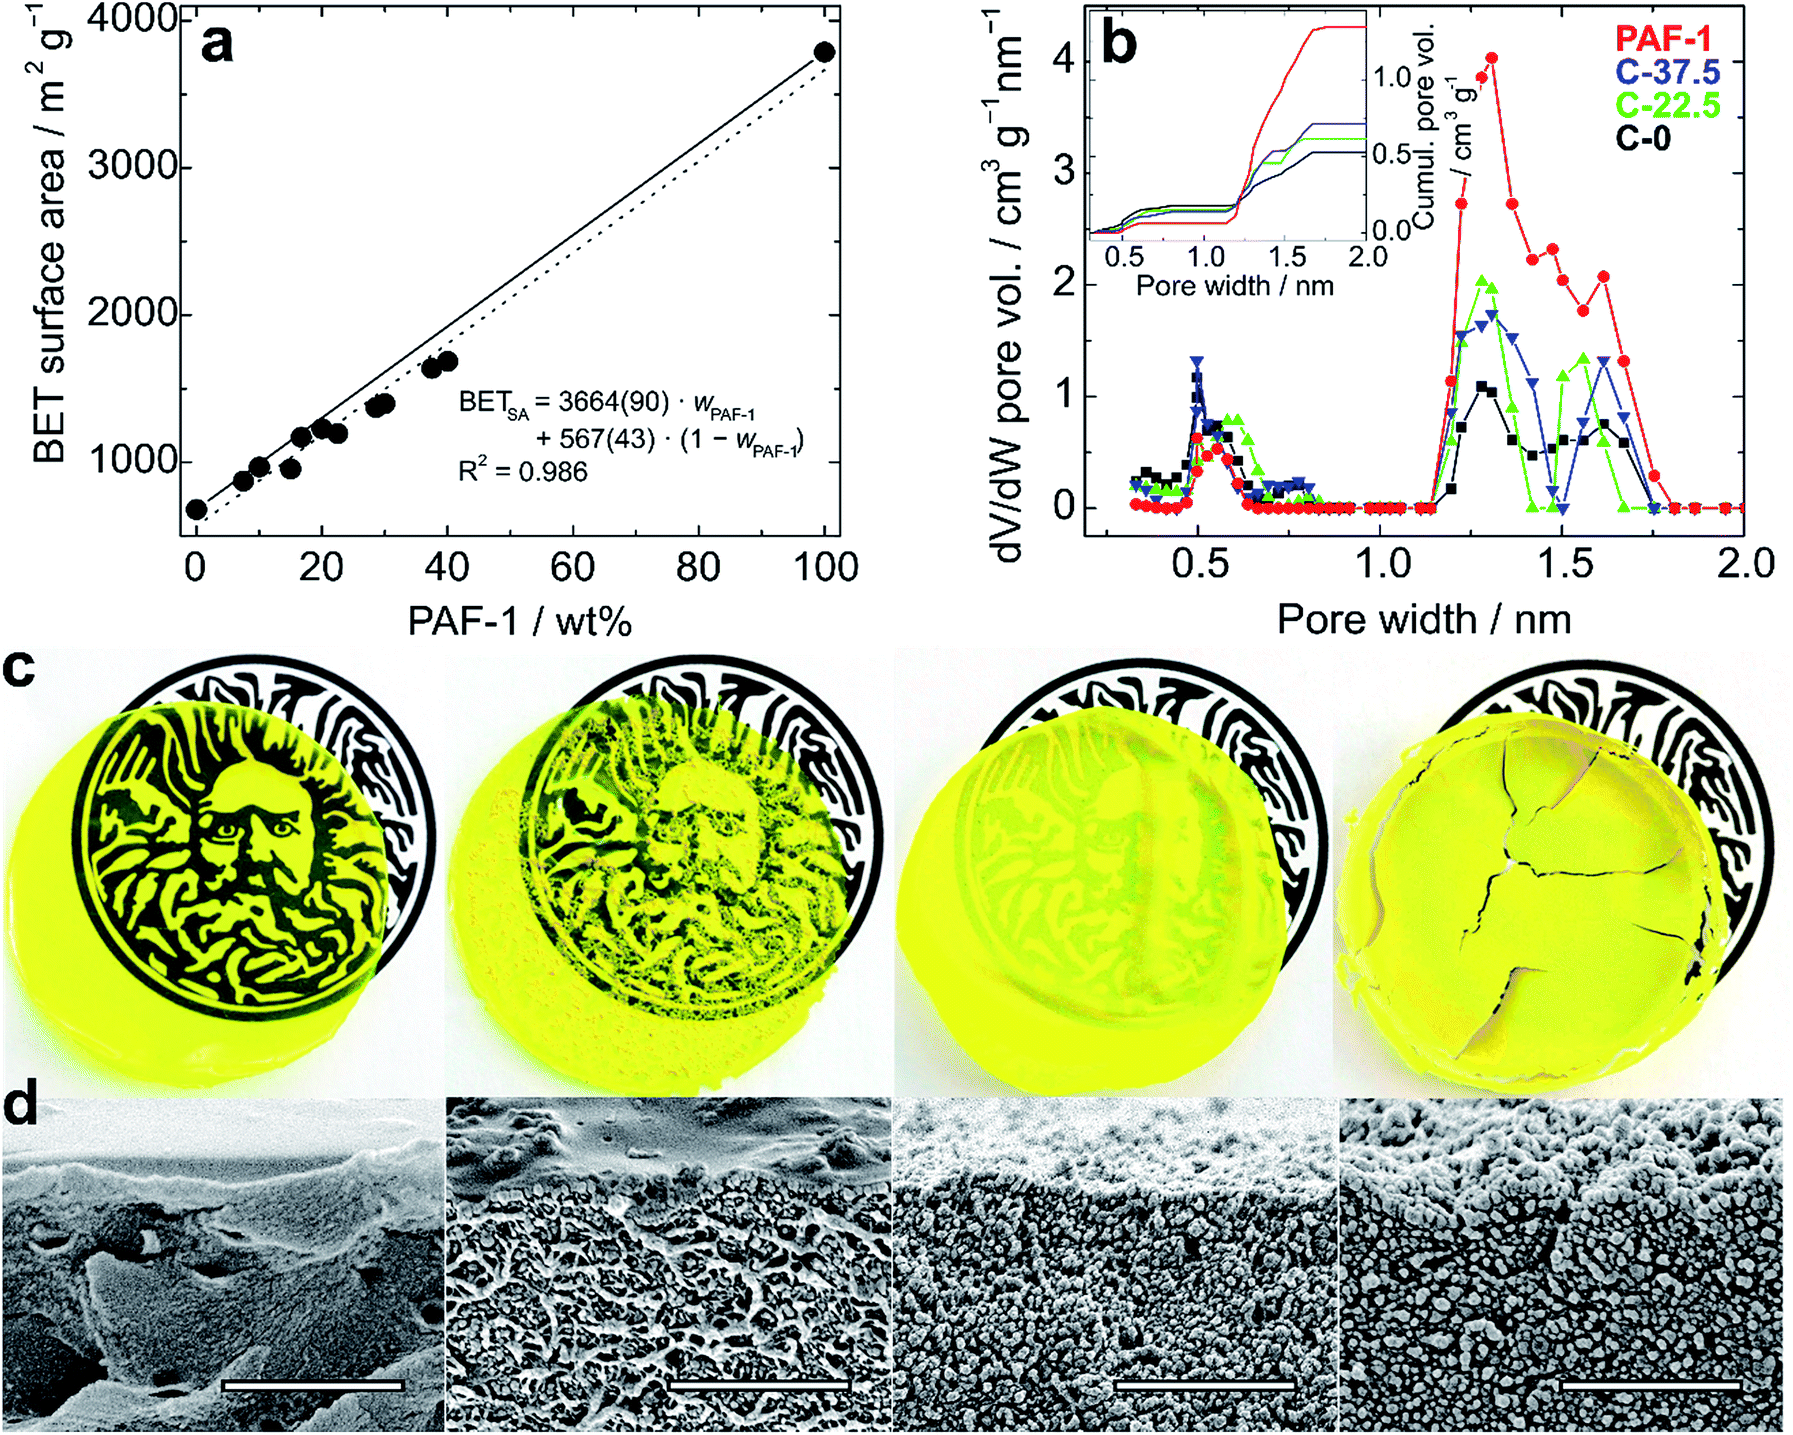 | ||
| Fig. 2 (a) BET surface area of PIM-1/PAF-1 composite films as a function of the weight percentage of PAF-1. Solid and dotted lines represent theoretical and experimental “rule of mixtures” (eqn (6)), respectively, and the fitting equation is given with standard errors; (b) micropore size distributions and cumulative pore volumes (inset) of PIM-1 (black, C-0), PAF-1 (red) and composites C-22.5 (green) and C-37.5 (blue), determined by NLDFT; (c) photos of 6 cm films (from left to right: C-0, C-7.5, C-22.5 and C-37.5) over the logo of the University of Bath to show transparency, and (d) corresponding SEM images. Scale bars: 2 μm. | ||
Volumetric estimations of porosity (φ) were determined based on the total pore volume (from N2 adsorption at 77.4 K and p/p0 ≈ 0.97) and on the skeletal density of the composites determined by helium pycnometry. The experimentally determined φ values for a thin film made of PIM-1 (φPIM-1 = 37%) and for PAF-1 (φPAF-1 = 72%) are in good agreement with values calculated using data from the literature,23a,29 and the composites have intermediate open volumes depending on the proportion of PAF-1 (Table 1). In order to obtain more detailed information on the pore size distributions of the materials, CO2 adsorption experiments were performed at 273 K (Fig. S6†), which allows the diffusion rate issues encountered during N2 adsorption analyses at 77.4 K to be circumvented. Pore size distributions estimated via NLDFT-based analysis of the CO2 isotherms demonstrate the composites combine the ultra-microporosity of PIM-1 (0.35–0.8 nm region) with enhanced porosity between 1.2 and 1.7 nm owing to the large contribution of PAF-1 in that range (Fig. 2b and Table S1†). Importantly, the incorporation of PAF-1 appears to decrease the proportion of micropores in the composites, as suggested by the “micropore index” shown in Table 1, which compares micropore surface areas obtained by NLDFT relatively to BET surface areas.§ Thermogravimetric analyses performed on composite membranes revealed that the least thermally stable constituent is PAF-1, which shows a decomposition onset at 300 °C in air. PIM-1 is more stable, with a decomposition onset measured at 390 °C under the same conditions, and composite materials show decomposition patterns combining those of both constituents (Fig. S7†). This excellent thermal stability is important for hydrogen storage applications as the compression of hydrogen generates heat and storage tanks are required to sustain temperatures of up to 85 °C.2
We used scanning electron microscopy (SEM) to evaluate the dispersion of the PAF-1 particles in the PIM-1 matrix and assess the microstructure of the composites. Cross-sections of composites were imaged close to the upper edge so that the surface of the sample could be observed simultaneously (Fig. 2d). Imaged fragments were representative of the bulk samples as the distribution of particles was mostly uniform. As expected, there was a clear increase in the amount of particulates observed on the surface of samples with increasing concentrations of PAF-1: at lower concentrations (7.5 wt%), conglomerated particles of PAF-1 appeared immersed in the PIM-1 matrix, whereas with concentrations of 22.5 wt% and 37.5 wt%, the structure exhibited granule-dominated character. In cross-sectional images, fiber-like structures were evident with PAF-1 concentrations up to 7.5 wt%, which can be related to the structure of PIM-1, whereas in films with higher additive content, PAF-1 particles dominate.
The mechanical properties of films containing up to 30 wt% PAF-1 were studied by means of uniaxial tensile testing and dynamic mechanical thermal analysis (DMTA) in tension at temperatures between −150 °C and 400 °C. The preparation of sufficiently large films containing 37.5 wt% PAF-1 was hindered due to their brittleness, which resulted in the films cracking during the evaporation process (Fig. 2c). The thickness of the films was between 40 and 80 μm, which is within the range identified previously to provide planar and defect-free thin films.15a Tensile testing revealed a decrease in average ultimate stress and strain with increasing PAF-1 concentration (Fig. 3a). Weighted trend lines (adjusted to the number of samples with a weighted least-squares regression method) plotted for both strain-concentration and stress-concentration curves indicate that for PAF-1 concentrations above 40 wt%, ultimate tensile stress and strain would fall to zero. This can be explained considering the lower density of PAF-1 compared to that of PIM-1 (Table S1†). As a result, the volumetric content of PAF-1 in composite C-37.5 (containing 37.5 wt% PAF-1) is 60%, hence the volumetric amount of PIM-1 is insufficient to support membrane-like and flexible behavior of the composite. This high volumetric content also explains structures observed in SEM images (Fig. 2d), where the film cast from composite C-37.5 is dominated by aggregated particles of PAF-1 filler. The decrease in ultimate stress and strain with increasing filler content indicates that the PAF-1 additive may act as a defect to initiate failure at a lower stress level. A decrease of Young's modulus with PAF-1 content was also observed, but this drop was not as prominent since the elastic modulus of the composite is dominated by the continuous PIM-1 matrix. When comparing the stiffness of a film made of PIM-1 with no filler (C-0) and a film containing 30 wt% PAF-1 (C-30), the tensile Young‘s modulus decreased by 20%, from 1.3 GPa to 1.0 GPa (Fig. S8†), which, considering the standard deviation of our measurements, is not a significant reduction.
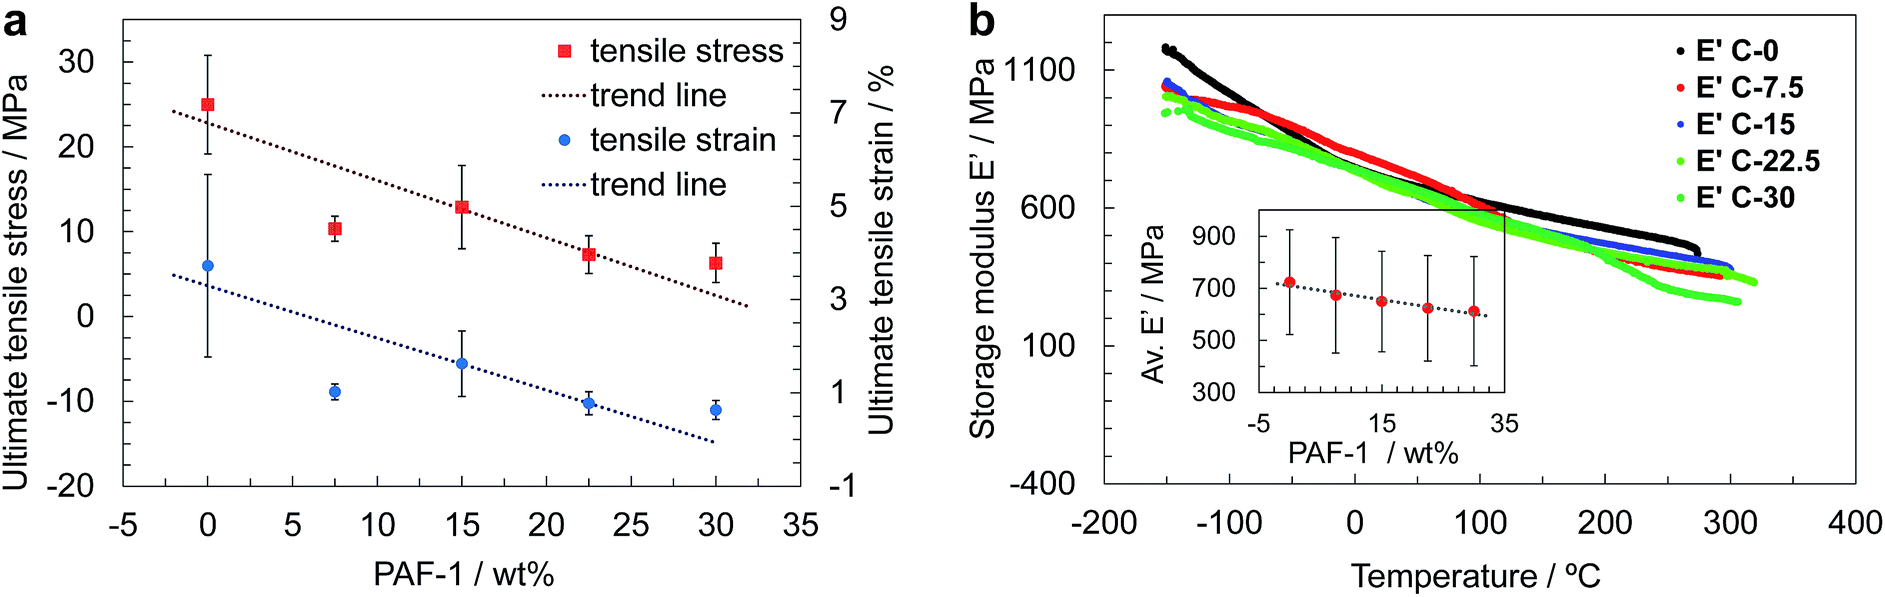 | ||
| Fig. 3 (a) Ultimate tensile strength of PIM-1 composite films with PAF-1 amounts between 0 and 30 wt%, obtained with uniaxial tensile tests. Weighted trend lines are adjusted to the number of analysed samples. (b) Temperature-dependent storage moduli of composite films obtained with DMTA, and storage modulus of each composite averaged over the whole temperature range (inset). | ||
A similar behavior was observed in the case of average tensile storage modulus obtained from DMTA, where only a 15% decrease was measured (Fig. 3b, inset). The shape of curves showing the evolution of storage modulus with temperature is independent of the amount of additive. The plots are almost perfectly linear, suggesting that no phase transitions take place until decomposition of the samples at approximately 300–350 °C. The loss moduli never exceed 50 MPa, leading to a low tan(δ) of less than 0.1, and indicating a low viscoelastic response of the composites (Fig. S9†), which exhibit mostly elastic behavior, in line with results obtained previously for pure PIM-1.15a,23a The decomposition temperature of the composites determined with DMTA appears not to be influenced by the amount of additive.
Having demonstrated the promising stability, enhanced porosity and mechanical robustness of the composite membranes, we determined their hydrogen uptake capacities. At low pressure (up to 0.1 MPa at 77.4 K), the hydrogen uptake was found to increase with the amount of PAF-1 in the membrane. As the H2 adsorption capacity is strongly correlated to the surface area of materials,4 this result was expected. At 0.1 MPa and 77.4 K, the films made of PIM-1 alone were found to take up 0.78 wt% H2, whereas the uptake of PAF-1 was 1.43 wt%. The low-pressure hydrogen uptake values of composite films (Fig. 4a and S10†) are equal or even slightly superior to the values expected based on the rule of mixtures, which suggests the creation of more favorable pore sizes and geometries in the composite membranes. As was the case for the BET surface area and total pore volume of the composites, their hydrogen uptake at 0.1 MPa can be predicted based on simple rule-of-mixtures calculations.
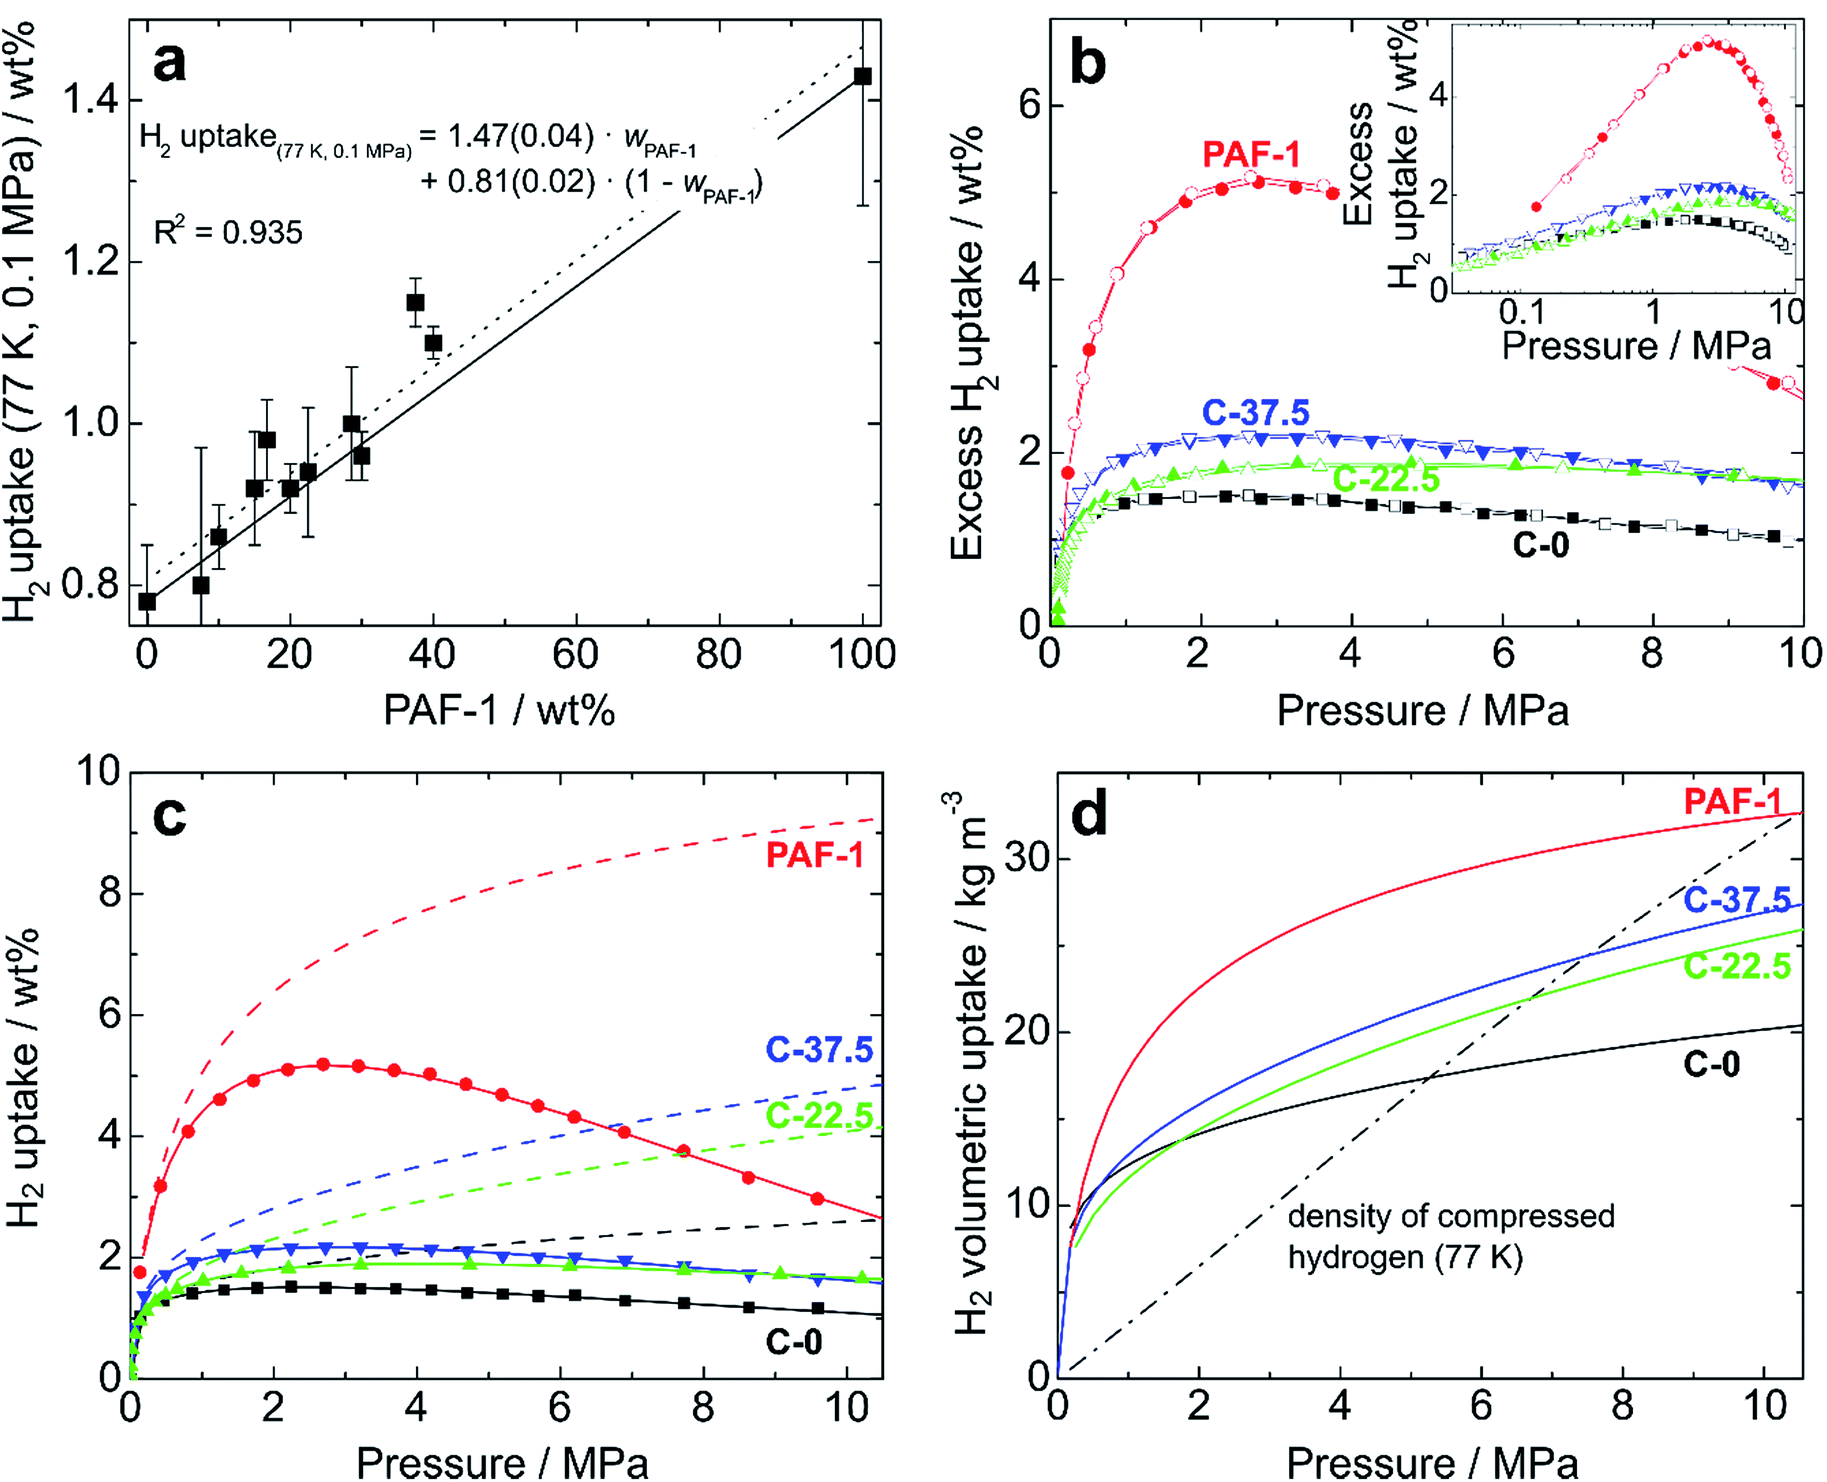 | ||
| Fig. 4 (a) Excess hydrogen uptakes (0.1 MPa, 77.4 K) for PIM-1/PAF-1 films as a function of the weight proportion of PAF-1 (average of three independent measurements). Solid and dotted lines represent theoretical and experimental “rule of mixtures”, respectively, and the fitting equation is given with standard errors; (b) excess hydrogen uptake for PIM-1 (C-0, black), PAF-1 powder (red), and composites C-22.5 (green) and C-37.5 (blue) at pressures up to 10 MPa. Filled and open symbols represent adsorption and desorption branches, respectively; (c) experimentally measured excess uptakes (symbols), fitted isotherms (solid lines), and calculated total hydrogen uptakes (dashed lines) of the same samples; (d) total volumetric hydrogen uptakes of the same samples at 77.4 K. The dash-dotted line shows the volumetric density of compressed hydrogen gas at 77.4 K. | ||
For realistic applications, uptake capacities need to be determined under high pressure conditions. We therefore determined the hydrogen uptakes of composites C-22.5 and C-37.5 at pressures up to 10.5 MPa. At 77.4 K, the maximum excess uptakes are attained at approximately 3 MPa, where their values are 1.9 and 2.2 wt% for composites C-22.5 and C-37.5, respectively. Under these conditions, the excess H2 uptakes of pure PIM-1 (C-0) and PAF-1 are 1.5 and 5.2 wt% (Fig. 4b). All isotherms are fully reversible without hysteresis, as expected for the adsorption of H2 on microporous materials, and the composites can undergo several charging/discharging cycles without loss of capacity (Fig. S11†). The H2 adsorption isotherms were modelled using a methodology developed at the University of Bath, that assumes a two-phase system in the pores in which the density of adsorbate is constant.25 Fitting the excess uptake isotherm affords both the absolute adsorption and the total amount of hydrogen present in the material (comprising adsorbed hydrogen and hydrogen compressed at the centers of the pores). As in former studies,25a the Tóth equation26 was used to represent the filling fraction of the pores. The parameters obtained from the fitting of the adsorption isotherms are listed in Table S2,† and the resulting fitted excess isotherms and calculated total uptakes are shown in Fig. 4c. Interestingly, the adsorbed phase densities obtained from the fitting procedure lie between 49 and 85 kg m−3, which falls within the range of liquid hydrogen¶ and even approaches the density of solid hydrogen30 in the case of composite C-22.5, which indicates a high degree of adsorbate ordering within the pores. The fitting procedure allows extrapolation of the theoretical maximal uptakes of the materials, which were found to reach 6.5 and 6.7 wt% for composites C-22.5 and C-37.5, whereas these maxima for PIM-1 (C-0) and PAF-1 were determined as 3.3 and 9.9 wt%, respectively. Within the experimental conditions accessible with our instrumentation, the total H2 uptakes were found to reach 2.60 wt% (C-0), 4.08 wt% (C-22.5), 4.79 wt% (C-37.5), and 9.18 wt% (PAF-1) at 10 MPa (Fig. 4c). Therefore, composite C-37.5 was found to take up 84% more hydrogen than PIM-1 itself by mass (at 77.4 K and 10 MPa). Remarkably, the total gravimetric uptakes of composites C-22.5 and C-37.5 fall within 6% of what would have been expected based on rule-of-mixtures calculations, showing that hydrogen uptakes can be predicted based on the constitution of composites. The corresponding volumetric storage densities at 10 MPa are 20.1 g L−1 for C-0, 25.5 g L−1 for C-22.5, 27.0 g L−1 for C-37.5, and 31.5 g L−1 for PAF-1, which indicates that the composites possess a significantly enhanced volumetric storage density compared to PIM-1: a given volume of the best composite C-37.5 can take up 34% more H2 in weight units than a similar volume of PIM-1, and is also 28% lighter. As shown in Fig. 4d, the volumetric storage density of C-37.5 is superior to that of compressed hydrogen below 7.5 MPa, where the total uptake is 4.3 wt% or 25.5 g L−1. At higher pressure, the excess uptake exceeds saturation, which becomes detrimental to significantly increasing the total uptake. As a result, even if the calculated maximum uptake of 6.7 wt% could be reached, at the required pressure the volumetric capacity would be significantly inferior to that of the same volume filled with compressed hydrogen (See Fig. S12–S15† for similar analyses on other materials). An option to maximize the volumetric storage capacity would be to compress the materials in order to increase their packing density. For example, it has been demonstrated that mechanically compacting MOF-177 by a factor of two improves its excess volumetric hydrogen storage density by approximately 70% with only a minor decrease of the gravimetric uptake.31 However, a low bulk density is often a feature of high-surface area materials possessing significant microporous volumes, which limits their volumetric uptakes.8a Finally, the usable capacity (the difference between the maximum working pressure of a storage tank, and the minimum required delivery pressure) is a key parameter for technical applications.32 Using the model based on the Tóth equation, we calculated the usable capacities for the hypothetical case of a fuel cell requiring a minimum of 0.2 MPa connected to a storage tank filled to a maximum pressure of 5 MPa:|| The isothermal unloading at 77.4 K of C-0 between 5 MPa and 0.2 MPa releases 1.06 wt% hydrogen (48% of its total uptake). Composites C-22.5 and C-37.5 release 2.02 and 2.33 wt% hydrogen under the same conditions, respectively (64 and 62% of their total uptakes) and PAF-1 releases 5.76 wt% H2, or 71% of its total uptake (see Table S3 and Fig. S16† for details). The advantage of using composites is clear, as the usable capacity of C-37.5 at 77.4 K is more than twice that of PIM-1 alone (C-0). Finally, it has to be noted that although these usable capacities are significantly lower than the total hydrogen uptakes of the materials, they can be significantly improved if the temperature of the storage tank is allowed to increase during the unloading process.
Conclusions
We have shown how the porosity, hydrogen uptake and mechanical properties of a processable microporous polymer (PIM-1) can be tuned by addition of a highly porous filler (PAF-1). The surface area, total pore volume and hydrogen uptake of the composites were found to follow rule-of-mixtures trends. This observation constitutes a new and important design rule enabling the properties of a composite to be predetermined based on its constituents, and provides important guidelines for the future design of polymer-based porous composites in the broader context of gas storage and separation. The tensile mechanical properties of composites (ultimate stress and strain) were found to decrease with increasing PAF-1 content in the matrix, in contrast to the elastic properties, which were relatively unchanged. In practice, the preparation of self-standing samples with more than 20 wt% PAF-1 is difficult owing to the increased brittleness of the composites, and we are exploring alternative manufacturing methods to further increase the additive content while maintaining good mechanical properties. High-pressure hydrogen uptake experiments combined with theoretical modelling showed that the composites possess enhanced uptake capacities compared to PIM-1 alone, and can theoretically reach the 2025 US Department of Energy target in terms of gravimetric hydrogen storage capacity. Currently, the volumetric storage capacity is superior to that of compressed hydrogen at pressures up to 7.5 MPa, and the reported composites possess slightly lower uptake values compared to those of the best performing MOFs8a or porous carbons.5,9,10 However, they possess the significant benefits of being lightweight, air-, moisture- and thermally-stable, and can be readily processed into thin films and coatings. Progress towards further increasing capacity and overcoming the need for cryogenic temperatures to achieve significant uptake is being pursued in our laboratories by increasing the binding energy of hydrogen to microporous surfaces, for example using chemically modified MOFs or PAFs as additives, while maintaining adequate porosity and processability. The PIM-1/PAF-1 combination demonstrated here represents an important step towards the development of processable composite materials able to store significant amounts of hydrogen. In particular, the light weight and good thermal and mechanical stability of these composites make them promising for applications such as portable fuel cells or lightweight mobile storage.Conflicts of interest
The authors have no conflicts of interest to declare.Acknowledgements
This work was financially supported by the UK Engineering and Physical Sciences Research Council (EPSRC) via SUPERGEN Grants No. EP/K021109/1 and EP/L018365/1, and the EPSRC Doctoral Training Centre in Sustainable Chemical Technologies, under Grant No. EP/G03768X/1.Notes and references
- L. Schlapbach and A. Züttel, Nature, 2001, 414, 353 CrossRef CAS PubMed.
- U.S. Department of Energy, Target Explanation Document: Onboard Hydrogen Storage for Light-Duty Fuel Cell Vehicles, 2017, https://energy.gov/sites/prod/files/2017/05/f34/fcto_targets_onboard_hydro_storage_explanation.pdf, accessed June 2017 Search PubMed.
- W. I. F. David, Faraday Discuss., 2011, 151, 399 RSC.
- D. P. Broom, C. J. Webb, K. E. Hurst, P. A. Parilla, T. Gennett, C. M. Brown, R. Zacharia, E. Tylianakis, E. Klontzas, G. E. Froudakis, T. A. Steriotis, P. N. Trikalitis, D. L. Anton, B. Hardy, D. Tamburello, C. Corgnale, B. A. van Hassel, D. Cossement, R. Chahine and M. Hirscher, Appl. Phys. A, 2016, 122, 151 CrossRef.
- S. Tedds, A. Walton, D. P. Broom and D. Book, Faraday Discuss., 2011, 151, 75 RSC.
- C. J. Rhodes, Annu. Rep. Prog. Chem., Sect. C: Phys. Chem., 2007, 103, 287 RSC.
- M. Sevilla and R. Mokaya, Energy Environ. Sci., 2014, 7, 1250 CAS.
- (a) L. J. Murray, M. Dincă and J. R. Long, Chem. Soc. Rev., 2009, 38, 1294 RSC; (b) M. P. Suh, H. J. Park, T. K. Prasad and D.-W. Lim, Chem. Rev., 2012, 112, 782 CrossRef CAS PubMed.
- S.-Y. Ding and W. Wang, Chem. Soc. Rev., 2013, 42, 548 RSC.
- C. Pei, T. Ben and S. Qiu, Mater. Horiz., 2015, 2, 11 RSC.
- (a) N. B. McKeown, ISRN Mater. Sci., 2012, 2012, 513986 Search PubMed; (b) P. M. Budd, A. Butler, J. Selbie, K. Mahmood, N. B. McKeown, B. Ghanem, K. Msayib, D. Book and A. Walton, Phys. Chem. Chem. Phys., 2007, 9, 1802 RSC; (c) Z. Chang, D.-S. Zhang, Q. Chen and X.-H. Bu, Phys. Chem. Chem. Phys., 2013, 15, 5430 RSC.
- (a) X. Lin, J. Jia, X. Zhao, K. M. Thomas, A. J. Blake, G. S. Walker, N. R. Champness, P. Hubberstey and M. Schröder, Angew. Chem., Int. Ed., 2006, 45, 7358 CrossRef CAS PubMed; (b) J. L. C. Rowsell and O. M. Yaghi, Angew. Chem., Int. Ed., 2005, 44, 4670 CrossRef CAS PubMed.
- A. F. Ismail, K. C. Khulbe and T. Matsuura, Gas Separation Membranes, Polymeric and Inorganic, Springer International Publishing, Switzerland, 2015, p. 14 Search PubMed.
- N. B. McKeown and P. M. Budd, Chem. Soc. Rev., 2006, 35, 675 RSC.
- (a) K. Polak-Kraśna, R. Dawson, L. T. Holyfield, C. R. Bowen, A. D. Burrows and T. J. Mays, J. Mater. Sci., 2017, 52, 3862 CrossRef; (b) K. Polak-Kraśna, C. Furhop, S. Rochat, A. D. Burrows, A. Georgiadis, C. R. Bowen and T. J. Mays, Int. J. Hydrogen Energy, 2017 DOI:10.1016/j.ijhydene.2017.04.081.
- (a) L. Hao, K.-S. Liao and T.-S. Chung, J. Mater. Chem. A, 2015, 3, 17273 RSC; (b) A. F. Bushell, M. P. Attfield, C. R. Mason, P. M. Budd, Y. Yampolskii, L. Starannikova, A. Rebrov, F. Bazzarelli, P. Bernardo, J. C. Jansen, M. Lanč, K. Friess, V. Shantarovich, V. Gustov and V. Isaeva, J. Membr. Sci., 2013, 427, 48 CrossRef CAS.
- A. F. Bushell, P. M. Budd, M. P. Attfield, J. T. A. Jones, T. Hasell, A. I. Cooper, P. Bernardo, F. Bazzarelli, G. Clarizia and J. C. Jansen, Angew. Chem., Int. Ed., 2013, 52, 1253 CrossRef CAS PubMed.
- T. Mitra, R. S. Bhavsar, D. J. Adams, P. M. Budd and A. I. Cooper, Chem. Commun., 2016, 52, 5581 RSC.
- (a) C. H. Lau, K. Konstas, A. W. Thornton, A. C. Y. Liu, S. Mudie, D. F. Kennedy, S. C. Howard, A. J. Hill and M. R. Hill, Angew. Chem., Int. Ed., 2015, 54, 2669 CrossRef CAS PubMed; (b) C. H. Lau, P. T. Nguyen, M. R. Hill, A. W. Thornton, K. Konstas, C. M. Doherty, R. J. Mulder, L. Bourgeois, A. C. Y. Liu, D. J. Sprouster, J. P. Sullivan, T. J. Bastow, A. J. Hill, D. L. Gin and R. D. Noble, Angew. Chem., Int. Ed., 2014, 53, 5322 CrossRef CAS PubMed.
- (a) J. G. Yuan, Y. F. Zhu, L. Q. Li, Y. Wu and S. X. Zhou, Int. J. Hydrogen Energy, 2017 DOI:10.1016/j.ijhydene.2017.03.122; (b) S. F. Li, Z. W. Tang, Y. B. Tan and X. B. Yu, J. Phys. Chem. C, 2012, 116, 1544 CrossRef CAS.
- R. M. German, Particulate Composites, Fundamentals and Applications, Springer International Publishing, Switzerland, 2016 Search PubMed.
- T. Ben, H. Ren, S. Ma, D. Cao, J. Lan, X. Jing, W. Wang, J. Xu, F. Deng, J. M. Simmons, S. Qiu and G. Zhu, Angew. Chem., Int. Ed., 2009, 48, 9457 CrossRef CAS PubMed.
- (a) P. M. Budd, E. S. Elabas, B. S. Ghanem, S. Makhseed, N. B. McKeown, K. J. Msayib, C. E. Tattershall and D. Wang, Adv. Mater., 2004, 16, 456 CrossRef CAS; (b) J. Song, N. Du, Y. Dai, G. P. Robertson, M. D. Guiver, S. Thomas and I. Pinnau, Macromolecules, 2008, 41, 7411 CrossRef CAS.
- J. Rouquerol, P. L. Llewellyn and F. Rouquerol, in Studies in Surface Science and Catalysis, ed. P. L. Llewellyn, F. Rodriguez-Reinoso, J. Rouquerol and N. Seaton, Elsevier, Amsterdam, 2007, vol. 160, p. 49 Search PubMed.
- (a) N. Bimbo, V. P. Ting, A. Hruzewicz-Kołodziejczyk and T. J. Mays, Faraday Discuss., 2011, 151, 59 RSC; (b) J. E. Sharpe, N. Bimbo, V. P. Ting, A. D. Burrows, D. Jiang and T. J. Mays, Adsorption, 2013, 19, 643 CrossRef CAS.
- J. Tóth, Adv. Colloid Interface Sci., 1995, 55, 1 CrossRef.
- National Institute of Standards and Technology, NIST Chemistry WebBook, http://webbook.nist.gov/chemistry, accessed April 2017 Search PubMed.
- S. Sircar, H. Wu, J. Li and A. D. Lueking, Langmuir, 2011, 27, 14169 CrossRef CAS PubMed.
- (a) S. J. Garibay, M. H. Weston, J. E. Mondloch, Y. J. Colón, O. K. Farha, J. T. Hupp and S. T. Nguyen, CrystEngComm, 2013, 15, 1515 RSC; (b) N. B. McKeown, B. Gahnem, K. J. Msayib, P. M. Budd, C. E. Tattershall, K. Mahmood, S. Tan, D. Book, H. W. Langmi and A. Walton, Angew. Chem., Int. Ed., 2006, 45, 1804 CrossRef CAS PubMed.
- I. F. Silvera, Rev. Mod. Phys., 1980, 52, 393 CrossRef CAS.
- R. Zacharia, D. Cossement, L. Lafi and R. Chahine, J. Mater. Chem., 2010, 20, 2145 RSC.
- M. Schlichtenmayer and M. Hirscher, Appl. Phys. A, 2016, 122, 379 CrossRef.
Footnotes |
| † Electronic supplementary information (ESI) available: Additional figures (adsorption isotherms, mechanical properties), characterisation data, modelling results, hydrogen uptake analyses. See DOI: 10.1039/c7ta05232d |
| ‡ We limited our high-pressure H2 uptake experiments to this subset of materials in the interest of instrument time, as a complete analysis takes up to 10 days per sample. |
| § Comparing BET surface areas and NLDFT-determined areas may not appear rigorous from a formal point of view, but it proves useful here to detect a trend along the series of composites. |
| ¶ The density of liquid hydrogen varies between 31.3 and 77.2 kg m−3 depending on the temperature and pressure. See J. W. Leachman, R. T. Jacobsen, S. G. Penoncello and E. W. Lemmon, J. Phys. Chem. Ref. Data, 2009, 38, 721. |
| || A hypothetical tank pressure of 5 MPa was chosen in our example as this pressure falls in the regime where the volumetric density of stored hydrogen is higher than that of compressed hydrogen for all investigated composites. A required back pressure of 0.2 MPa is typical for fuel cells (see ref. 5). |
| This journal is © The Royal Society of Chemistry 2017 |