DOI:
10.1039/C7TA05125E
(Paper)
J. Mater. Chem. A, 2017,
5, 22683-22696
En route to a unified model for photo-electrochemical reactor optimisation. I - Photocurrent and H2 yield predictions†‡
Received
13th June 2017
, Accepted 3rd October 2017
First published on 4th October 2017
Abstract
A semi-empirical model was developed for the prediction of photocurrent densities and implemented to predict the performance of a photo-electrochemical reactor for water splitting in alkaline solutions, using SnIV-doped α-Fe2O3 photo-anodes produced by spray pyrolysis. Photo-anodes annealed at different temperatures were characterised using photo-electrochemical impedance spectroscopy, cyclic voltammetry in the presence and absence of a hole scavenger and also the open circuit potential under high intensity illumination. Mott–Schottky analysis was used cautiously to estimate the charge carrier concentration and the flat band potential. In addition to overpotential/current distribution and ohmic potential losses, the model also accounts for absorbed photon flux, surface and bulk electron–hole recombination rates, gas desorption, bubble formation and (H2–O2) cross-over losses. This allows the model to estimate the total yield of hydrogen, charge and gas collection efficiencies. A methodology is presented here in order to evaluate the parameters required to assess the performance of a photo-electrochemical reactor in 1D and 2D geometries. The importance of taking into account bubble generation and gas desorption is discussed, together with the difficulties of measuring charge carrier concentration and electron–hole recombination in the bulk of the semiconductor, which are of major importance in the prediction of photocurrent densities.
Introduction
The well-known impact of CO2 emissions on climate change, human health and local environments is driving the search for more benign sources of energy. The sun is the earth's ultimate energy source, though subject to diurnal and seasonal intermittency. This calls for a technology to store the harvested solar energy, and make it readily available when needed. Batteries have been proposed as a practical solution. Their cost, potential toxicity and limited specific energies contrast with their portability and versatility. As an alternative, solar fuels, such as hydrogen, have been proposed as a suitable energy carrier. Recent advances in technologies such as water splitting via PV + electrolyser,1 and integrated photo-electrochemical,2 photo-electrochemical3 and particulate photocatalysts4 are approaching a level of readiness for up-scaling. However, commercial deployment is still constrained by the degradation of the systems with time and the cost of the produced hydrogen, which must be competitive with current technologies, e.g. steam reforming. Recently, most of the efforts have been directed towards the development and prediction of performance of photo-anodes5 and to a lesser extent towards photo-cathode development.6,7 Hence, techno-economic modelling and engineering optimisation need to be tackled in parallel with addressing scientific and engineering challenges. The seminal review of Gerisher8 mapped the path towards a fundamental understanding and modelling of semiconductors coupled with electrochemical devices. Carver et al.9 and Haussener10 performed proper electrochemical modelling of such devices, often operating as an electrolyser at relatively low current densities of 2–200 A m−2, cf. 1000–3000 A m−2 for conventional water electrolysers.11 Berger et al.12,13 expanded this work for membrane based systems. However, most of the parameters that defined material performances were from the literature. The effects of bubbles and desorption of gas were not quantified and there was a limited comparison of predictions with experimental data. A more complete integrated solar driven water-splitting device operating at neutral pH was modelled by Jin et al.14 This model considered pH gradients and cross-over losses in the presence and absence of a membrane. Little attention was paid to the effects of bubble generation, causing light reflection/scattering, decreasing conductivities of electrolyte solutions and spatial distribution of current densities of larger electrodes. However, it clearly showed the issues related to current density distribution even at small size electrodes (16 mm). More recently, this model was expanded to study the effect of electrolyte flow on membrane based systems.15 Recent studies by Haussener et al.16–18 extended their model for temperature dependence under concentrated irradiation and statistical analysis validated against experimental data. The effect of perforations on the performance of integrated solar devices18 and photo-electrochemical reactors has also been reported recently.19 However, hitherto a model had yet to be developed for photo-electrochemical reactors, in which the photo-absorber and electrode are the same material, coupled with bubble generation at the electrode and the bulk of the electrolyte. Incorporating bubble formation at the photo-electrode|electrolyte interface is important as (i) it enables quantification of the amount of gas produced near the surface and the actual dissolved gas flux diffused into the bulk of the electrolyte that could take part in cross-over losses;20 (ii) rates of generation of bubbles in photo-electrochemical reactors should be minimised by judicious design, to minimise resistive losses21,22 and the reflection and scattering of incoming light23 that otherwise would decrease photo-electro-active areas. The latter effect will be addressed in more detail in a subsequent paper.
Validation against experimental results obtained with different photo-electrode materials is often bypassed. In this paper, we extend previous work,19 aiming to predict the performance of up-scaled photo-electrochemical reactors based on easily measurable characteristics of components of the system on a small scale, specifically photo-anodes. SnIV-doped α-Fe2O3 photo-anodes treated at different annealing temperatures were used to obtain parameter values as inputs to a 1D model and validate it against experimental data measured in small scale cells. The novelty of the work presented here rests on the use of a single equation to predict photo-anode photocurrent densities, considering electron–hole recombination rates in the bulk semiconductor, the effects of bubble generation and diffusion of dissolved gases in the electrolyte, as outlined in (i) in the previous paragraph. Next, a hypothetical and enhanced photo-anode was studied in a 2D model. This will be followed in part II of this series of papers by 3D geometrical optimisation of perforated photo-anodes.
Theoretical treatment
Definition of bulk and surface electron–hole recombination
Definitions of bulk and surface electron–hole recombination rates in semiconductors are widely spread and vary depending on the framework in which they are discussed. For clarity, we define bulk recombination as the annihilation of generated holes and electrons in the bulk of the semiconductor, outside the depletion region or space charge layer. This recombination accounts for low conductivity or sluggish charge transfer into the substrate, as well as for absorbed photons in the bulk that ultimately do not generate charge. Surface recombination is closely related to the rate of charge carrier extraction at the surface of the semiconductor and the rate at which the charge is migrating and diffusing from the depletion region to and across the semiconductor|electrolyte interface. Generally, surface electron–hole recombination depends on the chemistry of the surface and is a function of the applied potential. A schematic view of these definitions is shown in Fig. 1.
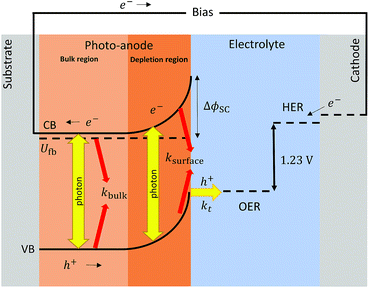 |
| | Fig. 1 Scheme of recombination processes (in red) occurring in the bulk and surface of a photo-anode after charge separation (yellow). | |
Photocurrent density prediction
The photocurrent density produced in the anode was predicted using a modified version of the Gärtner–Butler equation,19,24,25 full derivation is given in the ESI,‡ which does not account for charge migration and diffusion rates into the semiconductor bulk, where electron–hole recombination may occur.| | 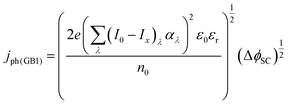 | (1) |
where (I0 − Ix)λ is the actual absorbed light after attenuation e.g. by electrolyte solutions, membranes, bubbles, etc. The photocurrent density should also be limited by the photon flux (I0 − Ix)λ as| |  | (2) |
This formulation was used previously and explained in more detail by Hankin et al.19 According to Dotan et al.,26 photocurrent densities should also be corrected for surface and bulk recombination rates as
| | | jph = jabsorbed × Φsurface × Φbulk | (3) |
jabsorbed is a value that does not depend on the potential and is the maximum achievable current density that corresponds to

. Hence,
Φbulk is a function of potential. We propose here a modified version of this equation to decouple the dependence of
Φbulk from the potential and, instead, account for this dependence in the photocurrent as predicted by the Gärtner–Butler equation:
| | | jph = jph(GB2) × Φsurface × Φbulk | (4) |
In which only jph(GB2) and Φsurface are a function of the band bending ΔϕSC, whereas Φbulk is independent of potential, as will be described below.
Surface recombination.
The interfacial charge transfer efficiency, Φsurface, can be estimated from photo-electrochemical impedance spectroscopy (PEIS) as a function of potential27–29 as described previously for SnIV-doped α-Fe2O3.19
Then, Φsurface can be estimated as a function of the potential after fitting the impedance spectra to a two-time constant equivalent electrical circuit, Rs(QSC[Rt(QrRr)]).27,30 This simplified circuit removes the charge transfer resistance in the bulk, which cannot be discriminated easily from the spectra, and assumes that the charge transfer is dominated by surface states.30 This circuit explains well the presence of two processes: interfacial electron–hole recombination and charge transfer at the photo-anode|electrolyte interface under illuminated conditions. The fitting also accounts for surface distribution after replacing capacitances by constant phase elements.31 The interfacial charge transfer efficiency then can be written as
| |  | (5) |
where
Rt is the charge transfer resistance and
Rr is the recombination resistance. In order to express
Φsurface as a continuous function of potential, the values were fitted to an exponential equation in terms of constants
A and
B, and subsequently combined into the model.
| |  | (6) |
where Δ
ϕSC is the driving force for photocurrent defined here as the difference between the flat band potential and the applied electrode potential, Δ
ϕSC =
Uapplied −
Ufb.
Bulk recombination.
As defined here, the recombination in the bulk should not be a function of applied potential. If surface recombination is avoided, that means Φsurface = 1 when using a fast hole scavenger such as H2O2, see reaction (7), Φbulk can be determined as the ratio between the experimental photocurrent jph,H2O2 and the expected photo-current from the modified Gärtner–Butler equation, jph(GB2).| | | HO2− + OH− + 2h+ → O2 + H2O | (7) |
| |  | (8) |
Then, the rate of bulk recombination should be determined by the Shockley–Read–Hall effect, which does not depend on the applied potential, but on the charge carrier concentration in the bulk of the semiconductor. As shown in Fig. 1, photons absorbed deeper into the semiconductor than the depletion layer tend to recombine, due to the absence of an electric field, so produce no net charge. The Gärtner–Butler equation already considers the depletion layer thickness as a function of the band bending, so the ratio of photocurrents in the absence of electron–hole recombination and expected photocurrents from the modified Gärtner–Butler equation, should be constant. This can be tested by comparing the absorbed photons in the depletion layer and the total number of photons absorbed by the whole depth of the semiconductor, (I0 − Ix)λ. The former photon flux can be estimated using the semiconductor Debye length as an approximation for the depletion layer width in a nanostructured electrode, LD, eqn (9).32 Then, the absorbed photons inside the region of the Debye length can be estimated by a modified Gartner relationship, eqn (10).25
| |  | (9) |
| |  | (10) |
Using previously reported parameters for charge carrier concentration and absorptivity of annealed SnIV-doped α-Fe2O3,33 the number of absorbed photons inside the Debye length is only 7.3% of the total absorbed photons. This value is comparable to the values measured here for Φbulk of annealed samples, ca. 7%.
Dark (anodic and cathodic) current
Dark anodic current densities were approximated by the Tafel equation, as dark overpotentials are usually high for oxygen evolution on hematite electrodes (>100 mV), so the rate of the reverse reaction could be neglected:| | | ja,dark = j0,a10ηa/Aa | (11) |
The overpotential for the oxygen evolution reaction (OER) was computed against its equilibrium potential:
| | UO2|H2O(SHE)/V = 1.229 − 0.0592pH + 0.0148![[thin space (1/6-em)]](https://www.rsc.org/images/entities/char_2009.gif) log(pO2) log(pO2) | (12) |
Assuming small changes of local pH in the electrolyte and insignificant change in the partial pressure of oxygen, it can be assumed that UO2|H2O(RHE) = 1.229 V. Likewise, cathodic currents were computed with the Butler–Volmer equation for hydrogen evolution on platinized titanium.
| |  | (13) |
The hydrogen overpotential was calculated from the equilibrium potential for the hydrogen evolution reaction (HER) at 298 K:
| | UH2O|H2(SHE)/V = −0.0592pH + 0.0296![[thin space (1/6-em)]](https://www.rsc.org/images/entities/char_2009.gif) log log![[thin space (1/6-em)]](https://www.rsc.org/images/entities/char_2009.gif) pH2 pH2 | (14) |
Again, assuming small changes of local pH and negligible change in partial pressure of hydrogen, it was assumed that UH2O|H2(RHE) = 0 V.
Ionic current
As reported previously,19 the ionic current in the electrolyte for (infinitely dilute) charged electro-active species was modelled after substituting Faraday's law into the Nernst–Planck equation:| |  | (15) |
Assuming electroneutrality conditions:
| |  | (16) |
and in the absence of concentration gradients, the distribution of potential satisfies Laplace's equation:
The mass transport limited current density for a quiescent 1 M NaOH electrolyte is jL,OH− ≈ 104 A m−2.19 All experiments and predicted current densities in this study were <50 A m−2. Hence, the OH− gradients and ion depletion at the photo-anode|electrolyte interface were such that ∇ci = 0 was a suitable assumption.
Assuming negligible resistance for the electric contacts and wiring in the cell, a potential balance across the cell gives9
| |  | (18) |
where
UO2|H2O −
UH2O|H2 is the required thermodynamic potential difference,
ηa + |
ηc| are the overpotentials at the anode and cathode, respectively, and the last term is the sum of the ohmic potential losses in the phases i with conductivity
σi, path length
di and cross sectional area
Ai.
Bubble formation and gas desorption
The evolution of gas at the surface of the anode and cathode was modelled in terms of efficiency of gas evolution, fG.20| |  | (19) |
where ND is the flux density of hydrogen or oxygen produced by the faradic current at the surface of the electrode. NG is the fraction of ND converted into bubbles at the electrode surface, Ndesorption is the gas evolving from natural desorption under supersaturated conditions and Nbulk is the diffusive flux density. A schematic representation of these processes is given in Fig. 2, following definitions proposed by Vogt.20
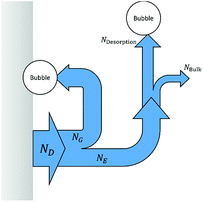 |
| | Fig. 2 Scheme of gas evolution on an electrode and in the electrolyte, the modified version from Vogt.20 | |
The effects of bubble generation on light scattering and reflection have yet to be implemented. Also, the present model does not consider the effect of flow, which can decrease gas evolution efficiencies substantially20 and modify the micro- and macro-convection effects due to the removal of bubbles at the electrode surface.
Efficiency of gas evolution.
Several models have been proposed to estimate fG in terms of measurable quantities such as current density and fractional surface coverage.20,34–36 However, these models are difficult to implement when coupled to other physics, such as electrochemical reaction and transport of dissolved species. Root squared and exponential expressions often result in complex values when evaluated under certain conditions. Vogt was wary to use simplified and ad hoc models, but was also aware of difficulties found when using fundamental models.35 A phenomenological model for gas evolution proposed by Janssen et al.37 closely relates to the system studied here. Hydrogen and oxygen bubble efficiencies at nickel and platinum-wire electrodes in alkaline solutions over current densities of 10 to 104 A m−2 were predicted by a power function:| |  | (20) |
where aG,i and nG,i are fitted parameters from experimental data for a given system. The measurements by Janssen et al. differ mainly in two aspects: the electrode material was nickel wire and the fluid was not quiescent, but flowing at 0.12 m s−1 (Re ≈ 67). Also, eqn (20) does not account directly for bubble coverage which could have a significant effect, as demonstrated previously for electrolysers operating at current densities > 100 A m−2.38 As explained in the ESI,‡ relatively low current densities (0–100 A m−2), as reported here, produced fractional bubble coverages <0.1 that do not affect gas evolution efficiencies significantly.20 For increased current densities, i.e. higher photon flux intensities or improved photo-electrodes, the effect of bubble coverage should be taken into account. However, eqn (20) is still a reasonable approximation that enables the estimation of gas evolution efficiencies as a function of local current density. A more detailed comparison between Vogt and Janssen models can be found in the ESI, Fig. S2.‡ The semi-empirical eqn (20),37 for the estimation of fG, was used in the model described here.
Volumetric mass transfer coefficient.
Gas desorption was modelled by a simple mechanism of volumetric desorption when the species is above the saturated concentration.| | | Ndesorption = kLa(csat,i − ci) | (21) |
where kL is the mass transport coefficient and a is the area of transfer per unit volume. Usually, these values are reported as kLa, the volumetric mass transfer coefficient. The seminal work by Frossling39 has been used widely40 to estimate kL as a function of Re and Sc numbers for bubbles with diameters 0.1 to 2 mm.| |  | (22) |
The minimum average bubble diameter for mass transport under quasi-static conditions in a variety of electrolytes, including 1 M KOH, was found to be dB = 4.5 × 10⁻⁴ m.41 This value can be used to estimate the bubble slip velocity (relative to the liquid) using the Wüest relationship.42,43
| |  | (23) |
Then, Re and Sc are calculated as usual for a spherical geometry:
| |  | (24) |
| |  | (25) |
where
υ is the kinematic viscosity of the fluid and
Di is the diffusion coefficient of the oxygen or hydrogen in the liquid, see a detailed list of used parameters in the ESI, Table S2.
‡ The area of transfer per unit volume,
a, can be estimated using the correlation by Deckwer:
40,44where
εG is the gas holdup, which can be estimated graphically as a function of
vB (
ref. 45) or using the correlation by Joshi and Sharma:
40,46| |  | (27) |
Table S2 in the ESI‡ provides the results of a detailed numerical calculation of kLa, which has values of 1.94 × 10⁻⁴ s−1 for oxygen and 3.02 × 10⁻⁴ s−1 for hydrogen at 298 K and in quiescent solutions. These values are similar to the predictions by Wüest43 (2.76 × 10⁻⁴ s−1), but are significantly lower than those predicted by Deckwer45 for oxygen absorption and desorption in tap water for a well stirred reactor (3.58 × 10⁻² and 9.96 × 10⁻² s−1, respectively). The differences with the latter values were due to the absence of electrolyte flow and convection effects in the reactors.
Diffusion of dissolved species
Dissolved gases, oxygen and hydrogen, were modelled by the convection–diffusion equation:| |  | (28) |
where ci is the concentration of the species i, Di is the diffusion coefficient, v is the velocity of the fluid, and R is the reaction rate or in this case the rate of desorption. Assuming the absence of homogeneous reactions and convection effects, the equation simplifies to:| |  | (30) |
The flux density of species at the surface of the electrode was modelled according to Faraday's law of electrolysis and reaction stoichiometries for water splitting under alkaline conditions, hydrogen evolution reaction (HER) by reaction (33) and oxygen evolution reaction (OER) by reaction (34), which can also be expressed in terms of photo-generated oxidising species, h+, by re-allocating the charge on the right-hand side of the reaction.
| |  | (31) |
| |  | (32) |
| | | 2H2O + 2e− ⇔ H2 + 2OH− | (33) |
| | | O2 + 2H2O + 4e− ⇔ 4OH− | (34) |
In the case of electrolyte|membrane interfaces, the concentrations of oxygen and hydrogen at the interface were modelled using a partition coefficient.
| |  | (35) |
The partition coefficient was estimated from the saturated concentrations in the membrane and electrolyte, as follows:
| |  | (36) |
In some cases, OH− ions were also included with an initial concentration of 1 M. However, the depletion and increase in concentration at the anode and cathode, respectively, prevented the model from converging to a steady state solution during long term simulations, specifically when a cation-permeable membrane was used to separate the catholyte and anolyte. A quasi-steady state was considered, i.e. depletion rates of OH− in the bulk were very slow compared to the rates of other processes in the model.
Finally, the flux densities of hydrogen and oxygen, Ni, are defined as the total amount of the gas coming from bubble formation at the surface of the electrode and desorption in the electrolyte, or the catholyte and anolyte when a membrane is used, according to eqn (37). Fluxes were normalized by the area of the electrodes, defined as hydrogen flux density and reported as mol m2 s−1. The faradaic efficiency, Φei, for hydrogen and oxygen evolution is defined as usual: the ratio between the charge transferred for the hydrogen evolution (HER) or oxygen evolution reaction (OER), and the total charge transferred at the electrode, according to eqn (38). The collection efficiency, Φcollection,i, is defined here as the ratio between the flux density and the maximum achievable gas evolution rate given by the total current at the electrode and Faraday's law, according to eqn (39). The collection efficiency is intrinsically related to the cross-over of products between the anolyte and catholyte, via the membrane if present.
| | | Ni = NG,i + Ndesorption,i | (37) |
| |  | (38) |
| |  | (39) |
An overall efficiency for a photo-electrochemical device was estimated following the definition proposed previously19 for photo-electrodes operating under an electrical bias: assisted solar to hydrogen efficiency (ASTH). This efficiency is defined as the power associated with the rate of hydrogen evolution (hydrogen flux density) divided by the power input to the system (combination of photons and electrical bias in this case):
| |  | (40) |
Boundary conditions
Boundary conditions for the 1D model are described in Fig. 3. Photo- and dark current densities were calculated at the boundary electrode|electrolyte. The potential applied through the system was set by the potential at the anode vs. the reference potential (the RHE at the cathode). The spatial distribution of electric potential, eqn (17), is then solved between the electrodes in such a way that the cell potential difference is resolved for ΔUbias = ϕa − ϕc. Similarly, the flux density of species, associated with currents by Faraday's law, was coupled to the transport of species at the electrode|electrolyte interface. Bubble evolution and gas desorption rates were estimated after volumetric integration along the electrolyte to compute the rate of oxygen and hydrogen collection in the anolyte and catholyte, respectively. The oxidation of hydrogen and reduction of oxygen at the anode and cathode, respectively, were assumed to be controlled by mass transport, i.e. assuming concentrations of these species at the electrode is zero. The concentration in the membrane was limited by the solubility of gas in the membrane (saturation concentration).
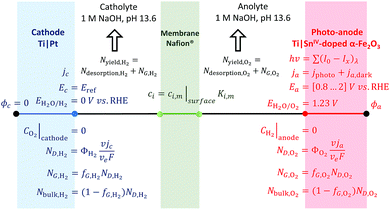 |
| | Fig. 3 Scheme of boundary conditions for the 1D model of a photo-electrochemical reactor with four interfaces: cathode|catholyte|membrane|anolyte|photo-anode and electrodes facing each other. | |
The same boundary conditions can be applied for 2D and 3D geometries, with different distances between electrodes, membranes and perforations and different electrode arrangements. For a simplified 1D model, the electrode surfaces were facing each other and 0.02 m apart, the membrane was 330 μm thick and positioned equidistant from the 740 μm thick electrodes.
Model summary
The prediction of photocurrent densities, accounting for interfacial and bulk electron–hole recombination rates, and the efficiency of gas evolution were modelled by semi-empirical correlations. The prediction of dark current densities, diffusion and volumetric desorption of dissolved gases were modelled using well-established functions, based on fundamental properties of the system.
A summary of all parameters from the literature,37,47–52 and input to the model, is presented in the ESI, Table S5.‡
Experimental
Photo-anode fabrication
SnIV-doped α-Fe2O3 photo-anode films deposited on titanium and FTO were fabricated by spray pyrolysis, following a similar procedure reported previously.19,53 In brief, the precursor solution comprised 0.1 M FeCl3·6H2O (99.99%, Sigma Aldrich, UK) and 6 × 10⁻⁴ M SnCl4 (99.995 Sigma Aldrich, UK) dissolved in ethanol absolute (AnalaR Normapur, VWR), with SnIV concentrations corresponding to 1.3% mass doping relative to FeIII. The precursor was nebulized 40 times with a quartz spray nozzle (Meinhard, USA) controlled using WinPC-NC CNC Software (BobCad-CAM, USA) on the substrates pre-heated at 480 °C. Post-deposition annealing was done in a pre-heated oven (Elite Thermal Systems, Ltd.) in air at atmospheric pressure at 400 and 500 °C over an hour.
Photo-anode characterisation
A photo-electrochemical cell of 0.06 dm3 (PVC body with a quartz window) was used for the electrochemical characterisation of photo-anodes. A potentiostat/galvanostat (Autolab PGSTAT 30) was used to control the three-electrode cell. Hematite samples acted as working electrodes, a platinised titanium mesh (Expanded Metal Company, UK) as a counter electrode and HgO|Hg as a reference electrode (0.913 V vs. the RHE and 0.109 V vs. the SHE). 1 M NaOH was used as an electrolyte (pH 13.6) at room temperature, ca. 25 °C. Hydrogen peroxide, H2O2 (30%, AnalaR Normapur, VWR) was added in some cases as a sacrificial electron donor (hole scavenger) at a concentration of 0.5 M. A Xe arc lamp (LOT-Oriel) of 300 W with Fresnel lenses was used to obtain a beam of 3 mm × 6 mm and a maximum power intensity of 3646 W m−2. The intensity of light was corrected by electrolyte and quartz attenuation to give an effective power intensity of 3000 W m−2 on the photo-anode. The light source was characterised and calibrated with a UV-vis spectrophotometer coupled to a CR2 cosine receptor (Black-Comet CXR-25, StellarNet, USA). Absorption spectra of FTO samples were obtained using a Shimadzu UV-2600 UV-vis spectrophotometer with an integrating sphere and corrected by baseline subtraction assuming reflection and scattering are wavelength independent.54 Thickness of the films deposited on FTO was measured using a stylus profilometer (TencorAlphastep200 Automatic Step Profiler). For the photo-electrochemical cell described here, i.e. small beam size to volume ratio, there was no significant increase in temperature after long term exposure to illumination.
Simulation parameters
Comsol Multiphysics 5.2a with a Batteries and Fuel Cells module was used to solve the system using the finite element method. Secondary current distribution (SIEC) and transport of diluted species (TDS) physics were coupled; gas desorption was treated as a homogeneous reaction in the electrolyte. A stationary non-linear solver with a relative tolerance of 0.001 and a maximum of 100 iterations was typically used, as with previous studies.19 The mesh was geometry dependent with a minimum element size of 4 × 10⁻⁷ m and a maximum size of 2 × 10⁻² m; the mesh was optimized for higher resolutions in narrow regions. The model converged typically in less than 20 seconds (1D) or one minute (2D) for a given set of conditions. A parametric sweep was used to evaluate a wide range of settings and geometries. The suitability of the mesh size and tolerance is demonstrated in the ESI.‡
Results and discussion
Photocurrent response of photo-anodes
Fig. 4 shows linear sweep voltammograms of Ti|SnIV-doped α-Fe2O3 samples. Samples were characterised under alkaline conditions in the presence and absence of a hole scavenger, 0.5 M H2O2. In the absence of H2O2, the effect of annealing on the surface electron–hole recombination was evident in the shift of photocurrents to lower potentials. This effect disappeared once photo-anodes were immersed in the electrolyte containing hydrogen peroxide. Maximum photocurrents were also affected by the annealing process and were comparable in the presence and absence of the hole scavenger. The decrease in the maximum photocurrent with annealing could be associated with an increase of electron–hole recombination rates in the bulk of the semiconductor. The migration of the dopant to the surface after heat treatment seemed to have been responsible for this behaviour, as discussed previously in more detail.33
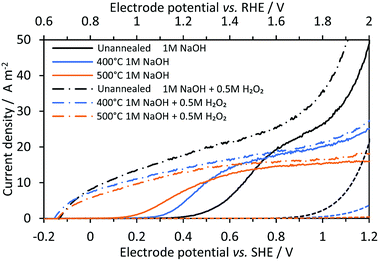 |
| | Fig. 4 Linear sweep voltammograms on Ti|SnIV-doped α-Fe2O3 annealed previously at different temperatures for 1 hour. 1 M NaOH electrolyte solution with and without 0.5 M H2O2 as the hole scavenger; 3000 W m−2 irradiation from a Xe arc lamp; 10 mV s−1 potential scan rate. Dashed lines represent dark current densities. | |
Mott–Schottky analysis was used to estimate the charge carrier concentration of the semiconductor, as shown in Fig. S3 in the ESI.‡ However, due to the presence of adventitious chloride after deposition of the photo-anode on the Ti and FTO substrate, unannealed samples exhibited unusually high values (ca. 1027 m−3). The removal of chloride by annealing was confirmed by XPS measurements. Hence, apparent donor densities of annealed samples decreased to 1.9 × 1025 m−3, in agreement with previous reports for tin(IV)-doped hematite.55 This charge carrier concentration was used for all samples in the model calculations.
The flat band potential was estimated using several methods. As shown in Fig. S4 and Table S5 in the ESI,‡ good estimations can be obtained from open circuit potential (OCP) measurements at high intensity or from the linear portion of the potential dependence of the squared photocurrent in the presence of a hole scavenger. As spray-pyrolysed hematite samples were nano-structured,33 they violated one of the assumptions of Mott–Schottky analysis: the electrode|electrolyte interface should be perfectly planar.56,57 Therefore, Mott–Schottky analysis should not be relied upon implicitly for the determination of flat band potentials of such materials.
The absorbance and absorptivity were calculated using a film thickness of 47 ± 6 nm and were very similar for all samples. The photon flux from the light source was integrated between wavelengths of 280 and 800 nm to obtain I0. Next, the absorbed photon flux I0 − Ix and the product between this and the absorptivity (I0 − Ix)α were also integrated to be used in the Gärtner–Butler equation. A typical band gap of 2.11 eV was found for all hematite samples and determined from absorbance measurements using Tauc plot analysis.54 All the spectra are reported in Fig. S5 to S7 in the ESI.‡
Electron–hole recombination rates at Ti|SnIV-doped α-Fe2O3|1 M NaOH interfaces were extracted and analysed from photo-electrochemical impedance spectroscopy (PEIS) measurements, following the methodology proposed by Peter et al.27–29
Fig. 5 shows typical impedance spectra, in which the charge transfer and recombination processes are evident at ca. 1 kHz and 1 Hz, respectively. After extracting the resistances corresponding to charge transfer, Rt, and recombination processes, Rr, Φsurface was fitted to eqn (6) as a function of the potential and fitting parameters A and B, see Fig. 6.
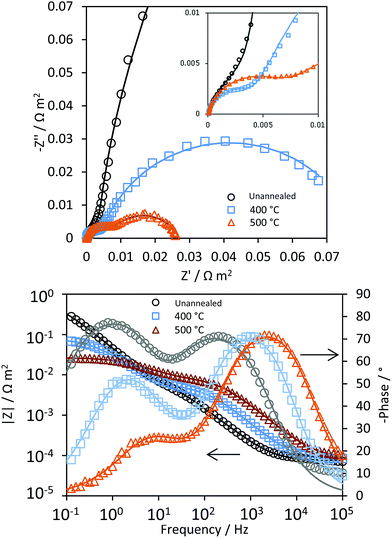 |
| | Fig. 5 Nyquist and Bode-phase plots of Ti|SnIV-doped α-Fe2O3|1 M NaOH at 1.1 V vs. the RHE obtained by PEIS under irradiation of 3000 W m−2 using a Xe arc lamp. Continuous lines represent fitting to an electrical equivalent circuit R(Q[R(RQ)]). | |
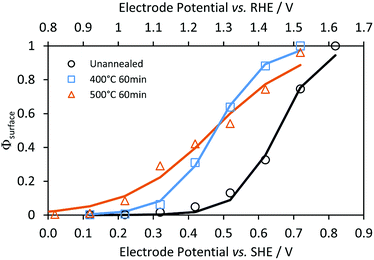 |
| | Fig. 6 Effects of electrode potential and annealing temperature on interfacial charge transfer efficiencies (symbols) and fitted exponential functions (lines, eqn (6)) for Ti|SnIV-doped α-Fe2O3|1 M NaOH. | |
Electron–hole recombination rates in bulk SnIV-doped α-Fe2O3 were derived using eqn (8) and the charge transfer efficiency (Φbulk) plotted in Fig. 7 as a function of the applied potential. Φbulk was not wholly independent of the applied potential, though the dependence was considerably less pronounced compared with Φsurface. At lower potentials, Φbulk could have been affected by residual surface recombination rates; hence, it is proposed that the values of Φbulk asymptote to their actual values as Φsurface asymptote to their maximum values. In order to estimate a constant and potential independent Φbulk for each sample, an average value was calculated in the range between 1.4 and 2 V vs. the RHE. Φbulk can also be estimated from the photo-response in the absence of a hole scavenger (1 M NaOH), but after correction for surface recombination, i.e. dividing by Φsurface. Similar values were found with this approach; data from the two methods are compared in the ESI (Fig. S8 and Table S7‡). The model uses the former values, in the presence of H2O2, as it is a more direct method, and does not require mathematical corrections due to interfacial electron–hole recombination rates in the absence of H2O2.
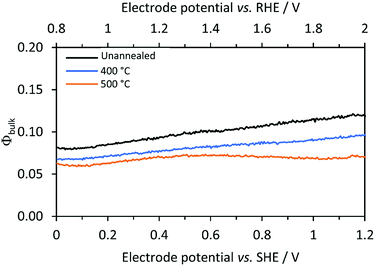 |
| | Fig. 7 Calculated bulk recombination (eqn (8)) for Ti|SnIV-doped α-Fe2O3 samples annealed at different temperatures. 1 M NaOH + 0.5 M H2O2 electrolyte and irradiation of 3000 W m−2 using a Xe arc lamp were used. | |
1D model
A summary of all measured parameters input into the model and the techniques used for their determination is presented in the ESI, Tables S3 and S4.‡
Photocurrent prediction.
Fig. 8 shows the effect of electrode potential on predicted photocurrent densities for different versions of the Gärtner–Butler equation: eqn (1), (2) and (4). The maximum achievable photocurrent density was limited significantly by absorbed photon fluxes, as expected. After correction for surface and bulk electron–hole recombination rates, j–E data exhibited behaviour typical of hematite photo-anodes. Predicted dark current densities were very low for potentials <1.6 V vs. the RHE, in agreement with experimental data shown in Fig. 4.
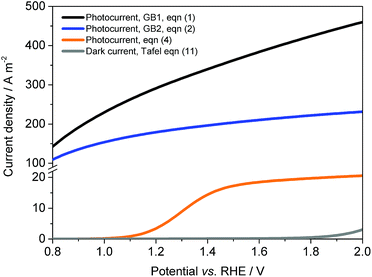 |
| | Fig. 8 Predicted photocurrent densities according to the Gärtner–Butler equation, after correction for photon absorption, eqn (1); photon flux limitation, eqn (2); and surface and bulk recombination, eqn (4). Ti|SnIV-doped α-Fe2O3 annealed at 400 °C, 1 M NaOH electrolyte and 3000 W m−2 irradiation using a Xe arc lamp. | |
Fig. 9 shows good agreement between predicted and experimental current densities (photo + dark), with regression analysis giving R2 values of 0.987, 0.994 and 0.935 for Ti|SnIV-doped α-Fe2O3 samples unannealed and annealed at 400 and 500 °C, respectively. All values input to the model were obtained from independent experimental measurements. Surface recombination,27 absorbed photon flux54 and flat band potential58 were obtained using well documented methodologies. However, charge carrier concentration values estimated from Mott–Schottky analysis can vary by several orders of magnitude from sample to sample, especially when the semiconductor surface is contaminated and nanostructured. The estimation of bulk recombination rates from measurements in the presence of a hole scavenger, suppressing surface recombination, has a known origin as discussed previously in the theoretical treatment section, but still lacks a complete fundamental explanation. For modelling purposes and assuming that these properties do not change drastically with the size of the electrode, predicted photocurrent densities can be used to predict the behaviour of up-scaled reactors using the photo-electrochemical results obtained on a small scale. In practice, larger solar simulators may produce photon flux inhomogeneities.
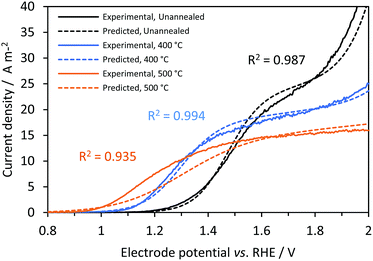 |
| | Fig. 9 Effect of electrode potential and annealing temperature on predicted (dashed) and experimental (continuous) current densities (photo + dark currents) for Ti|SnIV-doped α-Fe2O3|1 M NaOH electrolyte solution. 3000 W m−2 irradiation using a Xe arc lamp. | |
The difference between the predicted photocurrent densities and experimental results can be associated with several causes: (i) uncertainties in the measurement of photo-anode properties. Difficulties in the fitting of the impedance spectra might alter the estimated interfacial electron–hole recombination rates; this seems to be the main reason for disagreement between predicted and experimental values for the sample annealed at 500 °C. The higher the recombination rate, the easier to discriminate it from the charge transfer rate. This would also explain why the predictions for the other samples were more accurate. (ii) Irradiated photon flux can be affected by small changes in the position of the cell and a decrease of intensity with time due to degradation of the lamp. (iii) Dark current densities, predominant only at higher current densities, were dependent on the electro-active area of the electrode, which could also vary from sample to sample.
Hydrogen yield predictions in membrane-less configurations.
Hydrogen yield, faradaic and collection efficiencies were predicted for all samples in a 1D membrane-less model. Experimental data for comparison with these predictions are not available, since the anode and cathode were immersed in the same electrolyte with no gas separation and the small-scale reactor for photo-electrochemical characterisation was not gas tight. Fig. 10 shows that there was a potential for each sample at which efficiencies started to increase towards unity. These potentials correspond to the current density (jtotal ≈ 0.04 A m−2 and hydrogen flux densities of 1 × 10⁻⁹ mol m−2 s−1 for conditions used) at which bubble generation rates became significant at the surface (fG > 0.01) and desorption of gas due to the saturation near the electrode started to contribute to the hydrogen flux density, as shown in Fig. S9 in the ESI.‡ Hence, H2 gas is not effectively desorbed from the electrolyte and collection efficiencies (continuous lines in Fig. 10) were near zero. Faradaic efficiencies (dashed lines) were never below 0.4, which is the predicted value for the configuration at which reduction of oxygen occurred at the same rate as the reduction of water on the cathode; this value can be increased almost to unity if a membrane is used. The small lumps before the efficiencies start increasing are artefacts associated with a discontinuity (additional hydrogen flux density due to the sudden formation of bubbles) in the model.
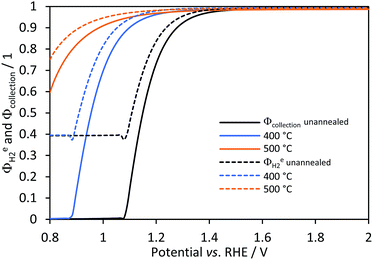 |
| | Fig. 10 Effect of (Ti|SnIV-doped α-Fe2O3|1 M NaOH) photo-anode potential on predicted faradaic (dashed) and collection efficiencies (continuous) for hydrogen evolution on Ti|Pt. | |
With increasing photo-anode potential, all efficiency values approached unity asymptotically. Hence, the contribution of bubble generation and desorption rates should be considered when operating at low current densities. However, once a certain photocurrent density threshold is reached, depending on the geometry and photo-electrode properties, the effects of potential on the faradaic and collection efficiency are minimal. Also, it is noteworthy that the collection efficiency estimated for a membrane-less reactor was estimated assuming that oxygen and hydrogen are separated effectively in a subsequent process and that the explosion limit of >4 vol% O2 in H2 is not exceeded.14
Hydrogen flux densities followed a similar pattern, as shown in Fig. 11, which plots fluxes against both current densities (bottom x-axis) and electrode potential (upper x-axis). As expected, the dependence of hydrogen flux densities on current density was independent of the photo-anode, the properties of which determined its current density–potential relationship, so hydrogen fluxes were ultimately highly dependent on the potential. At current densities less than 0.04 A m−2, bubble generation and desorption rates were predicted not to contribute to hydrogen fluxes, as most of the hydrogen was notionally oxidised at the anode, resulting in hydrogen fluxes close to zero.
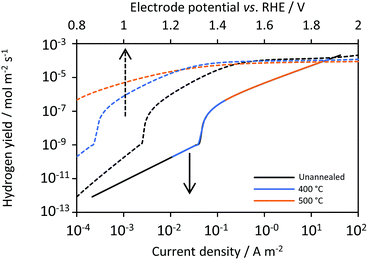 |
| | Fig. 11 Predicted effects on hydrogen flux densities of cathode current density (continuous), photo-anode potentials (dashed) and annealing temperature for Ti|SnIV-doped α-Fe2O3|1 M NaOH. | |
Hydrogen yield predictions using a membrane.
Faradaic and collection efficiencies for hydrogen evolution were estimated for the case of a cation-permeable membrane (330 μm) positioned between the electrodes. Nafion was chosen due to its chemical stability, durability and superior mechanical properties over an anion-permeable counterpart, which otherwise would have been more suitable for water splitting under alkaline conditions. However, OH− concentrations were high enough to ensure slow depletion and negligible pH changes with time. As shown in Fig. 12, faradaic efficiencies were higher and almost unity at any given potential for all samples. This demonstrates the utility of using a membrane or micro-porous separator to separate gases when operating at low current densities. On the other hand, collection efficiencies were predicted to be lower when compared to the membrane-less model, because predicted hydrogen fluxes came only from the catholyte, which was then only half of the electrolyte volume. However, the use of a membrane or micro-porous separator is more practical, as it obviates the need of further gas separation and circumvents safety issues related to hydrogen and oxygen gas mixtures.14 The discontinuities in collection efficiencies at ca. 1.3 and 1.4 V were due to gas saturation of the membrane, in which transport of hydrogen and oxygen occurs by diffusion only. Hydrogen fluxes were predicted to be slightly greater for a membrane reactor, i.e. shifted to lower current densities, but followed a similar behaviour to that shown in Fig. 11 for a membrane-less model. In this case, the tipping point of current density for gas evolution at the cathode and desorption rate was 0.025 A m−2. Hydrogen fluxes at greater current densities were the same as predicted in a membrane-less model. This means that once the current setup is operating at current densities at which gas is evolving via bubbles or desorption of saturated electrolytes, then a membrane or microporous separator is needed only to separate the products and prevent H2–O2 explosions, but otherwise is predicted not to affect the reactor performance significantly. As proposed by others,10,13 instead of using membranes, a material with pores smaller than the Sauter diameter of bubbles, usually between 5 (ref. 59 and 60) and 450 μm,41 may be sufficient to separate H2 and O2 gases. However, this will depend heavily on the (i) thickness of the microporous separator; (ii) the superficial and morphological properties of the electrodes and its effect on the size and life time of the adhered bubbles; (iii) the flow rate of the electrolyte, which affects the flow regime and physical separation of the products, which in turn is also affected by the distance and characteristic length of the electrodes.
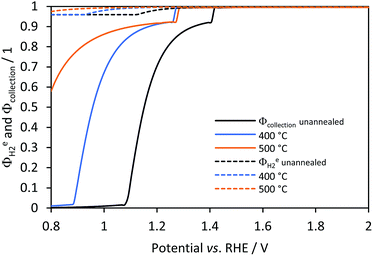 |
| | Fig. 12 Predicted effects of electrode potential faradaic (dashed) and collection efficiencies (continuous) as a function of potential for hydrogen evolution on Ti|Pt when using a photo-anode Ti|SnIV-doped α-Fe2O3|1 M NaOH and separated by using a Nafion membrane. | |
2D model
A simple monolithic photo-electrode was modelled in order to confirm the importance of geometrical optimisation, as reported previously.19 A membrane was absent for this case. The current density distribution and hydrogen fluxes of a hypothetical enhanced photo-anode material and a platinized cathode were predicted. The properties of the photo-anode were notionally enhanced in the model, to demonstrate the importance of geometrical optimisation, as current density distributions become less homogeneous and product cross-over rates are exacerbated on scale-up. The properties of this hypothetical photo-anode are described in the ESI, Table S8.‡ Surface and bulk recombination were minimized; its band gap was decreased to 1.7 eV, so that the wavelength corresponding to the photon absorption edge was increased to 729 nm. Photon fluxes were taken from the solar AM1.5D spectrum. A membrane was not included in the model, but hydrogen fluxes were integrated only over the 1 M NaOH catholyte. The electrolyte volume (projected as 2D) was proportional to the electrode length on both dimensions.
Fig. 13 shows the resulting current density distribution for 1 V vs. the RHE electrical bias as a function of the relative distance to the edge of the electrode. A significant decrease of local current densities (mostly photocurrent densities at this potential) was predicted along the photo-electrode, especially for electrodes with characteristic lengths > 0.02 m. These results are not as severe as the reported current distributions for neutral pH.14 After integration of current densities on the anode and hydrogen fluxes in the catholyte, collection and faradaic efficiencies were also predicted, as shown in Fig. 14. Total current densities (normalized by the length of the electrode) were greater for shorter electrodes, as implied by the current density distributions shown in Fig. 13. However, hydrogen fluxes were smaller for shorter electrodes and reached a maximum at ca. 0.01 m, with a subsequent decrease for longer electrodes. A similar behaviour was predicted in ASTH efficiencies as a function of length. This means that due to cross-over losses and current density distributions, there is an optimized length at which photo-electrodes should be fabricated. Faradaic and collection efficiencies are also reported in Fig. 14.
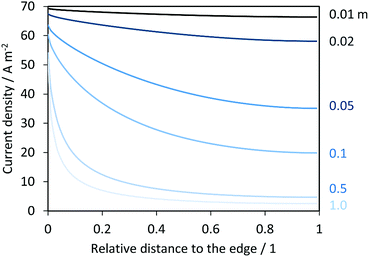 |
| | Fig. 13 Current density distributions over the length of a hypothetical enhanced photo-anode operating at 1 V vs. the RHE in 1 M NaOH and in the absence of a membrane. Distances are relative to the total length of the electrode varied between 0.01 and 1 m, and the edge at relative distance 0. | |
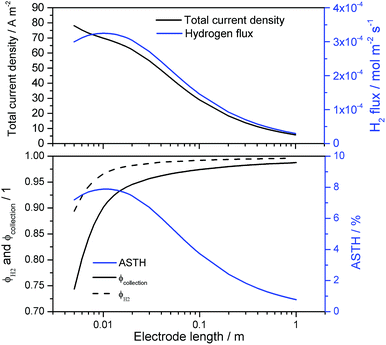 |
| | Fig. 14 Current density and hydrogen flux (top); faradaic, collection and ASTH efficiency (bottom) as a function of the electrode length for ‘enhanced’ photo-anode operating at 1 V vs. the RHE in 1 M NaOH and in the absence of a membrane. | |
As expected for electrodes shorter than 0.03 m, the cross-over losses and reduction of oxygen at the cathode, causing loss of faradaic efficiencies, were significant. For longer electrodes, both efficiency values approached unity asymptotically. Electrochemical reduction of oxygen at the cathode occurred close to the cathode edge, at which overpotentials were highest, decreasing towards the centre. Hence, longer cathodes will have less area at which oxygen reduction occurs, so increasing average faradaic efficiencies and gas collection efficiencies. The consequences of current density distributions and cross-over losses for ASTH efficiencies and hydrogen flux data in Fig. 14 emphasise the importance of geometrical optimisation.
Given a set of electrode arrangements and having characterised materials with a set of methodologies proposed here, it is possible to use this model to define the optimized conditions to achieve the highest ASTH and hydrogen fluxes. More detailed results and comparisons with other efficiency definitions (ABPE and AB-STH) can be found in the ESI, Fig. S11.‡
For the case presented above, product-gas cross-over, i.e. H2 flux in the anolyte and O2 in the catholyte, was not as severe as reported by Jin.14 For small electrodes (<0.01 m), product-gas cross-overs were ca. 2% to 10% molar for oxygen and hydrogen in the catholyte and anolyte, respectively. This still represents a safety issue and increased risk associated with ignition of stored products.10,14 For electrodes longer than 0.1 m, the predicted product-gas cross-over was <2% in both cases. If a membrane is used, the amount of hydrogen collected in the anolyte reached zero values, as predicted by the 1D model, due to the low fluxes of hydrogen and oxygen crossing between the anolyte and catholyte are effectively anodically oxidised and cathodically reduced, respectively. A more detailed discussion of the effects of membranes on the geometrical optimisation of photo-electrodes will be reported in part II of this series of papers.
Conclusions
A model for photo-electrochemical reactors was developed to describe the behaviour of SnIV-doped α-Fe2O3 photo-anodes deposited on titanium and annealed in air at different temperatures. Photo-anodes were characterised in terms of photon absorption, electron–hole recombination rates in the bulk semiconductor and at the semiconductor|electrolyte interface, and other electrochemical parameters obtained experimentally. Charge carrier concentration and bulk recombination rates were found to require special care and theoretical treatment for their estimations. The predicted values showed good agreement with experimental data. For the first time, bubble formation rates at the electrodes and in the bulk of electrolyte solution under supersaturated conditions were predicted as a function of current density; hence, the reactor performance did not increase drastically by including a membrane or microporous separator when operating at current densities > 0.04 A m−2, as shown in Fig. 11. This critical current density depended mainly on the geometry and properties of the photo-anode. Faradaic efficiencies for hydrogen formation reached unity when the photo-anode was operating at a sufficiently high potential or at all potentials when the reactor incorporated a membrane separator. In addition, product collection efficiencies and current density distributions were predicted successfully for a hypothetical photo-anode with ‘enhanced’ behaviour and are decisive parameters for further geometrical optimisation of the electrodes. The electrolyte flow, light scattering and reflection due to bubbles and other optical phenomena, pH and temperature changes were not included in the present model, which will be extended to include them, based on the studies of Singh,15 Haussener16 and Holmes-Gentle.61
Conflicts of interest
There are no conflicts to declare.
Nomenclature
|
a
| Area of transfer per unit volume, m−1 |
|
A
a
| Tafel slope for oxygen evolution at the anode, V dec−1 |
|
a
G,i
| Janssen parameter (a) for gas evolution of species i, — |
| ASTH | Assisted solar to hydrogen efficiency, 1 |
|
c
i
| Concentration of species i, mol m−3 |
|
c
sat,i
| Saturated concentration of species i, mol m−3 |
|
d
B
| Sauter diameter of bubbles, m |
|
d
i
| Electrolyte path length, m |
|
D
i
| Diffusion coefficient of species i, m2 s−1 |
|
e
| Electronic charge, 1.6022 × 10⁻¹⁹, C |
|
E
H2
| Energy per mole of hydrogen, 236![[thin space (1/6-em)]](https://www.rsc.org/images/entities/char_2009.gif) 000, J mol−1 000, J mol−1 |
|
F
| Faraday constant, 96![[thin space (1/6-em)]](https://www.rsc.org/images/entities/char_2009.gif) 484.6, C mol−1 484.6, C mol−1 |
|
f
G
| Efficiency of gas evolution, 1 |
|
I
| Current, A |
|
I
0
| Incident photon flux, m−2 s−1 |
|
I
x
| Transmitted photon flux at thickness x, m−2 s−1 |
|
j
| Current density, A m−2 |
|
j
0,a
| Exchange current density at the anode, A m−2 |
|
j
0,c
| Exchange current density at the cathode, A m−2 |
|
j
ph
| Photocurrent density, A m−2 |
|
k
B
| Boltzmann constant, 1.3806 × 10⁻²³, J K−1 |
|
K
i,m
| Partition coefficient of species i at the membrane|electrolyte interface, 1 |
|
k
L
| Mass transfer coefficient of gas dissolved in liquid, m s−1 |
|
k
L
a
| Volumetric mass transfer coefficient in liquid, s−1 |
|
k
r
| Rate constant of e–h recombination, s−1 |
|
k
t
| Rate constant of charge transfer in semiconductor, s−1 |
|
n
0
| Charge carrier concentration, m−3 |
|
n
g,i
| Janssen parameter (n) for gas evolution of species i, — |
|
ν
i
| Electron stoichiometry or charge number for reaction i, — |
|
N
bulk
| Flux of dissolved gas transferred by diffusion, mol m−2 s−1 |
|
N
i
| Flux of species i, mol m−2 s−1 |
|
N
D
| Total flux of gas evolving at the electrode surface, mol m−2 s−1 |
|
N
desorption
| Flux of gas evolving by desorption, mol m−2 s−1 |
|
N
G
| Flux of gas evolving as bubbles at the electrode, mol m−2 s−1 |
|
P
0
| Power intensity of the light source, W m−2 |
|
p
i
| Partial pressure of gas i, Pa |
|
R
| Gas constant, 8.31445, J mol−1 K−1 |
|
R
2
| Coefficient of determination, 4 |
| Re | Reynolds number, 1 |
|
R
i
| Volumetric reaction rate of species i, mol m−3 s−1 |
|
R
r
| Resistance of e–h recombination at the electrode, Ω m2 |
|
R
t
| Resistance of charge transfer at the electrode, Ω m2 |
| Sc | Schmidt number, 1 |
|
T
| Temperature, K |
| ΔUbias | Electric potential difference (bias), V |
|
U
H2O|H2
| Hydrogen evolution (HER) equilibrium potential, V |
|
U
O2|H2O
| Oxygen evolution (OER) equilibrium potential, V |
|
u
m,i
| Mobility of species i, m2 V−1 s−1 |
|
v
| Velocity of fluid, m s−1 |
|
v
B
| Bubble slip velocity relative to the liquid, m s−1 |
|
x
| Thickness of thin film semiconductor, m |
|
z
i
| Charge of species i, — |
Greek symbols
|
α
λ
| Absorptivity coefficient at wavelength, λ m−1 |
|
α
ox,c
| Anodic transfer coefficient at the cathode, 1 |
|
α
red,c
| Cathodic transfer coefficient at the cathode, 1 |
|
ε
0
| Vacuum permittivity, 8.85 × 10⁻¹², F m−1 |
|
ε
r
| Relative permittivity, 1 |
|
ε
G
| Gas holdup, 1 |
|
η
a
| Overpotential for oxygen evolution at the anode, V |
|
η
c
| Overpotential for hydrogen evolution at the cathode, V |
|
λ
| Wavelength, nm |
|
ν
i
| Stoichiometry coefficient of species i, — |
|
σ
| Electrical conductivity, S m−1 |
|
υ
| Kinematic viscosity, m s−1 |
|
ϕ
| Electric potential, V |
|
Φ
ei
| Faraday efficiency of species i, 1 |
|
Φ
bulk
| Bulk electron–hole recombination efficiency, 1 |
|
Φ
collection,i
| Collection efficiency of species i, 1 |
|
Φ
surface
| Interfacial charge transfer efficiency, 1 |
| ΔϕSC | Band bending of semiconductor, V |
Acknowledgements
The authors thank the UK Engineering and Physical Sciences Research Council for a post-doctoral research associateship for AH, and the Colombian Government for a COLCIENCIAS scholarship 568 for PhD studies abroad for FB.
References
- J. Jia, L. C. Seitz, J. D. Benck, Y. Huo, Y. Chen, J. W. D. Ng, T. Bilir, J. S. Harris and T. F. Jaramillo, Nat. Commun., 2016, 7, 13237 CrossRef CAS PubMed.
- B. Turan, J.-P. Becker, F. Urbain, F. Finger, U. Rau and S. Haas, Nat. Commun., 2016, 7, 12681 CrossRef PubMed.
- A. Landman, H. Dotan, G. E. Shter, M. Wullenkord, A. Houaijia, A. Maljusch, G. S. Grader and A. Rothschild, Nat. Mater., 2017, 16, 646–651 CrossRef CAS PubMed.
- Q. Wang, T. Hisatomi, Q. Jia, H. Tokudome, M. Zhong, C. Wang, Z. Pan, T. Takata, M. Nakabayashi, N. Shibata, Y. Li, I. D. Sharp, A. Kudo, T. Yamada and K. Domen, Nat. Mater., 2016, 15, 611–615 CrossRef CAS PubMed.
- M. D. Bhatt and J. S. Lee, J. Mater. Chem. A, 2015, 3, 10632–10659 CAS.
- S. P. Berglund, F. F. Abdi, P. Bogdanoff, A. Chemseddine, D. Friedrich and R. van de Krol, Chem. Mater., 2016, 28, 4231–4242 CrossRef CAS.
- A. Paracchino, V. Laporte, K. Sivula, M. Grätzel and E. Thimsen, Nat. Mater., 2011, 10, 456–461 CrossRef CAS PubMed.
- H. Gerischer, Electrochim. Acta, 1990, 35, 1677–1699 CrossRef CAS.
- C. Carver, Z. Ulissi, C. K. Ong, S. Dennison, G. H. Kelsall and K. Hellgardt, Int. J. Hydrogen Energy, 2012, 37, 2911–2923 CrossRef CAS.
- S. Haussener, C. Xiang, J. M. Spurgeon, S. Ardo, N. S. Lewis and A. Z. Weber, Energy Environ. Sci., 2012, 5, 9922–9935 CAS.
- D. M. F. Santos, C. A. C. Sequeira and J. L. Figueiredo, Quím. Nova, 2013, 36, 1176–1193 CrossRef CAS.
- A. Berger and J. Newman, J. Electrochem. Soc., 2014, 161, E3328–E3340 CrossRef CAS.
- A. Berger, R. A. Segalman and J. Newman, Energy Environ. Sci., 2014, 7, 1468–1476 CAS.
- J. Jin, K. Walczak, M. R. Singh, C. Karp, N. S. Lewis and C. Xiang, Energy Environ. Sci., 2014, 7, 3371–3380 CAS.
- M. R. Singh, C. Xiang and N. S. Lewis, Sustainable Energy & Fuels, 2017, 1, 458–466 CAS.
- S. Tembhurne and S. Haussener, J. Electrochem. Soc., 2016, 163, H988–H998 CrossRef CAS.
- Y. K. Gaudy and S. Haussener, J. Mater. Chem. A, 2016, 4, 3100–3114 CAS.
- T. Bosserez, L. Geerts, J. Rongé, F. Ceyssens, S. Haussener, R. Puers and J. A. Martens, J. Phys. Chem. C, 2016, 120, 21242–21247 CAS.
- A. Hankin, F. E. Bedoya-Lora, C. K. Ong, J. C. Alexander, F. Petter and G. H. Kelsall, Energy Environ. Sci., 2017, 10, 346–360 CAS.
- H. Vogt, Electrochim. Acta, 1984, 29, 167–173 CrossRef CAS.
- C. Carver, Z. Ulissi, C. K. Ong, S. Dennison, K. Hellgardt and G. H. Kelsall, ECS Trans., 2010, 28, 103–117 CAS.
- M. A. Modestino and S. Haussener, Annu. Rev. Chem. Biomol. Eng., 2015, 6, 13–34 CrossRef CAS PubMed.
- A. J. Leenheer and H. A. Atwater, J. Electrochem. Soc., 2010, 157, B1290–B1294 CrossRef CAS.
- M. A. Butler, J. Appl. Phys., 1977, 48, 1914–1920 CrossRef CAS.
- W. W. Gärtner, Phys. Rev., 1959, 116, 84–87 CrossRef.
- H. Dotan, K. Sivula, M. Gratzel, A. Rothschild and S. C. Warren, Energy Environ. Sci., 2011, 4, 958–964 CAS.
- K. G. Upul Wijayantha, S. Saremi-Yarahmadi and L. M. Peter, Phys. Chem. Chem. Phys., 2011, 13, 5264–5270 RSC.
- L. M. Peter, Solid State Electrochem., 2013, 17, 315–326 CrossRef CAS.
- H. K. Dunn, J. M. Feckl, A. Muller, D. Fattakhova-Rohlfing, S. G. Morehead, J. Roos, L. M. Peter, C. Scheu and T. Bein, Phys. Chem. Chem. Phys., 2014, 16, 24610–24620 RSC.
- B. Klahr, S. Gimenez, F. Fabregat-Santiago, T. Hamann and J. Bisquert, Am. Chem. Soc., 2012, 134, 4294–4302 CrossRef CAS PubMed.
- B. Hirschorn, M. E. Orazem, B. Tribollet, V. Vivier, I. Frateur and M. Musiani, Electrochim. Acta, 2010, 55, 6218–6227 CrossRef CAS.
-
L. M. Peter, in Photocatalysis: Fundamentals and Perspectives, The Royal Society of Chemistry, 2016, pp. 1–28, 10.1039/9781782622338-00001.
- F. E. Bedoya-Lora, A. Hankin, I. Holmes-Gentle, A. Regoutz, M. Nania, D. J. Payne, J. T. Cabral and G. H. Kelsall, Electrochim. Acta, 2017, 251, 1–11 CrossRef CAS.
- H. Vogt, Electrochim. Acta, 2011, 56, 1409–1416 CrossRef CAS.
- H. Vogt, Electrochim. Acta, 2011, 56, 2404–2410 CrossRef CAS.
- H. Vogt, Electrochim. Acta, 1984, 29, 175–180 CrossRef CAS.
- J. M. Chin Kwie Joe, L. J. J. Janssen, S. J. D. van Strelen, J. H. G. Verbunt and W. M. Sluyter, Electrochim. Acta, 1988, 33, 769–779 CrossRef.
- H. Vogt and R. J. Balzer, Electrochim. Acta, 2005, 50, 2073–2079 CrossRef CAS.
- N. Frossling, Gerl. Beitrage Geophys., 1938, 52, 107–216 Search PubMed.
- P. Painmanakul, J. Wachirasak, M. Jamnongwong and G. Hebrard, Eng. J., 2009, 13, 16 Search PubMed.
- G. Marrucci and L. Nicodemo, Chem. Eng. Sci., 1967, 22, 1257–1265 CrossRef CAS.
- D. F. McGinnis and J. C. Little, Water Res., 2002, 36, 4627–4635 CrossRef CAS PubMed.
- A. Wüest, N. H. Brooks and D. M. Imboden, Water Res., 1992, 28, 3235–3250 CrossRef.
-
W. D. Deckwer, Bubble Column Reactions, John Wiley, Chichester, 1992 Search PubMed.
- W. D. Deckwer, R. Burckhart and G. Zoll, Chem. Eng. Sci., 1974, 29, 2177–2188 CrossRef CAS.
- J. B. Joshi and M. M. Sharma, Trans. Inst. Chem. Eng., 1979, 57, 244–251 CAS.
- W. Sheng, H. A. Gasteiger and Y. Shao-Horn, J. Electrochem. Soc., 2010, 157, B1529–B1536 CrossRef CAS.
- R. W. Powell and R. P. Tye, J. Less Common. Met., 1961, 3, 226–233 CrossRef CAS.
- Y. Sone, P. Ekdunge and D. Simonsson, J. Electrochem. Soc., 1996, 143, 1254–1259 CrossRef CAS.
- A. T. Haug and R. E. White, J. Electrochem. Soc., 2000, 147, 980–983 CrossRef CAS.
- Z. Ogumi, T. Kuroe and Z. i. Takehara, J. Electrochem. Soc., 1985, 132, 2601–2605 CrossRef CAS.
- S. H. Lee, Bull. Korean Chem. Soc., 2013, 34, 2925–2930 CrossRef CAS.
- F. Bedoya-Lora, A. Hankin and G. H. Kelsall, Electrochem. Commun., 2016, 68, 19–22 CrossRef CAS.
-
H. N. D. Zhebo Chen and E. Miller, Photoelectrochemical Water Splitting Standards, Experimental Methods, and Protocols, Springer, 2013 Search PubMed.
- V. M. Aroutiounian, V. M. Arakelyan, G. E. Shahnazaryan, H. R. Hovhannisyan, H. Wang and J. A. Turner, Sol. Energy, 2007, 81, 1369–1376 CrossRef CAS.
- A. Hankin, J. C. Alexander and G. H. Kelsall, Phy. Chem. Chem. Phys., 2014, 16, 16176–16186 RSC.
- R. De Gryse, W. P. Gomes, F. Cardon and J. Vennik, J. Electrochem. Soc., 1975, 122, 711–712 CrossRef CAS.
- W. P. Gomes and F. Cardon, Pro. Surf. Sci., 1982, 12, 155–215 CrossRef CAS.
- S. Shibata, Bull. Chem. Soc. Jpn., 1963, 36, 53–57 CrossRef CAS.
- S. Shibata, Electrochim. Acta, 1978, 23, 619–623 CrossRef CAS.
- I. Holmes-Gentle, F. Hoffmann, C. A. Mesa and K. Hellgardt, Sustainable Energy & Fuels, 2017, 1, 1184–1198 CAS.
Footnotes |
| † The underlying research data for this paper is available in accordance with EPSRC open data policy from http://https://zenodo.org/record/1003154#.Weo8o1tyJQI |
| ‡ Electronic supplementary information (ESI) available. See DOI: 10.1039/c7ta05125e |
|
| This journal is © The Royal Society of Chemistry 2017 |
Click here to see how this site uses Cookies. View our privacy policy here.  Open Access Article
 *,
Anna
Hankin
 and
Geoff H.
Kelsall


 . Hence, Φbulk is a function of potential. We propose here a modified version of this equation to decouple the dependence of Φbulk from the potential and, instead, account for this dependence in the photocurrent as predicted by the Gärtner–Butler equation:


![[thin space (1/6-em)]](https://www.rsc.org/images/entities/char_2009.gif) log(pO2)
log(pO2)
![[thin space (1/6-em)]](https://www.rsc.org/images/entities/char_2009.gif) log
log![[thin space (1/6-em)]](https://www.rsc.org/images/entities/char_2009.gif) pH2
pH2


![[thin space (1/6-em)]](https://www.rsc.org/images/entities/char_2009.gif) 000, J mol−1
000, J mol−1![[thin space (1/6-em)]](https://www.rsc.org/images/entities/char_2009.gif) 484.6, C mol−1
484.6, C mol−1


