 Open Access Article
Creative Commons Attribution 3.0 Unported Licence
Trends in the phase stability and thermochemical oxygen exchange of ceria doped with potentially tetravalent metals†
Roger
Jacot
a,
René
Moré
a,
Ronald
Michalsky
 b,
Aldo
Steinfeld
 b and
Greta R.
Patzke
 *a
*a
aUniversity of Zurich, Department of Chemistry, Winterthurerstrasse 190, CH-8057 Zurich, Switzerland. E-mail: greta.patzke@chem.uzh.ch
bDepartment of Mechanical and Process Engineering, ETH Zurich, Sonneggstrasse 3, CH-8092 Zurich, Switzerland
First published on 12th September 2017
Abstract
Ceria is among the most prominent materials for generating clean fuels through solar thermochemical CO2 reduction and water splitting. The main optimization parameter for ceria in solar reactors is the oxygen exchange capacity (OEC, Δδ), which can be notably improved through various dopant types. Among them, tetravalent dopants excel through the formation of active vacancies which lead to particularly high OEC values. We thus performed a comprehensive screening evaluation of all dopants in the periodic table which have been reported to adopt an oxidation state of +IV. All thermally stable doped ceria samples, M0.1Ce0.9O2−δ (M = Si, Ti, V, Cr, Zr, Nb, Rh, Hf, Ta, Nb, V, Pr, and Tb), were first analyzed for Δδ improvement with thermogravimetric analysis (TGA). Dopant solubility limits and behavior in the ceria host lattice was evaluated with scanning electron microscopy (SEM-EDX) and powder X-ray diffraction techniques. No indications for carbonate side product formation were found. Hf-, Zr-, and Ta-doped ceria display higher OEC than pristine ceria, and Raman spectroscopy indicated that their improved performance is accompanied by a higher versatility in the underlying vacancy formation processes. Furthermore, the effective dopant radii are close to an optimal dopant radius around 0.8 Å for maximum Δδ according to TGA cycling experiments. These experimentally derived trends for doped ceria were supported by density functional theory (DFT) calculations which analogously correlate Δδ with the partial electronic charge of the metal dopants.
1. Introduction
Solar thermochemical splitting of CO2 and H2O utilizes the entire spectrum of sunlight to produce CO and H2 (syngas) as precursors for the production of synthetic liquid hydrocarbon fuels via the Fischer–Tropsch process and other established gas-to-liquid technologies.1,2 Nonstoichiometric ceria (CeO2−δ) has emerged as benchmark redox material for thermochemical splitting of CO2 and H2O through solar-driven two-step temperature/pressure-swing redox cycles (cf.eqn (1), (2a) and (2b)). In a first step, concentrated solar radiation is utilized in the form of high-temperature process heat to endothermically reduce ceria at high temperature and low partial pressure of O2 (pO2) yielding oxygen vacancies in the solid phase and O2 gas (eqn (1)). The oxygen vacancies are utilized in a second step in which ceria is exothermically oxidized to abstract oxygen from CO2 yielding CO (eqn (2a)) or from H2O yielding H2 (eqn (2b)). The difference between the thermochemically stable oxygen nonstoichiometry of the redox material at oxidizing conditions (δoxi) and reducing conditions (δred) is the oxygen exchange capacity (OEC, Δδ = δred − δoxi). | (1) |
 | (2a) |
 | (2b) |
The OEC is a key optimization parameter for rational materials design, as it correlates directly with the specific amount of fuel that can be produced per mass of solid cycled. Typically, materials design strategies aim for increasing the OEC over that of a benchmark redox material, such as CeO2−δ, at a specific set of process conditions. Alternatively, materials thermochemically less stable than CeO2−δ, such as various perovskites, are currently investigated for reaching an OEC comparable to that of CeO2−δ while liberating O2 at lower temperatures. To increase the OEC, to accelerate the redox kinetics, and to increase the thermo-mechanical stability, previous studies have considered metal cation doping of perovskites,3–8 spinel-,9–11 ceria,12,13 and ceria-based14–17 metal oxide redox materials. However, the use of different performance criteria, process conditions, and reference materials complicates a conclusive assessment of metal doping strategies.
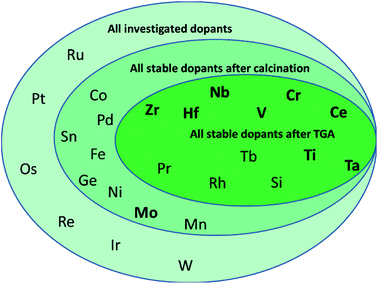
To determine, quantify, and rationalize systematic trends in the thermo-mechanical stability and the capacity and kinetics of the oxygen exchange reactions with CeO2−δ, this work evaluates comprehensively all metals of the periodic system that can access the +IV oxidation state in principle, as shown in Scheme 1. We focus on tetravalent metal dopants, because they change the redox-activity of oxygen vacancies at cycle conditions without changing the oxygen nonstoichiometry at ambient conditions. Tetravalent metal dopants have been reported to improve the OEC of ceria,18 most notably through Zr4+ and Hf4+, which was rationalized with energy storage in the form of tensile strain of the Zr– or Hf–O bonds. When such strain is released upon oxygen vacancy formation, the endothermic character of the ceria reduction is favorably maintained.19
In comparison, metal dopants with oxidation states below or above +IV, especially trivalent and pentavalent ions, maintain electroneutrality through introduction of oxygen vacancies that are in principle more stable at ambient and cycle conditions. These oxygen vacancies are redox-inactive, as electrons are insufficiently promoted upon ceria reduction into the high energy Ce f-band, thereby limiting the oxidation reaction.19 However, metal dopants that introduce stable oxygen vacancies may increase the oxygen ion conductivity1,20,21 and redox kinetics, such as reported for 15% Sm-doped CeO2−δ.22 In contrast, anti-sintering agents, such as Al2O3, La2O3, SiO2, and Pt for (doped) ceria,23–25 remain inert and act as “crystallite spacers” preventing CeO2−δ from sintering. Since tri- and lower valent metal dopants have been well studied and are also prominent anti-sintering agents,25,26 we newly evaluate in this work tetravalent metal dopants for their comprehensive properties.
The present screening of nominal D0.1Ce0.9O2−δ redox materials for all potentially tetravalent metal dopants (D) is structured as follows: Section 3.1 outlines the screening strategy and limits the set of suitable dopants by experimental investigation of the thermochemical stability. Section 3.2 assesses experimentally the performance of doped ceria for solar-driven CO2 splitting at equal cycle conditions and relative to pristine CeO2−δ as a reference, employing the OEC and the rates of ceria reduction and oxidation as performance indicators. Sintering behavior and changes in the oxidation state and coordination of the dopants are discussed as well. Section 3.3 continues with screening for systematic trends and correlates the experimental data with the effective ionic radii of the dopants as given in the literature.40 This approach is motivated by previous studies indicating a trade-off between the extent of ceria reduction and oxidation that depends on the ionic radii of the dopants.14,26 Finally, Section 3.4 reports a linear correlation of the OEC with the partial electronic charge of the metal cation dopant at D0.25Ce0.75O2(111) surfaces computed via density functional theory (DFT). These investigations are inspired by previous DFT studies of the redox energetics for various metal oxide surfaces and bulk compositions,35 and they are rationalized with oxide oxidation-limited redox energetics at the selected cycle conditions.
2. Experimental section
2.1 Materials synthesis
All doped ceria samples were synthesized by a modified Pechini-type sol–gel method,15 starting from a ratio of 1.5 mol citric acid per 1 mol metal cation. All samples were calcined at 1100 °C for 24 h. The starting materials were Ce(NO3)3·6H2O (99%), ZrO(NO3)2·6.3H2O (99%), HfCl4 (99.9%), TaCl5 (99.8%), SnCl4·5H2O (98%), MoCl5 (98%), WCl4 (97%), NbCl5 (99%), NH4VO3 (98.5%), Cr(NO3)3·9H2O (98%), Pr(NO3)3·5H2O (98%), Tb(NO3)3·5H2O (99.9%), SiCl4 (99.0%, purchased from Merck), Pd(NO3)2·2H2O (∼40% Pd basis, from Fluka), H2(PtCl6)·6H2O (∼40% Pt, from Merck), IrCl3·3H2O (99.8%, from Alfa Aesar), RuCl3 hydrate (40% Ru, from Johnson Matthey & Brandenberger AG), CH3ReCl3 (71–76%), OsCl3 (99.9%), Co(NO3)2·6H2O (≥98%), Fe(NO3)3·6H2O (99.99%), GeCl4 (99.99%), Ni(NO3)2·6H2O (99.999%), Mn(NO3)2·6H2O (98% from Alfa Aesar), Rh(II)acetate (99.99%), TiCl4 (99.99%), and anhydrous citric acid (99%). If not specified otherwise, chemicals were purchased from Sigma-Aldrich. If not noted otherwise, ceria doped at about 10% with a stable metal dopant (D) was evaluated further, i.e., materials with an ideal D0.1Ce0.9O2−δ stoichiometry, abbreviated for clarity with “10D”.2.2 Materials characterization
Inductive coupled plasma mass spectrometry (ICP-MS) measurements were performed with an Agilent Technologies QQQ 8800 Triple quad ICP-MS spectrometer, equipped with a standard x-lens setting, nickel cones and a “micro-mist” quartz nebulizer (for experimental details cf. ESI†). The elemental compositions of the metal oxide samples were mapped by energy dispersive X-ray spectroscopy (EDX) performed on a Jeol JSM 6060 scanning electron microscope (SEM) equipped with a EDX Bruker AXS 1333 eV X Flash detector 4010 (with an acceleration voltage of 30 kV). Powder samples were dispersed in ethanol (abs.) and deposited on carbon tape which was fixed on the sample holder of the SEM. Samples were allowed to dry at ambient conditions. SEM images were then recorded on a Zeiss SUPRA 50VP SEM using the SE2 detector, an acceleration voltage of 10 kV, and a working distance of 3 mm. Powder X-ray diffraction (PXRD) patterns were recorded on a STOE STADI P diffractometer equipped with a DECTRIS MYTHEN 1K detector in transmission mode using a Ge monochromator for Cu Kα1 radiation. UV/Vis spectra of the powder samples placed into in a 0.1 mm powder cuvette were recorded on a Perkin Elmer Lambda 650S spectrometer in diffuse reflectance mode. Background calibration was performed using a standard Teflon background (labsphere certified reflectance standard USRS-99-020; AS-01159-060). FT-IR spectroscopy was performed with a Bruker Vertex 70 spectrometer equipped with a Pt ATR (attenuated total reflection) in transmittance mode. Raman spectra were recorded on a Renishaw Ramascope 1000 spectrometer equipped with a 780 nm diode laser from Renishaw with 50 mW capacity. To improve the signal to noise ratio, we used detection times of about 120 s.2.3 Thermogravimetric cycling
Thermogravimetric analysis (TGA) of the ceria samples was conducted using a Netzsch Jupiter STA 449 F3 TGA. The measurements were performed with about 100 mg powder samples placed into a shortened Al2O3 crucible (Netzsch 3.4 mL GB445213). The crucible was cut 12 mm from the top, just to the beginning of the round bottom, to expose a consistently high specific sample surface area in these experiments. To consistently dry and oxidize the samples before TGA analysis (cf. yellow highlights in Fig. S1†), each experimental run started with oxidizing the samples in a gas flow of 45 mL O2 per min and 190 mL Ar per min by heating at 20 °C min−1 to 1000 °C, hold for 10 min, and subsequential cooling at 10 °C min−1 to 50 °C to provide related starting conditions for each sample. All volumes are reported in this work at standard conditions, i.e., 20 °C and 1 bar. This oxidation step followed 2.5 consecutive redox cycles with ceria reduction in 100 mL Ar per min at 1500 °C and ceria oxidation (cf. blue highlights in Fig. S1†) in a mixture of 50 mL CO2 per min and 50 mL Ar per min (i.e., pCO2 = 0.5 bar, <0.001% O2) at 1000 °C. We note, ceria oxidation has been shown previously to be independent on the use of excess CO2 within a reasonable range.27,28 The oxidation step was initiated 10 min after the sample was cooled down to 1000 °C (grey section in Fig. S1†). Ar (99.999%), O2 (99.998%), and CO2 (99.998%) were purchased from Garbagas.The OEC (Δδ) was calculated from the TGA data as the relative difference of the steady-state sample weight at reduction and re-oxidation in the second redox cycle (i.e. with the oxidation step 520–580 min after starting the cycling experiments, cf. Fig. S1† and Section 1). To represent the redox kinetics consistently for all investigated materials, we approximate the maximum rates (ri = |Δmi|/|Δti|) of ceria reduction (i = r) with the absolute mass change taken as the difference between 5% below the initial mass and 5% above the final mass (|Δmr|) and with the equivalent materials-specific duration (|Δtr|). For ceria oxidation (i = o) the absolute mass change was taken as the difference between 5% above the initial mass and 5% below the final mass (|Δmo|) and with the equivalent materials-specific duration (|Δto|) as well.
2.4 X-ray absorption spectroscopy
X-ray absorption spectroscopy (XAS) and in particular X-ray absorption near edge spectroscopy (XANES) were performed at the ESRF (Swiss-Norwegian Beamline BM01B) and SLS (Super XAS beamline) on the solid samples dispersed in cellulose at room temperature. Experiments for absorption edges below 6 keV were recorded in fluorescence mode using a vortex fluorescence detector. All spectra above 6 keV were recorded in transmission mode. As standards we used CeO2 (>99.9%), Ce(C2O4)3·9H2O (99.9%), Cr metal powder (100 mesh, 99%, Johnson Matthey & Brandenberger AG), Cr2O3 (>99%), CrO2 (Magtrieve™), K2CrO4 (>99.5%, Merck), V2O3 (98%), VO(SO4)·5H2O (99.99%), V2O5 (>99%), ZrN (>99%), ZrO2 (>99%), NbO2 (99.9%), Nb2O5 (99.5%), HfO2 (>99.95%), Pr(NO3)3 (99.9%), Pr6O11 (99.9% Fluka), TaC, Ta2O5, and Tb(NO3)3·5H2O (99.9%). If not otherwise specified, chemicals were purchased from Sigma-Aldrich. Measurement calibration, and Fourier transformation of the XAS spectra were accomplished using the Athena software, while the extended X-ray absorption fine structure (EXAFS) was fitted using the Artemis software.292.5 Electronic structure computations
In order to screen for electronic and geometric contributions of metal doping at ceria surfaces to the experimentally established trend in the oxygen exchange capacity, D0.25Ce0.75O2 (D = Ce, Ti, V, Cr, Zr, Nb, Mo, Hf, and Ta) with the cubic fluorite crystal structure were modeled via DFT, performed with the Grid-based projector-augmented wave (GPAW) code.30,31Atomic configurations were handled in the Atomic Simulation Environment (ASE).32,33 Exchange–correlation interactions were treated by the revised Perdew–Burke–Ernzerhof (RPBE) functional of Hammer, Hansen, and Nørskov34 and the line search Broyden–Fletcher–Goldfarb–Shanno (BFGS) algorithm was employed to optimize the atomic geometries until the maximum force was less than 0.05 eV Å−1. Convergence was achieved with a Fermi–Dirac smearing of 0.1 eV. Structure optimization results were extrapolated to 0 K. Modeling of metal oxides with DFT is complicated by partly localized electrons leading to correlated electronic structures. This is commonly accounted for by use of the Hubbard U model to modulate the electronic structure. Although we have reported previously that this modulation is not necessary to satisfactorily described the ceria surface,35 we follow here previous computational approaches and consistently included U = 5 eV for the Ce f states.36,37
Ceria bulk models had DCe3O8 stoichiometry, periodic boundary conditions in all directions, and all atoms were allowed to optimize their positions (relax). To avoid reminiscent stress in the calculations, the lattice constant of the CeO2 bulk was chosen as the DFT-calculated lattice constant (5.543 Å), which, with a relative error <2.5%, compares well with the experimental value (5.411 Å).38 The oxidized and reduced surfaces of the redox materials were modeled using the thermodynamically most-stable mixed-terminated CeO2(111) surface,35 with DCe3O8(111) and DCe3O7(111) stoichiometry, respectively. These models contained one upper layer, that is, DCeO4(111) and DCeO3(111), respectively, that was allowed to relax and that was stacked in z-direction atop one lower layer Ce2O4(111) that was constrained to the bulk geometry. The surfaces were modeled with 10 Å of vacuum perpendicular to the surface and the slabs were periodically repeated in the directions parallel to the surface. A k-point sampling of 4 × 4 × 4 for bulk calculations and 4 × 4 × 1 for surface calculations was used for sampling of the Brillouin zone.
3. Results and discussion
3.1 Screening strategy and thermochemical stability evaluation
Next, the optimized working point of a dopant concentration of 10% (Scheme 1 and Fig. S2†) was derived from our previous work15 and from reports of maximum ionic conductivities reached at dopant concentrations in the range of 7–10%.21 Optimization experiments (Fig. S2†) showed that the best working point for Ta-doped ceria was at slightly lower concentrations, such that the Ta content was adjusted to about 7%. Doped ceria samples were synthesized via the citrate-gel method15 and calcined. The effective dopant concentrations of the ceria samples were determined by EDX after calcination for 24 h at 1100 °C in air. Ceria samples with a stable dopant concentration of about 10% were further investigated.
Finally, the effective dopant concentrations of the ceria samples were again determined by EDX after 2.5 consecutive redox cycles, with ceria reduction at 1500 °C and ceria oxidation at 1000 °C in 0.5 bar CO2, analyzed by TGA. Ceria samples with a stable dopant concentration of about 10% were investigated further by PXRD, SEM, and various spectroscopic methods.
To determine and quantify systematic trends in the redox activity and stability of metal-doped ceria, we conclude this study by employing the experimental data to screen for systematic correlations with geometric and electronic characteristics of stable metal-doped ceria (Sections 3.3 and 3.4).
The OEC of all samples was quantified by TGA, and Fig. 1 shows the temperature and mass changes recorded during the redox cycling of pure ceria, and Zr-, Hf-, and Ta-doped ceria (all other samples are shown in Fig. S1†). To assess stable integration of the metal cations into the ceria host lattice, Table 1 summarizes the chemical composition analysis using ICP-MS of the ceria samples before and after redox cycling. ICP-MS data for 10Si were omitted due to typical problems with the measurement and sample preparation of Si-containing oxides involving hydrofluoric acid treatment (Table 1).
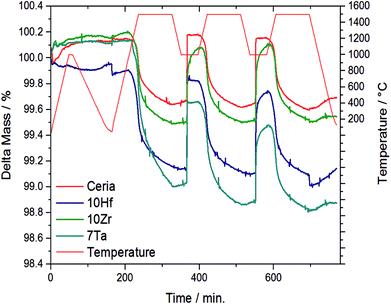 | ||
| Fig. 1 Relative mass and temperature changes monitored by TGA during 2.5 consecutive redox cycles with the three most promising and stable metal-doped ceria-based redox materials, i.e., 10Hf, 10Zr, and 7Ta, and CeO2−δ as a reference. The complete data for all investigated materials is given with ESI.† | ||
| Sample | Dopant conc. [%] (ICP-MS) | a/Å | Ionic radius40/Å (coordination) |
|---|---|---|---|
| CeO2−δ | — | 5.41190(4) | Ce(III) 1.143 |
| — | 5.41108(2) | Ce(IV) 0.97 | |
| 10Hf | 9.8 | 5.38401(8) | Hf(IV) 0.83 |
| 9.7 | 5.40962(4) | ||
| 10Zr | 10.0 | 5.38428(7) | Zr(IV) 0.84 |
| 10.1 | 5.41165(8) | ||
| 10Cr | 9.6 | 5.40995(4) | Cr(III) 0.615 (6-fold) |
| 9.4 | 5.41163(6) | Cr(IV) 0.55 (6-fold) | |
| 10Nb | 11.3 | 5.40833(9) | Nb(IV) 0.79 |
| 12.0 | 5.4350(3) | Nb(V) 0.74 | |
| 10V | 10.4 | 5.41132(5) | V(IV) 0.72 |
| 10.4 | 5.41229(6) | V(V) 0.54 (6-fold) | |
| 10Pr | 10.2 | 5.4092(4) | Pr(III) 1.126 |
| 10.3 | 5.43206(3) | Pr(IV) 0.96 | |
| 10Tb | 10.0 | 5.39809(4) | Tb(III) 1.04 |
| 10.3 | 5.41372(3) | Tb(IV) 0.88 | |
| 10Ti | 10.6 | 5.41175(4) | Ti(IV) 0.74 |
| 10.9 | 5.4138(1) | ||
| 7Ta | 7.2 | 5.41051(6) | Ta(IV) 0.68 (6-fold) |
| 7.3 | 5.43661(9) | Ta(V) 0.74 | |
| 10Rh | 14.0 | 5.41219(6) | Rh(IV) 0.6 (6-fold) |
| 14.1 | 5.41098(7) | ||
| 10Si | — | 5.41208(5) 5.41179(5) | Si(IV) 0.4 (6-fold) |
From this data we suggest that the three most promising ceria-based redox materials are 10Zr, 10Hf, and 7Ta, since the dopant concentrations after redox cycling are constant within ±2% of the as-synthesized values and the OEC is higher than that of CeO2−δ (cf. Section 3.4 and ESI†). The long-term stability of 10Zr, 10Hf, and 7Ta is subject to ongoing studies. The remaining eight materials, namely 10D (D = Si, Ti, V, Cr, Nb, Rh, Pr, and Tb), were stable at test conditions, except 10Si and 10Rh, as discussed below, but did not surpass the OEC of CeO2−δ. Therefore, these were considered in the following as references for further characterizing 10Zr, 10Hf, and 7Ta (cf. Section 3.2) and to investigate the general influence of the effective ionic radii on the reduction behavior and the Δδ of doped ceria.
10Si and 10Rh both displayed significant and irreversible mass loss during the TGA experiment and were not considered for further evaluation. EDX mapping (Fig. S9†) furthermore showed the formation of metallic rhodium agglomerates. 10Tb and 10Pr also underwent a notable yet reversible mass change in the TGA experiment during the first 150 min. 10Nb, 10Cr, 10Ti, 10Zr, 10Hf, and 7Ta all displayed a higher extent of reduction than pristine ceria (cf. Fig. S1b†). Generally, the observed reduction kinetics are much slower than the corresponding oxidation kinetics. Only 10Zr, 10Hf, and 7Ta exhibited better re-oxidation properties than pure ceria, while the Δδ of 10Nb is comparable to pristine ceria. 10Zr, 10Hf, 10Nb, and 7Ta displayed slower oxidation kinetics than pristine ceria.
The extent and kinetics of the reduction are not only strongly influenced by the reduction temperature,39 but also by the dopant type. Ta-doping, for example, seems to improve both the extent of reduction as well the kinetics. While the onset of oxidation is rather fast for all investigated materials, the effective overall kinetics depend more strongly on the individual dopants.
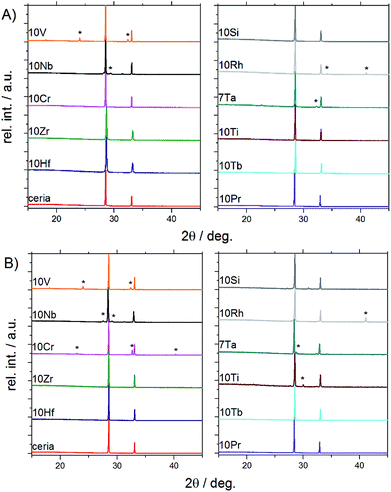 | ||
| Fig. 2 PXRD patterns of doped ceria-based materials before (A) and after (B) redox cycling tracked by TGA (for Rietveld refinements and magnifications into the range from 28° to 29° cf. Fig. S3 and S4†). | ||
Powder X-ray diffraction and Rietveld refinement showed that the following samples were phase pure and isostructural with ceria (fluorite type, S.G. Fm![[3 with combining macron]](https://www.rsc.org/images/entities/char_0033_0304.gif) m) before and after TGA investigations (Fig. 1 and S3†): 10Hf, 10Zr, 10Si, 10Pr, and 10Tb. The presence of amorphous side products in 10Si, however, cannot be excluded in light of its thermal behavior during pre-treatment (cf. Section 3.1.2). 10Ti and 10Cr are phase pure only prior to the redox cycling. After redox cycling, 10Ti and 10Cr exhibit small amounts of perovskite-related side products (i.e., CeCrO3 [PDF 00-075-0289] and layered Ce2Ti2O7 [PDF 00-047-0667], respectively). A second phase prior to redox cycling was evident for 10V, 10Nb, 10Rh, and 7Ta. As-synthesized 10V contained CeVO4 (PDF 00-012-0757; S.G. I41/amd). 10Nb contained Ce3NbO7 (PDF 00-023-0144) before redox cycling, which had turned into scheelite-type CeNbO4 (PDF 00-033-0332) after redox cycling. Furthermore, 10Rh contained Rh (PDF 00-005-0685), in agreement with the EDX mapping (cf. Fig. S9†), and CeTa3O9 (PDF 00-045-1212; S.G. Pnma) was present in 7Ta.
m) before and after TGA investigations (Fig. 1 and S3†): 10Hf, 10Zr, 10Si, 10Pr, and 10Tb. The presence of amorphous side products in 10Si, however, cannot be excluded in light of its thermal behavior during pre-treatment (cf. Section 3.1.2). 10Ti and 10Cr are phase pure only prior to the redox cycling. After redox cycling, 10Ti and 10Cr exhibit small amounts of perovskite-related side products (i.e., CeCrO3 [PDF 00-075-0289] and layered Ce2Ti2O7 [PDF 00-047-0667], respectively). A second phase prior to redox cycling was evident for 10V, 10Nb, 10Rh, and 7Ta. As-synthesized 10V contained CeVO4 (PDF 00-012-0757; S.G. I41/amd). 10Nb contained Ce3NbO7 (PDF 00-023-0144) before redox cycling, which had turned into scheelite-type CeNbO4 (PDF 00-033-0332) after redox cycling. Furthermore, 10Rh contained Rh (PDF 00-005-0685), in agreement with the EDX mapping (cf. Fig. S9†), and CeTa3O9 (PDF 00-045-1212; S.G. Pnma) was present in 7Ta.
Evenly colored EDX mappings indicate a fairly homogeneous elemental distribution for the 10Hf, 10Zr, 10Pr, and 10Tb samples, which is in line with the PXRD results. This is contrasted to some degree by the less homogeneous characteristics of the remaining ceria samples. Occurrence of a second crystal phase after the TGA treatment in 10Cr and 10Ti (cf. above) is clearly confirmed by the respective elemental mappings (Fig. S9†). In contrast to the PXRD pattern shown in Fig. 2, the as-synthesized 10V appears fairly homogeneous, while the post-TGA sample displays large regions with increased vanadium concentrations. As-synthesized 10Nb already displays a rather low homogeneity of the elemental distribution. This is quite different to 10Ti, which displays notably decreased homogeneity only after the redox cycling. However, taking into account the moderate sampling depth of EDX and considering the agglomerate-like appearance of the inhomogeneous areas in 10Ti after redox cycling, it cannot be excluded that these inhomogeneous areas are only surface features. Similarly, the second crystal phase is not very pronounced in 7Ta after the redox cycling (see weak additional peaks in Fig. 2b). 10Si shows distinct areas with increased oxygen concentrations, which could be rationalized with the presence of an amorphous silicon oxide phase that does not appear in the PXRD pattern (cf.Fig. 2). In line with the PXRD measurements, the EDX analysis suggests formation of spherical metallic particles in 10Rh that are clearly visible in the element mappings before and after TGA, going hand in hand with less pronounced grain growth. This rather unique case of dopant agglomeration as a metallic phase has the potential for further applications as an anti-sintering agent to replace the more expensive platinum.23,41,42 Additionally, the present synthetic route may offer a stable ceria matrix for high-temperature applications of metallic rhodium catalysts.43,44
In summary, PXRD and EDX mapping results demonstrate that among the 26 investigated possible dopants only Zr, Hf, Pr, and Tb form phase-pure, homogeneous, and thermally stable ceria-based materials with stable contents of approx. 10% metal cation dopant. 10Si and 7Ta display a low to moderate extent of dopant agglomeration and side product formation, while this effect is more pronounced in 10Cr, 10Rh, 10Ti, 10Nb, and 10V.
3.2. Characterization of ceria before and after CO2 reduction
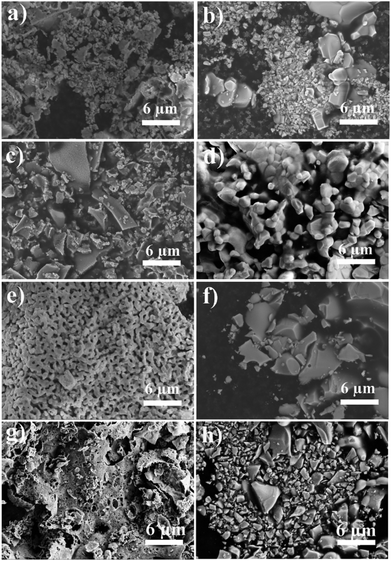
7Ta and 10Rh do not undergo much sintering either, the latter being probably stabilized by metallic Rh particles as discussed above. 10Hf (Fig. 3d), 10Pr (Fig. S6p†), 10Tb (Fig. S6r†), and 10Si (Fig. S6v†) undergo notable sintering only after TGA treatment. Weak sintering compared to pristine ceria after synthesis followed by stronger sintering and grain growth upon TGA investigations was observed for 10Zr (Fig. 3e and f) and 10 Cr (Fig. S6i and j†). The remaining samples were already significantly sintered before TGA and displayed further grain growth and agglomeration, as can be seen for 10Nb (Fig. S6k and l†), 10V (Fig. S6m and n†), and 10Ti (Fig. S6s and t†).
All samples were analyzed with FT-IR spectroscopy for possible residual carboxylate/carbonate species from the citric acid precursor (Fig. S8†) as well as for CO2 adsorption as a frequently encountered side reaction of perovskite materials during solar thermochemical applications.46 No significant indications for carbonate formation were found, and a detailed discussion of the FT-IR spectra can be found in the ESI.†
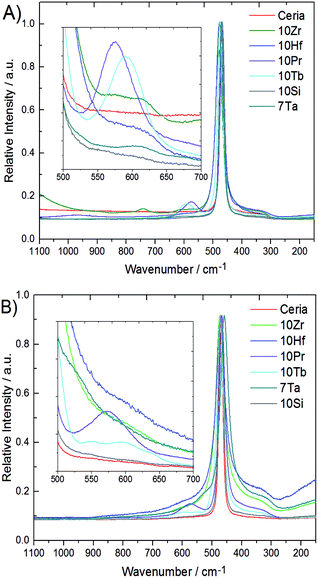
Metal–oxygen bonds and lattice defects in ceria have been characterized in detail by Raman spectroscopy.47–50 In contrast to the 524.5 nm laser used in previous studies,15 spectra were recorded with a 780 nm diode laser to obtain more detailed sub-surface information due to enhanced penetration depth. Raman spectra of all phase pure samples are compared to pristine ceria in Fig. 4. Pristine ceria with idealized cubic geometry displays only a single Raman peak at 464 cm−1 arising from the triply degenerate F2g mode of the fluorite structure.47,47 The shape of the F2g mode depends strongly on the particle size and undergoes broadening together with a shift toward lower wavenumbers with increasing particle size.48,48 This breathing mode of the oxygen atoms around cerium can become asymmetric and give rise to a shoulder around 570 cm−1 through replacement of Ce4+ cations by dopants or vacancies, which can decrease in intensity again with growing crystallite size.50
This shoulder is also described in ref. 47 for Pr-doped ceria, while at the same position for Sm-doped ceria two weaker bands at 546 and 600 cm−1 are described, which arise from another type of stable oxygen vacancies to compensate the charge difference.47 These two bands are also observed in 10Tb after TGA treatment, but not for 10Pr after TGA. Instead, 10Pr after TGA displays a band at 570 cm−1 which points to the replacement of Ce(IV) with dopants and/or oxygen vacancies.47 The generally stronger tendency of praseodymium towards the formation of tetravalent ions might favor the formation of oxygen vacancies which remain in thermodynamic equilibrium with the ceria lattice, while trivalent terbium ions give rise to more stable oxygen vacancies within the ceria matrix. A further band at 305 cm−1 can only be observed in 10Hf, 10Zr, and 7Ta after TGA treatment due to overlap with the broadened F2g mode. This band arises from oxygen atoms which are displaced from their ideal position in the ceria lattice. All three samples (10Hf, 10Zr, and 7Ta) with the highest OEC show also the most distinguished bands at 305 cm−1.48
| Sample | E a/eV | White line/eV | Edge width/eV | Valence |
|---|---|---|---|---|
| Hf L 3 edge | ||||
| 10Hf before TGA | 9558.85 | 9562.19 | 3.34 | 4 |
| 10Hf after TGA | 9558.85 | 9562.17 | 3.32 | 4 |
| Reference Hf(IV)O2 | 9558.68 | 9562.21 | 3.53 | 4 |
![[thin space (1/6-em)]](https://www.rsc.org/images/entities/char_2009.gif) |
||||
| Hf L2 edge | ||||
| 10Hf before TGA | 10![[thin space (1/6-em)]](https://www.rsc.org/images/entities/char_2009.gif) 736.69 736.69 |
10![[thin space (1/6-em)]](https://www.rsc.org/images/entities/char_2009.gif) 739.32 739.32 |
2.63 | 4 |
| 10Hf after TGA | 10![[thin space (1/6-em)]](https://www.rsc.org/images/entities/char_2009.gif) 736.63 736.63 |
10![[thin space (1/6-em)]](https://www.rsc.org/images/entities/char_2009.gif) 739.31 739.31 |
2.68 | 4 |
| Hf(IV)O2 | 10![[thin space (1/6-em)]](https://www.rsc.org/images/entities/char_2009.gif) 736.60 736.60 |
10![[thin space (1/6-em)]](https://www.rsc.org/images/entities/char_2009.gif) 739.18 739.18 |
2.58 | 4 |
![[thin space (1/6-em)]](https://www.rsc.org/images/entities/char_2009.gif) |
||||
| Zr K edge | ||||
| 10Zr before TGA | 18![[thin space (1/6-em)]](https://www.rsc.org/images/entities/char_2009.gif) 013.80 013.80 |
180.23.79 | 9.99 | 4 |
| 10Zr after TGA | 18![[thin space (1/6-em)]](https://www.rsc.org/images/entities/char_2009.gif) 014.13 014.13 |
18![[thin space (1/6-em)]](https://www.rsc.org/images/entities/char_2009.gif) 024.07 024.07 |
9.93 | 4 |
| Zr(IV)O2 | 18![[thin space (1/6-em)]](https://www.rsc.org/images/entities/char_2009.gif) 014.32 014.32 |
18![[thin space (1/6-em)]](https://www.rsc.org/images/entities/char_2009.gif) 022.05 022.05 |
7.72 | 4 |
| Zr(III)N | 18![[thin space (1/6-em)]](https://www.rsc.org/images/entities/char_2009.gif) 005.43 005.43 |
18![[thin space (1/6-em)]](https://www.rsc.org/images/entities/char_2009.gif) 017.79 017.79 |
12.36 | 3 |
![[thin space (1/6-em)]](https://www.rsc.org/images/entities/char_2009.gif) |
||||
| Cr K edge | ||||
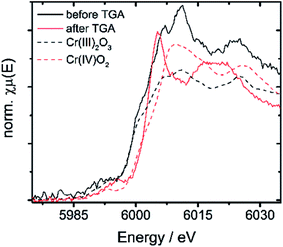
| 10Cr before TGA | 5999.5 | 6007.1 | 7.6 | 3 |
| 10Cr after TGA | 6003.1 | 6005.2 | 2.1 | 4 |
| Cr(III)2O3 | 5999.2 | 6010.2 | 11 | 3 |
| Cr(IV)O2 | 6002.8 | 6009.5 | 6.7 | 4 |
![[thin space (1/6-em)]](https://www.rsc.org/images/entities/char_2009.gif) |
||||
| Ta L3 edge | ||||
| 7Ta before TGA | 9885.0 | 9889.5 | 4.5 | 5 |
| 7Ta after TGA | 9884.4 | 9887.2 | 2.8 | 5 |
| Ta(IV)C | 9882.9 | 9886.5 | 3.6 | 4 |
| Ta(V)2O5 | 9884.7 | 9888.3 | 3.6 | 5 |
XANES K-edge data of 10V show a significant pre-edge peak at 5468 eV (Fig. S10†) which arises from the symmetry forbidden 3d ← 1s transition,53i.e. the vanadium ions do not display a centrosymmetric coordination. Comparison to references indicates the presence of stable vanadium(V) centers before and after TGA. However, the non-centrosymmetric coordination in combination with PXRD patterns (Fig. 2) and EDX mappings (Fig. S9†) indicates that the vanadium dopant ions are not incorporated into the ceria lattice to a large extent.
The niobium K- and tantalum L3-edge XANES spectra of 10Nb and 7Ta do not display a significant shift of the edge position before and after TGA (Fig. S11† and 7). Comparison of the first derivative of these spectra with tetra- and pentavalent references compounds indicates that niobium and tantalum remain pentavalent throughout. This is in line with the absence of unexpected mass changes during TGA (Fig. 1).
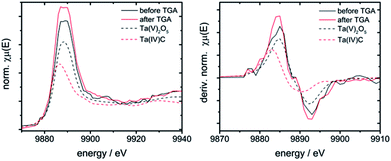 | ||
| Fig. 7 Left: XANES spectra of 7Ta before and after TGA vs. Ta(IV) and Ta(V) containing references; right: first derivative of these spectra. | ||
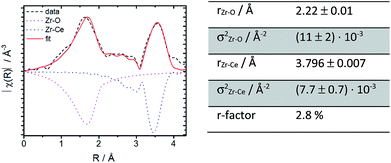
Further structural investigations were conducted for 10Zr and compared with 10Nb. The EXAFS region of 10Zr was fitted against a structural model generated from room temperature crystallographic data for CeO2−δ through substituting a single Ce atom in the elemental cell by zirconium. Lattice parameters and interatomic distances for this model were obtained from Rietveld refinement of experimental PXRD data. Reasonable fitting results with a R value of 2.8% were obtained (Fig. 8).
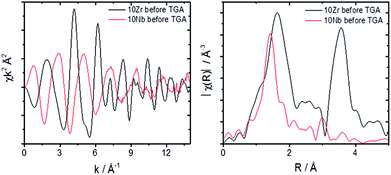
A comparison of the EXAFS region plotted in k-space for 10Zr and 10Nb clearly shows differences in the local coordination of zirconium and niobium, especially the absence of a peak at 3.5 Å in the Fourier transform magnitude of 10Nb (Fig. 9).
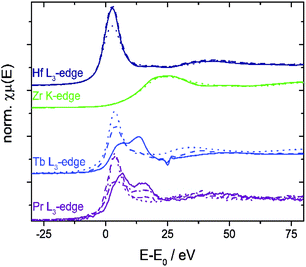
The valence state of cerium in selected samples before and after TGA was determined from L3-edge XANES spectra applying a linear combination fit (LCF) with reference spectra of cerium(III) oxalate, Ce(C2O4)3, and cerium(IV) sulfate, Ce(SO4)2. The normalized absorption and the first derivatives were reconstructed with these LCFs (see Fig. 10 as a representative example). The results are summarized in Fig. 11.
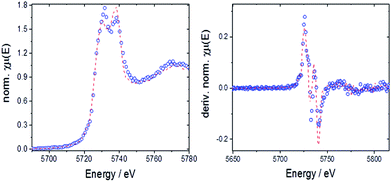 | ||
| Fig. 10 Left: LCF for 10Hf before TGA with normalized absorption (open circles: experimental data, dashed line: fit); right: LCF for derivative of the normalized absorption. | ||
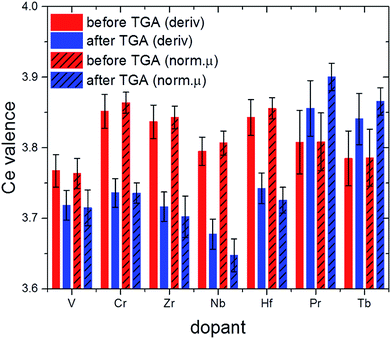 | ||
| Fig. 11 Effective valence of Ce in selected samples after calcination (red) and after 2.5 TGA cycles (blue; cf. also Fig. 1). | ||
Comparison of the XANES-derived ceria valences with the corresponding lattice constants derived from Rietveld refinement data for before TGA and after about three cycles (Fig. S3† and Table 1) sheds more light on the influence of ionic radii on the thermochemical performance. In the first place, decreasing oxidation states of the ceria ions are expected to result in larger lattice constants on the basis of simple ionic radii differences between Ce(III) and Ce(IV) (cf. values in Table 1).
This is the case for 10Zr where no dopant valence changes occur after TGA. Likewise, 10Hf shows first a decrease in lattice constants due to the incorporation of the smaller Hf(IV) cation (Fig. 10), but a larger lattice constant after TGA, probably due to the higher Ce(III) content. 10Nb also remains pentavalent, so that the observed increased lattice constants are likely due to the higher Ce(III) contents after TGA.
Under the assumption that a certain amount of chromium ions might still be incorporated into the ceria lattice, the absence of a significant lattice constant change in pre-/post-TGA 10Cr could be explained through opposite radii trends for ceria and chromium ions, which are canceling each other out, namely the contraction upon oxidation of Cr(III) to Cr(IV) vs. the formation of larger Ce(III) from Ce(IV). The same applies for 10Pr and 10Tb, where a tendency towards higher Ce(IV) contents after TGA goes hand in hand with the formation of larger Ln(III) ions. The influence of this redox process on the ceria performance is discussed in more detail below. However, other factors beyond mere ionic radii may also influence the observed lattice constant trends.
3.3. Ceria performance and stability versus dopant cationic radii
10Nb, 10Rh, and 7Ta display smaller amounts of a second phase before and after TGA in the PXRD patterns (Fig. 2), while 10V displays higher contents of a side product. XANES measurements show that Nb(V) and V(V) retain their oxidation states and effective radii of 0.74 Å and 0.54 Å, respectively. This suggests that ionic radii above 0.74 Å are favorable for the formation of phase pure solid solutions with ceria, while the preference for 4- or 6-fold coordinations among the smaller dopants favors the formation of more stable side products.26
10Pr and 10Tb show complete solubility of the dopants in the ceria lattice even though their oxidation states change after TGA from +IV to +III, going hand in hand with an increase of their effective ionic radii from 0.96 Å (Pr4+) and 0.88 Å (Tb4+) to 0.99 Å (Pr3+) and 1.04 Å (Tb3+), respectively. The smaller effective radii of the dopants in phase pure 10Hf and 10Zr (0.83 Å for Hf4+ and 0.84 Å for Zr4+) narrow down the suitable radius range for dopant solubility to 0.74–0.84 Å. These results are well in line with calculated solubility trends.26
Some previous studies on doped ceria indicate that sintering, as tracked by SEM images, is not always correlated with changes in the according BET values.15 Here, crystallite sizes derived from the Scherrer equation before and after TGA (Fig. S5†), were neither clearly correlated with the sintering effects evident from SEM images nor with the TGA oxidation kinetics. This suggests that the redox steps occur to a large extent in the ceria bulk. Preceding works indeed indicated that the amount of Ce3+ is rather stable and constant at temperatures above 700 °C with little influence of pO2 and temperature.54 While the majority of Ce3+ cations are located at the surface at temperatures below 700 °C, their concentration in bulk and surface is almost equal around 1000 °C. Therefore, charge transfer processes were reported as the rate limiting step for the redox reactions.39
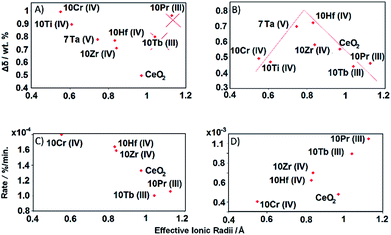
The deviation of 10Pr and 10Tb from the remaining doped ceria samples in the depiction of the initial reduction cycle (Fig. 12a) is clearly due to their reduction from Ln(IV) to Ln(III) (cf. TGA cycles displayed in Fig. S1†). The significant mass loss during the initial 50 min is most likely due to this lanthanide reduction step, while the subsequent mass increase during the pre-treatment step (50 to 150 min) indicates a re-oxidation from Ln(III) to Ln(IV) through the applied carrier gas mixture for the follow-up step (Ar with 20% O2). The subsequent reduction step of the first TGA cycle was carried out in pure Ar, initiating another mass loss accompanying the reduction of Ln(IV) to Ln(III) around 900 °C, as observed during the pre-treatment. Given that these dopant redox processes interfere with the first TGA cycle, 10Pr and 10Tb are not to be considered for the trends derived from Fig. 12a. The extent of reduction during the first TGA cycle for the other samples increases with decreasing ionic radius of the respective dopant. Up to date, this correlation has only been put forward in few studies: one of these works was mainly based on TGA cycling experiments and another study on DFT calculations.14,26
A straightforward electrostatic explanation for the productive effect of smaller dopants can be given in terms of reduced lattice strains. The increasing amounts of larger Ce3+ ions formed during the reduction step exert strain forces, which can be compensated through the presence of dopants with smaller ionic radii, thereby facilitating further oxygen release (eqn (1)).18 However, if the effective dopant radius is below a certain value, reoxidation can be hindered, i.e. the equilibrium is shifted towards the reduced products. This is evident from the second TGA cycle of 10Cr (Fig. 12b and c), which exceeds 10Hf and 10Zr with respect to reduction during the first cycle but does not undergo complete reoxidation after the first two cycles. The plot of reduction extents vs. effective dopant radii during the second TGA cycle provides further guidelines for the optimum dopant radius which facilities the reduction with respect to pure ceria without inhibiting the re-oxidation.55Fig. 12b indicates that this ideal effective dopant radius is around 0.8 Å, i.e. close to Hf4+ in 8-fold coordination.
Kinetic trends for reduction and oxidation of doped ceria materials as a function of the effective dopant radii are displayed in Fig. 12c and d. Here, both processes rather tend towards a linear dependence on the dopants than to a volcano-like plot as observed for the extent of reduction (Fig. 12b).
3.4. Oxygen exchange capacity versus charge distribution
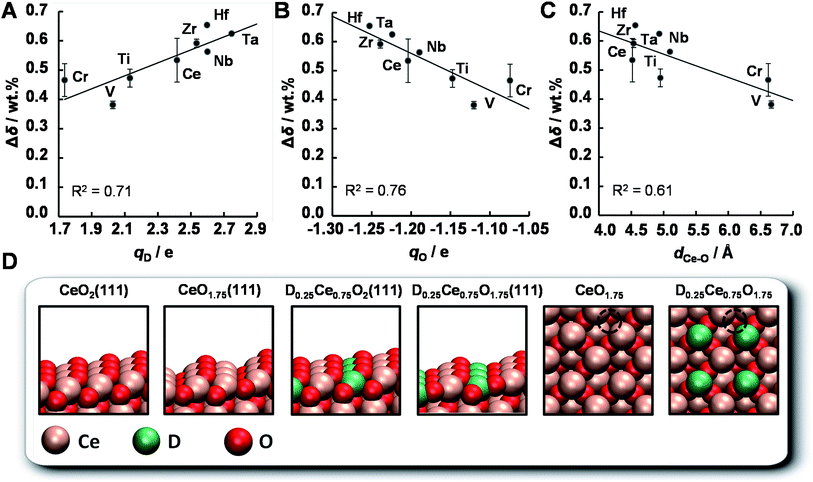
The OEC of a redox material is one of the most central quantities determining the performance of a solar thermochemical fuel synthesis process. Favorably high values correlate directly with relatively high fuel concentrations and relatively low heat losses from heating and cooling of solids, and, in turn, relatively high solar-to-fuel energy conversion efficiencies and thereby lower capital investment costs for solar concentrators required to produce a specific amount of solar fuel per day. To understand the origin of the trends in the OEC of doped ceria redox materials, this section employs DFT to model the mixed-terminated (111) facet of D0.25Ce0.75O2−δ (D = Ce, Ti, V, Cr, Zr, Nb, Mo, Hf, and Ta), with δ = 0 for oxidized surfaces and δ = 0.25 for reduced surfaces. We note, this approach does not account for the variable solubility limits of metal cations in the bulk or at the surface, crystal phase changes in the presence of the dopant, or the dependence of the surface phase diagram on pO2, pCO2, the total pressure, and temperature.36,56 Since this is beyond the scope of this work, we refrain from estimating thermochemical and kinetic quantities, such as reaction enthalpies and reaction rates. As we expect the first layer of the surface to exhibit the most significant changes in the electronic structure due to metal doping and coordination, this approach is solely employed to compute relative changes in the atomic coordination, and the partial charge density was determined for all metal oxide models via Bader decomposition.57 This utility of the ceria surface models is supported by the agreement between the computed and experimentally established trends, discussed in the following.The OEC quantifies the trade-off of energy required for breaking bonds between metal cations and lattice oxygen to form O2 and energy liberated when forming these bonds to reduce CO2 into CO. Fig. 13 shows the experimentally measured OEC, Δδ, versus the theoretically calculated partial electronic charge (in units of the elementary charge, e) of (A) the metal cation dopant at the oxidized surface, qD, (B) the oxygen anion at the oxidized surface, qO, and (C) the shortest bonding length between the Ce cations and the O anions that form oxygen vacancies at the oxidized surface, dCe–O. Fig. 13d shows the employed DFT models schematically. We note, Δδ was calculated as the difference between the maximum and minimum mass of the materials with D0.1Ce0.9O2−δ composition, reduced at 1500 °C in 1 bar Ar and oxidized at 1000 °C in 0.5 bar CO2 in Ar. Furthermore, dCe–O was calculated as dCe–O = (dx2 + dy2 + dz2)1/2, with dx, dy, and dz being the specific spatial contributions of the distance between the nuclei of the Ce cations and the O anions that form oxygen vacancies at the D0.25Ce0.75O2(111) surfaces.
We find that the OEC of ceria doped with Zr, Nb, Hf, and Ta is higher than that of the pure CeO2−δ reference. This is in line with the above experimental results. While this beneficial effect of doping with Zr and Hf on the OEC of ceria is furthermore in agreement with previous reports,15 the benefit when doping with Nb and Ta deserves further studies. As a general trend, the OEC increases with increasing net-positive charge accumulated at the metal dopant (Fig. 13a) and increasing net-negative charge accumulated at the oxygen anions (Fig. 13b). We find that larger charge separation leads to a larger OEC. This trend can be understood from the dependence of the enthalpy change of reduction on the oxygen nonstoichiometry,58 suggesting oxide oxidation-limited thermochemistry at these conditions. For undoped ceria oxidized at 1000 °C in 0.5 bar CO2 and reduced at 1500 °C in 1 bar Ar we find Δδ = 0.53 wt%, i.e., Δδ = 0.028. This is in accord with typically implemented Δδ = 0.03,59,60 and correlates with a partial molar enthalpy change of reduction of about 450 kJ mol−1.58 Utilizing the previously established design principle of balanced redox energetics,35,61 we find nonstoichiometric ceria exhibits a nearly ideal energetic trade-off. This can be seen from the limiting free energy change of the redox cycle, which is due to the oxide oxidation, approaching the minimum value at these high-temperature conditions. This, in turn, suggests minor changes in the enthalpy change of reduction may determine whether the fuel synthesis thermodynamics are limited by endothermic O2 evolution or exothermic fuel production. In principle, the enthalpy change of reduction of nonstoichiometric ceria can be controlled by process parameters, such as 425–475 kJ mol−1via the reduction temperature and/or pO2 to establish Δδ in the range of 0.014 to 0.056, or materials properties, such as 380–400 kJ mol−1via metal doping to establish Δδ = 0.03 with CeO2−δ doped with 5 mol% Zr4+.58 Screening, on the other hand, for trends in the OEC with geometric factors of the electronic structure of these metal oxides, we find a weak correlation with the shortest bonding length between the Ce cations and the O anions that form oxygen vacancies at the oxidized surface (Fig. 13c). An apparent trend of the OEC decreasing with increasing dCe–O is suggested only due to the slightly lower OEC for Cr- and V-doped materials, relative to the OEC of all other investigated materials. Thus, we conclude, the extent of the net-oxygen exchange that can be established at thermodynamic equilibrium with the investigated CeO2−δ materials doped with metal cations is dominated by the amount of electronic charge that is donated by the metal cations to the oxygen anions, provided that the cations remain stably incorporated under operational conditions.
4. Conclusions
Comprehensive screening of 26 eligible dopants capable of forming tetravalent cations revealed clear empirical trends for optimizing the oxygen exchange capacity, Δδ, of ceria. Of all investigated dopants, only Hf, Zr, Pr, and Tb formed thermally stable and homogeneous doped ceria materials with approx. 10% dopant content. Ceria samples doped with Hf, Zr, Ta, and Nb all displayed comparable or higher Δδ values than pristine ceria during TGA screening. Further cycling experiments and PXRD investigations identified Hf, Zr, and Ta as the most promising candidates for the optimization of commercial ceria materials in solar reactors. The majority of doped ceria materials synthesized in the present study were checked for carbonate formation with various spectroscopic techniques, and no side products were found. Raman spectroscopy investigations showed that the higher performance of Hf-, Zr- and Ta-doped ceria went hand in hand with more versatility in the underlying oxygen vacancy formation processes. X-ray absorption spectroscopy was performed on Hf-, Zr-, Ta-, Nb-, Cr-, V-, Pr-, and Tb-doped ceria before and after CO2 reduction to determine the effective dopant valences. The emerging correlation between the effective dopant radii and the observed OEC provides a sound empirical foundation for the selection of efficient ceria dopants based on straightforward electrostatic criteria. The present data set points to an optimal dopant radius around 0.8 Å for maximum Δδ. Given that none of the available dopants precisely matches with this ideal value, combinations of two dopants with an average radius of 0.8 Å are now being screened. As the averaged conductivity of doped ceria can be improved with related strategies beyond average properties without significant co-doping effects,62 this perspective is likely to succeed. Furthermore, the empirical doping trends were corroborated with DFT calculations pointing into the same direction. In summary, the present combined approach provides clear guidelines for the optimization of ceria materials suitable for the solar redox thermochemical cycle.Conflicts of interest
There are no conflicts to declare.Acknowledgements
This work was supported financially by the Swiss National Science Foundation (Grant No. 200021_162435), the University Research Priority Program (URPP) for Solar Light to Chemical Energy Conversion (LightChEC), and the European Research Council under the European Union's ERC Advanced Grant (SUNFUELS, No. 320541). Electronic structure calculations were conducted at the High-Performance Computation cluster of ETH Zurich. We thank Hermann Emerich (ESRF Grenoble), Dr Nicolo Azzaroli, and Dr Grigory Smolentsev (SLS, Villigen) for beamline support.References
- J. R. Scheffe and A. Steinfeld, Mater. Today, 2014, 17, 341–348 CrossRef CAS.
- M. Romero and A. Steinfeld, Energy Environ. Sci., 2012, 5, 9234–9245 CAS.
- A. H. McDaniel, E. C. Miller, D. Ari, A. Ambrosini, E. N. Coker, R. O'Hayre, W. C. Chueh and T. Jianhua, Energy Environ. Sci., 2013, 6, 2424–2428 CAS.
- A. Demont, S. Abanades and E. Beche, J. Phys. Chem. C, 2015, 118, 12682–12692 Search PubMed.
- S. Dey, B. S. Naidu, A. Govindaraj and C. N. R. Rao, Phys. Chem. Chem. Phys., 2015, 17, 122–125 RSC.
- A. H. McDaniel, A. Ambrosini, E. N. Coker, J. E. Miller, W. C. Chueh, R. O'Hayre and J. Tong, Energy Procedia, 2014, 49, 2009–2018 CrossRef CAS.
- S. M. Babiniec, E. N. Coker, A. Ambrosini and J. E. Miller, SolarPACES, 2015, p. 050006 Search PubMed.
- J. N. Kuhn and U. S. Ozkan, Catal. Lett., 2008, 121, 179–188 CrossRef CAS.
- J. R. Scheffe, J. Li and A. W. Weimer, Int. J. Hydrogen Energy, 2010, 35, 3333–3340 CrossRef CAS.
- C. L. Muhich, B. W. Evanko, K. C. Weston, P. Lichty, X. Liang, J. Martinek, C. B. Musgrave and A. W. Weimer, Science, 2013, 341, 540–542 CrossRef CAS PubMed.
- T. Block and M. Schmücker, Sol. Energy, 2016, 126, 195–207 CrossRef CAS.
- S. Abanades and G. Flamant, Sol. Energy, 2006, 80, 1611–1623 CrossRef CAS.
- W. C. Chueh, C. Falter, M. Abbott, D. Scipio, P. Furler, S. M. Haile and A. Steinfeld, Science, 2010, 330, 1797–1801 CrossRef CAS PubMed.
- Q.-L. Meng, C.-I. Lee, T. Ishihara, H. Kaneko and Y. Tamaura, Int. J. Hydrogen Energy, 2011, 36, 13435–13441 CrossRef CAS.
- J. Scheffe, R. Jacot, G. R. Patzke and A. Steinfeld, J. Phys. Chem. C, 2013, 177, 24104–24114 Search PubMed.
- W. C. Chueh and S. M. Haile, ChemSusChem, 2009, 2, 735–739 CrossRef CAS PubMed.
- F. Call, M. Roeb, M. Schmücker, C. Sattler and R. Pitz-Paal, J. Phys. Chem. C, 2015, 119, 6929–6938 CAS.
- H. Kaneko, S. Taku and Y. Tamaura, Sol. Energy, 2011, 85, 2321–2330 CrossRef CAS.
- C. Muhich and A. Steinfeld, J. Mater. Chem. A, 2017, 5, 15578–15590 CAS.
- D. A. Andersson, S. I. Simak, N. V. Skorodumova, I. A. Abrikosov and B. Johansson, Proc. Natl. Acad. Sci. U. S. A., 2006, 103, 3518–3521 CrossRef CAS PubMed.
- M. Mogensen, N. M. Sammes and G. A. Tompset, Solid State Ionics, 2000, 129, 63–94 CrossRef CAS.
- W. C. Chueh and S. M. Haile, Philos. Trans. R. Soc., A, 2010, 368, 3269–3294 CrossRef CAS PubMed.
- A. Morikawa, T. Suzuki, T. Kanazawa, K. Kikuta, A. Suda and H. Shinjo, Appl. Catal., B, 2008, 78, 210–221 CrossRef CAS.
- A. Le Gal and S. Abanades, J. Phys. Chem. C, 2012, 116, 13516–13523 CAS.
- B. M. Reddy and A. Khan, Catal. Surv. Asia, 2005, 9, 155–171 CrossRef CAS.
- D. A. Andersson, S. I. Simak, N. V. Skorodumova, I. A. Abrikosov and B. Johansson, Phys. Rev. B: Condens. Matter Mater. Phys., 2007, 76, 174119 CrossRef.
- D. Marxer, P. Furler, J. Scheffe, H. Geerlings, C. Falter, V. Batteiger, A. Sizmann and A. Steinfeld, Energy Fuels, 2015, 29, 3241–3250 CrossRef CAS.
- R. J. Panlener, R. N. Blumenthal and J. E. Garnier, J. Phys. Chem. Solids, 1975, 36, 1213–1222 CrossRef CAS.
- B. Ravel and M. Newville, J. Synchrotron Radiat., 2005, 12, 537–541 CrossRef CAS PubMed.
- J. J. Mortensen, L. B. Hansen and K. W. Jacobsen, Phys. Rev. B: Condens. Matter Mater. Phys., 2005, 71, 035109 CrossRef.
- J. Enkovaara, C. Rostgaard, J. J. Mortensen, J. Chen, M. Dułak, L. Ferrighi, J. Gavnholt, C. Glinsvad, V. Haikola, H. A. Hansen, H. H. Kristoffersen, M. Kuisma, A. H. Larsen, L. Lehtovaara, M. Ljungberg, O. Lopez-Acevedo, P. G. Moses, J. Ojanen, T. Olsen, V. Petzold, N. A. Romero, J. Stausholm-Møller, M. Strange, G. A. Tritsaris, M. Vanin, M. Walter, B. Hammer, H. Häkkinen, G. K. H. Madsen, R. M. Nieminen, J. Nørskov, M. Puska, T. T. Rantala, J. Schiøtz, K. S. Thygesen and K. W. Jacobsen, J. Phys.: Condens. Matter, 2010, 22, 253202 CrossRef CAS PubMed.
- S. Bahn and L. W. Jacobsen, Comput. Sci. Eng., 2002, 4, 56–66 CrossRef CAS.
- Both ASE and GPAW are open-source code available from the Department of Physics at the Technical University of Denmark and are https://wiki.fysik.dtu.dk/ase/ and https://wiki.fysik.dtu.dk/gpaw/.
- B. Hammer, L. B. Hansen and J. K. Nørskov, Phys. Rev. B: Condens. Matter Mater. Phys., 1999, 59, 7413–7421 CrossRef.
- R. Michalsky, V. Botu, C. M. Hargus, A. A. Peterson and A. Steinfeld, Adv. Energy Mater., 2015, 5, 1401082 CrossRef PubMed.
- V. Botu, R. Ramprasad and A. B. Mhadeshwar, Surf. Sci., 2014, 619, 49–58 CrossRef CAS.
- M. D. Krcha, A. D. Mayernick and M. J. Janik, J. Catal., 2012, 293, 103–115 CrossRef CAS.
- D. J. M. Bevan and J. Kordis, J. Inorg. Nucl. Chem., 1964, 26, 1509–1523 CrossRef CAS.
- Z. Zhao, M. Uddi, N. Tsvetkov, B. Yildiz and A. Ghoniem, J. Phys. Chem. C, 2016, 120, 16271–16289 CAS.
- R. D. Shannon and C. T. Prewitt, Acta Crystallogr., Sect. B: Struct. Crystallogr. Cryst. Chem., 1969, 25, 925–946 CrossRef CAS.
- Y. A. Daza and J. N. Kuhn, RSC Adv., 2016, 6, 49675–49691 RSC.
- W. Huang, J. N. Kuhn, C.-K. Tsung, Y. Zhang, S. E. Habas, P. Yang and G. A. Somorjai, Nano Lett., 2008, 8, 2027–2034 CrossRef CAS PubMed.
- T. Bunluesin, R. J. Gorte and G. W. Graham, Appl. Catal., B, 1998, 15, 107–114 CrossRef CAS.
- B. Harrison, A. F. Diwell and C. Hallett, Platinum Met. Rev., 1988, 32, 73–83 CAS.
- G. Rao and H. Sahu, Proc. - Indian Acad. Sci., Chem. Sci., 2001, 113, 651–658 CrossRef CAS.
- M. E. Galvez, R. Jacot, J. Scheffe, T. Cooper, G. R. Patzke and A. Steinfeld, Phys. Chem. Chem. Phys., 2015, 17, 6629–6634 RSC.
- M. Guo, J. Lu, Y. Wu, Y. Wang and M. Luo, Langmuir, 2011, 27, 3872–3877 CrossRef CAS PubMed.
- B. M. Reddy, G. K. Reddy, L. H. Reddy and I. Ganesh, Open Phys. Chem. J., 2009, 3, 24–29 CrossRef CAS.
- X. M. Lin, L. P. Li, G. S. Li and W. H. Su, Mater. Chem. Phys., 2001, 69, 236–240 CrossRef CAS.
- H. Liang, J. M. Raitano, G. He, A. J. Akey, I. P. Herman, L. Zhang and S.-W. Chan, J. Mater. Sci., 2012, 47, 299–307 CrossRef CAS.
- R. C. Karnatak, J. Alloys Compd., 1993, 192, 62–68 CrossRef.
- P. Singh, M. S. Hegde and J. Gopalakrishnan, Chem. Mater., 2008, 20, 7268–7273 CrossRef CAS.
- J. Wong, F. W. Lytle, R. P. Messmer and D. H. Maylotte, Phys. Rev. B: Condens. Matter Mater. Phys., 1984, 30, 5596–5610 CrossRef CAS.
- W. C. Chueh, A. H. McDaniel, M. E. Grass, Y. Hao, N. Jabeen, Z. Liu, S. M. Haile, K. F. McCarty, H. Bluhm and F. El Gabaly, Chem. Mater., 2012, 24, 1876–1882 CrossRef CAS.
- M. Burbano, S. Nadin, D. Marrocchelli, M. Salanne and G. W. Watson, Phys. Chem. Chem. Phys., 2014, 16, 8320–8331 RSC.
- E. Tani, M. Yoshimura and S. Somiya, J. Am. Ceram. Soc., 1983, 66, 506–510 CrossRef.
- G. Henkelman, A. Arnaldsson and H. Jónsson, Comput. Mater. Sci., 2006, 36, 354–360 CrossRef.
- M. Takacs, J. R. Scheffe and A. Steinfeld, Phys. Chem. Chem. Phys., 2015, 17, 7813–7822 RSC.
- Y. Hao, C.-K. Yanga and S. M. Haile, Phys. Chem. Chem. Phys., 2013, 15, 17084–17092 RSC.
- D. Marxer, P. Furler, M. Takacs and A. Steinfeld, Energy Environ. Sci., 2017, 10, 1142–1149 CAS.
- M. Ezbiri, M. Takacs, B. Stolz, J. Lungthok, A. Steinfeld and R. Michalsky, J. Mater. Chem. A, 2017, 5, 15105–15115 CAS.
- P. P. Sahoo, J. L. Payne, M. Li, J. B. Claridge and M. J. Rosseinsky, J. Phys. Chem. Solids, 2015, 76, 82–87 CrossRef CAS.
Footnote |
| † Electronic supplementary information (ESI) available: Analytical characterization of doped ceria samples (ICP-MS, Rietveld refinements, SEM-EDX mappings, UV/Vis- and FT-IR data, XAS spectroscopy). See DOI: 10.1039/c7ta04063f |
| This journal is © The Royal Society of Chemistry 2017 |

