 Open Access Article
Creative Commons Attribution 3.0 Unported Licence
Diaminotetrazine based mesoporous C3N6 with a well-ordered 3D cubic structure and its excellent photocatalytic performance for hydrogen evolution†
Siddulu Naidu
Talapaneni
*a,
Gurudas P.
Mane
ac,
Dae-Hwan
Park
a,
Kripal S.
Lakhi
 a,
Kavitha
Ramadass
a,
Stalin
Joseph
a,
Kavitha
Ramadass
a,
Stalin
Joseph
 a,
William M.
Skinner
a,
Ugo
Ravon
b,
Khalid
Al-Bahily
b and
Ajayan
Vinu
a,
William M.
Skinner
a,
Ugo
Ravon
b,
Khalid
Al-Bahily
b and
Ajayan
Vinu
 *a
*a
aFuture Industries Institute (FII), Division of Information Technology, Engineering and Environment (DivITEE), Mawson Lakes Campus, University of South Australia, Adelaide, SA 5095, Australia. E-mail: Siddulu.Talapaneni@unisa.edu.au; Ajayan.Vinu@unisa.edu.au; Fax: +61-8-830-25639; Tel: +61-8-830-25384
bSABIC Corporate Research and Development Center at KAUST, Saudi Basic Industries Corporation, Thuwal 23955, Saudi Arabia
cBhabha Atomic Research Centre, Trombay, 400085, Mumbai, India
First published on 27th July 2017
Abstract
Novel nitrogen enriched diamino-s-tetrazine based highly ordered 3D mesoporous carbon nitride (MCN-9) hybrid materials with a body centered cubic Ia3d structure having high specific surface areas, large pore volumes, and tunable pore diameters were prepared by employing 3D body centered cubic KIT-6 mesoporous silica having a gyroidal porous structure and various pore diameters as the sacrificial hard template through a simple self-condensation followed by polymerization reaction of aminoguanidine hydrochloride inside the nanochannels of the KIT-6 template. Characterization results reveal that the prepared materials exhibit a 3D porous structure with well-defined mesopores and possess excellent physical parameters including high surface areas (157–346 m2 g−1), large pore volumes (0.36–0.63 cm3 g−1), different pore diameters (5.5–6.0 nm) and a high N/C ratio of 1.87, which is much higher than that of ideal C3N4 (1.33). The deep yellow colored MCN-9 with a 3D porous structure also shows good absorption properties with a tunable narrow bandgap of 2.25–2.5 eV, which is again much lower than that of C3N4 (2.7 eV) and helps to achieve much higher photocatalytic water splitting activity than non-porous C3N4 and other carbon nitrides under visible light irradiation.
1. Introduction
Hydrogen is an eco-friendly, clean, sustainable and alternative fuel that can be produced from various renewable and non-renewable sources including natural gas, solar, water, wind and biomass. Among these sources, water splitting assisted by an electrocatalytic or photocatalytic approach for the generation of hydrogen holds great potential as a clean and sustainable source of energy for future generations and further offers near-zero greenhouse gas emissions and helps to solve energy related issues as it uses renewable solar energy in an efficient manner.1,2 Therefore, extensive research studies have been carried out by several research groups on photocatalytic water splitting for sustainable hydrogen generation. One of the important requirements for photocatalytic water splitting is semiconducting photocatalytic materials that should have a suitable band structure in which the conduction band edge is separated from the valence band edge with a minimum band gap of 1.23 eV.To date, various metal based semiconductors have been explored for effective and efficient photocatalytic water splitting; most of them are metal oxides,3 metal (oxy) sulfides4 and metal (oxy) nitrides5 which are often based on metal cations with d0 and d10 electronic configurations. However, highly efficient materials with an appropriate bandgap and adequate stability for water splitting under visible light irradiation have not been found so far and the design and development of such materials is one of the noble missions of researchers working in the field of materials science.6 Recently, carbon nitride based semiconductors have received much attention in the development of metal free photocatalysts because of their unique band structure with a visible light response and easy synthesis process. Among the carbon nitride materials, semiconducting melon based polymeric carbon nitride, i.e., C3N4, is a well-known and fascinating material, which is essentially composed of covalently bonded C and N and shows promising performance as a metal-free polymeric photocatalyst for water splitting towards hydrogen production under visible light irradiation.7 However, the lack of porosity in these materials limits their performance in various applications. Mesoporosity in carbon nitrides was first realized by Vinu and his co-workers who discovered the world's first mesoporous carbon nitride (MCN-1) with ordered pores and excellent textural parameters through a simple polymerization reaction between carbon tetrachloride and ethylenediamine by using SBA-15 as a sacrificial hard template.8 Their superior performance has also been demonstrated in various applications including heterogeneous catalysis, fuel cells, adsorption and separation of bulky molecules, CO2 capture, and energy storage.9 Realizing the importance of mesoporosity in C3N4 materials, Antonietti and co-workers have put significant efforts into fabricating C3N4 nanostructures with an ordered mesoporous graphitic network (ompg-C3N4) and a specific surface area between 86 and 436 m2 g−1 prepared by carbonization of cyanamide or dicyandiamide using 2D silica templates and improved their performance towards photocatalytic hydrogen evolution from water molecules.10 Although ompg-C3N4 samples feature excellent physical properties and also high nitrogen content, the major disadvantage associated with this process lies in the precursor used, cyanamide, which is not only expensive but also highly explosive and toxic in nature,11 thus restricting its use in large scale production of ompg-C3N4 materials.
In the continued search for more effective and practical applications of CN materials, various nitrogen precursors such as guanidine, urea, thiourea, cyanate and thiocyanate have been thermally converted into the polymeric g-C3N4 material.12–15 It was found that the change of nitrogen precursors significantly alters the optical and electronic properties of these materials. Recently, Vinu et al. have reported diamino-s-tetrazine based nitrogen enriched mesoporous carbon nitride (MCN-4) with a 1D structure through the self-condensation of aminoguanidine hydrochloride followed by a polymerization reaction inside the mesoporous channels of a hexagonal SBA-15 template. The obtained material has a well ordered mesoporous structure with tunable pore diameters and band gaps, and a high nitrogen content (C3N6), and registered excellent catalytic activity towards Friedel–Crafts hexanoylation of benzene to yield benzophenone.16 However, the 1D porous structure in MCN offers only a low specific surface area and pore volume which limits their potential use in different applications. It is expected that MCN with a 3D porous structure can offer much better textural parameters than that with the 1D structure, which provides a higher number of active sites and offers more resistance to pore blocking. These features offer better mass transfer of reactant molecules in the pore channels and provide easy and direct access for guest species.17–20
Considering the advantages of 3D mesoporosity in CN materials, herein we demonstrate for the first time the preparation of a novel and highly ordered diamino-s-tetrazine based mesoporous carbon nitride (MCN-9) with a 3D body centered cubic porous structure and tunable textural parameters such as specific surface area, specific pore volume and pore diameters through the self-condensation followed by polymerization of nitrogen rich single molecular precursor aminoguanidine hydrochloride (NH2NHCNHNH2·HCl) by using 3D mesoporous KIT-6 with tunable pore diameters as a sacrificial hard template. We also report that the pore diameter, the pore volume and the specific surface area of the MCN-9 increase with increasing the pore diameter of the KIT-6 template. The prepared samples are deep yellow in color and exhibit very good light absorption properties with a band gap of 2.25–2.49 eV, which is lower than the melon based graphitic C3N4 band gap of 2.7 eV, suggesting that MCN-9 absorbs light over a wider range of wavelengths than the graphitic C3N4 material. The photocatalytic activity of MCN-9 has been evaluated by photochemical reduction of water in the presence of an electron donor with visible light (λ > 420 nm). It has been found that MCN-9 registered superior activity towards H2 evolution over nonporous CN materials, 2D mesoporous MCN and other carbon nitrides under visible light irradiation.
2. Experimental
2.1 Materials
Tetraethyl orthosilicate (TEOS, 98%), triblock copolymer poly(ethylene glycol)-block-poly(propylene glycol)-block-poly(ethylene glycol) (Pluronic P123, molecular weight 5800 g mol−1, EO20PO70EO20, 30 wt%), aminoguanidine hydrochloride (97%), concentrated hydrochloric acid (Conc HCl, 36%), triethanolamine (≥99.0%), chloroplatinic acid hexahydrate (H2PtCl6·6H2O, ≥37.50% Pt basis), ethanol (99.8%) and hydrogen fluoride (HF, 35%) were obtained from Sigma Aldrich. Double distilled water was used throughout the synthesis. All the chemicals were used without further purification.2.2 Preparation of mesoporous 3D KIT-6 silica templates with different pore diameters
Preparation of mesoporous 3D KIT-6 silica templates with different pore diameters: KIT-6 silica templates with different pore diameters were synthesized by using a P123 and n-butanol mixture as the structure directing agent at different synthesis temperatures. In a typical synthesis, 4.0 g of the amphiphilic triblock copolymer was dispersed in water (144 g) and HCl solution (7.9 g) and stirred for 4 h. After that, 4.0 g of 1-butanol and TEOS (8.6 g) were added at once to the above homogeneous solution under stirring and stirring was continued at 35 °C for 24 h. Subsequently, the reaction mixture was aged at 100 °C for 24 h under static conditions. The white solid product was filtered without washing under hot conditions and dried at 100 °C for 24 h in an air oven. Finally, the product was calcined at 540 °C in air to remove the template. KIT-6 silica template materials with different pore diameters were synthesized at the synthesis temperatures of 100, 130 and 150 °C. The samples were labeled KIT-6-X where X denotes the synthesis temperature.2.3 Synthesis of diamino-s-tetrazine based bulk non-porous C3N6 and MCN-9 materials with a 3D mesostructure and different pore diameters
MCN-9 materials with a 3D body centered cubic porous structure and various textural parameters were prepared by using 3D mesoporous silica KIT-6-X with different pore diameters as templates. In a typical synthesis, aminoguanidine hydrochloride (4.0 g) dissolved in water (3.0 g) was added to the calcined KIT-6 (1.0 g). The resultant gel was heated at 100 °C for 6.0 h and further heated at 160 °C for another 6.0 h in a programmed oven. A set of three samples were prepared using KIT-6 materials with various pore diameters, which were synthesized at 100, 130 and 150 °C temperatures, and the samples were labeled MCN-9-X, where X indicates the synthesis temperature of the mesoporous silica KIT-6 template. The CN/KIT-6 composites were then heated in a nitrogen flow of 100 mL per minute to 400 °C with a heating rate of 3 °C min−1 and kept under these conditions for 5 h for polymerization. The MCN-9 materials were recovered after dissolution of the silica framework in 5 wt% hydrofluoric acid by filtration, washed several times with ethanol, and dried at 100 °C. Nonporous CN was prepared under the above conditions except for the addition of the mesoporous silica template in the synthesis mixture. Bulk non-porous C3N6 was prepared without any external template using the aminoguanidine hydrochloride precursor and carbonized it at 400 °C with a heating rate of 3 °C min−1 and kept under these conditions for 5 h.2.4 Electrochemical measurements
Electrochemical measurements were performed in a conventional three electrode cell, using a Pt plate and a Ag/AgCl electrode (3 M KCl) as the counter electrode and reference electrode, respectively. 0.2 M Na2SO4 aqueous solution was used as an electrolyte without any additive and was purged with nitrogen gas for 2 h prior to the measurements. The working electrode was prepared on a glassy carbon electron. In the typical electrode preparation, 5 mg of the MCN-9-150 was dissolved in 0.8 mL of absolute ethanol, and then 10 μl of Nafion was added to the above mixture and then this sample was kept under sonication for 30 min to get slurry. 1 μL of the slurry was deposited on the glassy carbon electrode and dried at 100 °C prior to analysis.2.5 Photocatalytic reaction conditions
Photocatalytic reactions were carried out in a Pyrex top irradiation reaction vessel connected to a glass closed gas circulation system. H2 production was performed by dispersing 0.1 g well ground catalyst powder in an aqueous solution (100 mL) containing triethanolamine (10 vol%) as the sacrificial electron donor. Pt was photodeposited on the catalysts using H2PtCl6 dissolved in the reactant solution. The reactant solution was evacuated several times to remove air completely prior to irradiation under a 300 W Xe lamp and a water cooling filter. The wavelength of the incident light was controlled by using an appropriate long pass cut-off filter. The temperature of the reactant solution was maintained at room temperature by a flow of cooling water during the reaction. The evolved gases were analyzed using a gas chromatograph equipped with a thermal conductivity detector.The apparent quantum efficiency (AQE) for H2 evolution was measured in the same experimental set-up but with a 405 nm semiconductor diode laser as the incident light source. The irradiation area was 7.92 cm2. The total intensity of irradiation was determined by averaging 40 points of the irradiation area. The average intensity was estimated to be 4.24 mW cm−2 (ILT 950 spectroradiometer). The AQE was calculated by using the following equation:
 | (1) |
2.6 Characterization
The powder X-ray diffraction (XRD) patterns of MCN-9 materials were collected on a Rigaku diffractometer using Cu Kα (λ = 0.154 nm) radiation. The diffractograms were recorded in a 2θ range from 0.6 to 10° with a 2θ step size of 0.0017 and a step time of 1 s. Nitrogen adsorption and desorption isotherms were measured at −196 °C on a Quantachrome Autosorb 6 sorption analyzer. All samples were outgassed at 250 °C for 6 h prior to nitrogen-adsorption measurements. The specific surface area was calculated using the Brunauer–Emmett–Teller (BET) method. The pore size was obtained from the adsorption branch of the nitrogen isotherms using the Barrett–Joyner–Halenda (BJH) method. The morphology of the MCN-9 materials prepared under different synthesis conditions was observed on a Hitachi S-4800 field emission scanning electron microscope using an accelerating voltage of 5.0 kV. The HRTEM images were obtained using a JEOL-3000F and a JEOL-3100FEF field emission high-resolution transmission electron microscope equipped with a Gatan-766 electron energy-loss spectrometer. The preparation of the samples for HRTEM analysis involved sonication in ethanol for 2 to 5 min and deposition on a copper grid. The accelerating voltage of the electron beam was 200 kV. Elemental analysis was done using a Yanaco MT-5 CHN analyzer. The FT-IR spectra of the MCN-9 materials were recorded on a Nicolet Nexus 670 instrument by averaging 200 scans with a resolution of 2 cm−1, measuring in transmission mode using the KBr supported pellet technique. Electrochemical measurements such as Mott–Schottky plots were performed on a CHI 760C electrochemical workstation.3. Results and discussion
The optimized hard template synthesis process for the preparation of MCN-9 through the self-condensation followed by polymerization reaction of aminoguanidine hydrochloride using the KIT-6 template is shown in Scheme 1. It should be mentioned that a constant amount of aminoguanidine hydrochloride was introduced into the mesopore channels of the KIT-6 templates irrespective of their pore diameter. The structure of the prepared materials was examined by powder X-ray diffraction (XRD) analysis. Fig. 1 displays the low and wide angle powder XRD patterns of the MCN-9-X materials where X denotes the synthesis temperature of the KIT-6 template. As can be seen in Fig. 1, all the samples exhibit a peak at a low angle of 1° and a few higher angle reflections between 1 and 3° indicating the presence of a highly ordered 3D porous structure similar to the parent KIT-6 template. The high intense peak at around 1° can be indexed to the (211) Bragg reflection of the body centered cubic mesostructure with the Ia3d space group.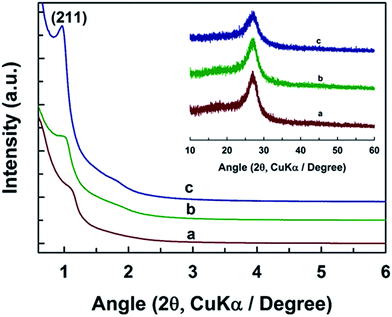 | ||
| Fig. 1 Low angle and wide angle powder XRD (inset) patterns of (a) MCN-9-100 (b) MCN-9-130 and (c) MCN-9-150 prepared by using different pore diameters of KIT-6 silica templates. | ||
It should be noted that the 3D mesostructure and structural order of the materials are significantly affected as the pore diameter of the KIT-6 template is increased. For example, a broad (211) reflection with a significant reduction in the intensity is observed for MCN-9-100, revealing a reduction in the structural order of MCN-9-100. The presence of a disordered mesoporous structure in the MCN-9-100 sample may be attributed to the smaller pore diameter together with small interconnected pores in the KIT-6-100 template which does not provide enough space for the formation of a high molecular weight polymeric network based on the diamino-s-tetrazine moieties. In addition, these low molecular weight polymers formed inside the pores of the KIT-6-100 may be disintegrated using a high temperature annealing process, leading to a slight destruction in the structural order of the final MCN-9-100. On the other hand, the intensity of the (211) reflection for MCN-9-130 and MCN-9-150 is significantly higher than that of MCN-9-100, indicating a significant improvement in the mesoporous structural order of these materials. Thus, it can be concluded that pore diameter of the template plays a critical role in controlling the mesostructure of the MCN materials and the template materials having the largest pore diameter favor the formation of a well-ordered MCN mesostructure. A similar effect has also been observed for the MCN reported previously.16,18,20
It can also be observed that an increase in the pore diameter of the templates causes a shift of the (211) peak towards the lower-angle region, which provides evidence of an increase of the d-spacing and the unit-cell parameter (Table 1). The unit-cell constants for MCN-9-150, MCN-9-130 and MCN-9-100 are calculated to be 22.53, 22.04, and 19.6 nm, respectively. To check the crystalline structure and the graphitic character of the MCN-9, the materials were characterized by wide angle powder XRD measurement. Fig. 1 (inset) shows the wide angle powder XRD patterns of MCN-9 materials. All the samples exhibit a relatively sharp reflection at a 2θ value of 26.94° corresponding to the interlayer distance of 0.33 nm, which can be attributed to the interlayer distance of the carbon nitride sheets (resembling the (002) reflection of graphite) due to the intrinsic atomic arrangement of C and N in the CN wall structure. However, the peak is much broader than that observed for the pure nonporous carbon nitride nanostructure which can be attributed to either a reduced correlation length due to the primary mesoporous channels or the intra-layer periodicity of the CN layers.
| Material | d (211) spacing (nm) | Unit cell a0 (nm) | A BET (m2 g−1) | V p (cm3 g−1) | d p,BJH (nm) | From CHNS (wt%) | |||
|---|---|---|---|---|---|---|---|---|---|
| C | N | H | N/C | ||||||
| MCN-9-100 | 8.0 | 19.6 | 157 | 0.36 | 3.02 | 29.9 | 55.24 | 2.6 | 1.87 |
| MCN-9-130 | 9.0 | 22.04 | 268 | 0.55 | 4.6 | 27.8 | 56.4 | 2.6 | 2.02 |
| MCN-9-150 | 9.2 | 22.53 | 346 | 0.63 | 4.7 | 28.6 | 57.8 | 2.75 | 2.03 |
| Bulk C3N6 | — | — | 10 | 0.02 | — | 29.4 | 61.2 | 2.72 | 2.08 |
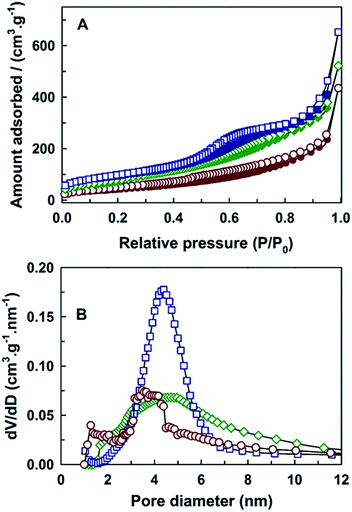
Mesoporosity and further information on the nature and the size of pores in MCN-9 materials were also obtained from the nitrogen adsorption–desorption measurements. Fig. 2A shows the N2 adsorption–desorption isotherms of MCN-9 prepared by employing the KIT-6 template with different pore diameters. The textural parameters such as the specific surface area, specific pore volume and pore diameter of the MCN-9 samples are also summarized in Table 1. Except for the MCN-9-100 sample, all the other samples show type IV adsorption isotherms, according to the IUPAC classification and feature capillary condensation with a small hysteresis in the mesopores, which indicates the presence of well-ordered mesopores in the samples. The position of the capillary condensation step shifted from a lower relative pressure to higher relative pressure with increasing the pore diameter of the template. This reveals that the pore size of the MCN-9 increased with increasing the pore size of the KIT-6 template, which is quite consistent with the unit cell expansion observed from the low angle powder XRD patterns in Fig. 1 and the corresponding increase in the d-spacing (Table 1).
The amount of nitrogen adsorbed on the MCN-9-150 is more than those adsorbed on the MCN-9-130 and MCN-9-100. The specific surface area and specific pore volume increased from 157 to 346 m2 g−1 and 0.36 to 0.63 cm3 g−1, respectively. It is noteworthy that the capillary condensation step in the isotherm of the MCN-9-100 sample is neither sharp nor clear, indicating the presence of a disordered mesoporous structure in the sample, although KIT-6-100 (Fig. S1 and Table S1 in the ESI†) exhibits a well-ordered mesostructure and excellent textural parameters. These results confirm that the MCN-9-100 material possesses a disordered mesoporous structure and the replication process is not successful when the KIT-6-100 template (8.0 nm) is used. On the other hand, KIT-6-130 and KIT-6-150 templates with 9.9 and 11.3 nm (Table S1†) pore diameters yielded a faithfully replicated structure of MCN-9-130 and MCN-9-150 with an excellent mesoporous structural order. This is quite consistent with the data obtained from the XRD analysis. From these results, one can conclude that the 3D template with a large pore diameter is critical to obtain well-ordered mesoporous MCN-9 materials through the nanotemplating process.
Fig. 2B shows the BJH adsorption pore size distribution of MCN-9-100, MCN-9-130 and MCN-9-150. The change in the pore diameter of the MCN-9 materials upon increasing the pore diameter of the template is clearly evident from the pore-size analysis. All of the samples show a main peak that mainly comes from the mesopores formed after dissolution of the silica matrix from the template. It should also be mentioned that the full-width at half-maximum of the BJH adsorption pore-size distribution of MCN-9-150 is larger than that of MCN-9-100 and MCN-9-130. Contrary to the MCN-4 materials, the expansion of pore diameter of the MCN-9 materials was limited to 4.7 nm. This could be mainly due to the perfect pore filling of the CN polymer matrix in the 3D ultra large mesopores of KIT-6 materials than the unidimensional hexagonal mesopores of SBA-15 materials.
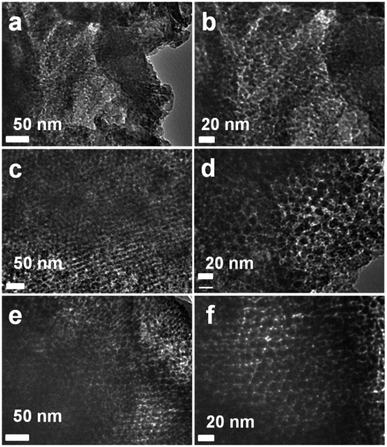
The surface topology of the MCN-9 materials with different structural orders and pore diameters can be observed from TEM. The representative TEM images of MCN-9 materials are shown in Fig. 3. These images clearly indicate that the mesoporous structure of the MCN-9 is changed from ordered to disordered as the pore diameter of the template is decreased. The MCN-9-100 (Fig. 3a and b) sample shows a disordered mesoporous structure with a lot of defect sites and cracks along the wall structure which is consistent with the low angle powder XRD and nitrogen sorption measurements showing the decrease in the long range mesostructural order. On the other hand, the TEM images of MCN-9-130 and MCN-9-150 materials clearly display a highly ordered mesoporous structure with a linear array of mesopores, which are arranged at regular intervals. These well ordered mesopores originate from the mesoporous silica wall structure that would convert into the mesopores of the resultant carbon nitride after the HF treatment. The cross sectional TEM images of MCN-9-130 and MCN-9-150 samples clearly show the presence of a well ordered 3D body centered cubic mesostructure, which is almost same as that reported for the 3D mesoporous silica template, KIT-6 (Fig. 3c and e). This clearly demonstrates that 3D mesoporous carbon nitride with the body centered cubic Ia3d type structure has been truly replicated from the KIT-6 mesoporous silica template. It should also be noted that the lattice fringes of the crystalline CN network were not observed for any of the samples, revealing that the samples are partially amorphous in nature. It is also confirmed by the TEM images that the pore diameter and the unit cell constant of MCN-9-150 are larger than those of MCN-9-100 which is again supported by the data obtained from porosity and low angle powder XRD measurements. The morphology of the MCN-9 materials having different textural parameters was also observed by high resolution scanning electron microscopy (HRSEM) and the images are shown in Fig. S2.† As can be seen in Fig. S2,† all the samples show a morphology similar to that of the KIT-6 template further confirming the successful replication process.
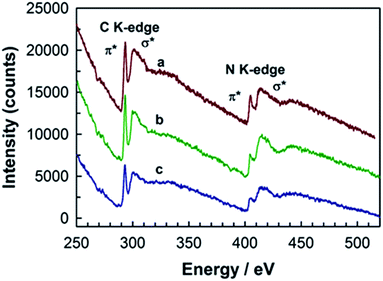
Fig. 4 shows the electron energy loss (EEL) spectra of the MCN-9 materials having various textural parameters. The nitrogen to carbon atomic ratio calculated from the EELS analysis for all the samples is found to be 1.9 ± 0.1, which is very close to the N/C atomic ratio observed for previously reported diamino-s-tetrazine based MCN-4 samples with a 2D hexagonal porous structure. These results are in good agreement with the data obtained from the CHNS analysis (Table 1). The shape of the EEL spectra of all the samples is almost similar and features a sharp C peak and N K-edge peaks. The C K-edges of the spectrum are located at 292.2 and 301.0 eV which can be attributed to the 1s-π* and 1s-σ* electronic transition of sp2 hybridized carbon trigonally bonded to the nitrogen.20,21 The N K edges are seen at ca. 410.8 and, 422.0 eV which may be attributed to the nitrogen atoms sp2-hybridized with carbon and nitrogen, respectively.16,20,21 These results further confirm the presence of sp2 hybridized carbon and nitrogen throughout the sample. This was possible only because of the formation of diamino-s-tetrazine based aromatic moieties in the mesoporous wall structure. Interestingly, the shape of the C and N K edges in the spectrum is quite similar, suggesting the presence of strong bonds between C and N atoms in all of the MCN-9 samples. Moreover, the intensity and the shape of the π* and σ* peaks are quite consistent in all of the MCN-9 samples irrespective of the pore diameter, indicating the presence of tetrazine moieties in all of the products.
The chemical composition and purity of the MCN-9 materials were further confirmed by energy dispersive X-ray (EDX) analysis done at different locations of the samples and elemental mapping. Fig. 5 shows the energy-dispersive X-ray (EDX) pattern of MCN-9 samples with different pore diameters and their corresponding elemental mapping. The peaks for the elements C and N are clearly seen in the EDX spectrum. The peak corresponding to O was not observed in the EDX spectrum, indicating that the sample is highly pure and free from any contamination from either atmospheric oxygen or oxynitrides or the amorphous silica template. The N/C ratio of MCN-9 materials calculated from the EDX analysis is found to be ca. 1.9, which is much closer to the values of the N/C ratio obtained from CHNS analysis (Table 1) and from the EELS measurement (N/C = 1.9 ± 0.1), confirming a high nitrogen content in the samples similar to the MCN-4 materials. Elemental mapping of C and N atoms in the MCN-9 samples is shown in Fig. S3.† The data reveal that the carbon (C) and nitrogen (N) are uniformly distributed throughout samples which suggests that the walls are composed of several layers of the periodic CN network with the diamino-s-tetrazine moieties, as observed by the wide angle powder XRD measurements. No other element was found in the elemental mapping, indicating that the material is mainly composed of C and N.
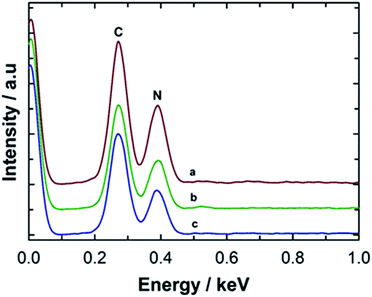 | ||
| Fig. 5 Energy dispersive X-ray spectroscopy (EDX) analysis of (a) MCN-9-100, (b) MCN-9-130, and (c) MCN-9-150. | ||
In order to check the information concerning the nature of C and N bonding and the amount of carbon and nitrogen content, the MCN-9 materials were characterized by XPS and FT-IR spectroscopy. The XPS survey spectrum and the separated C 1s and N 1s spectra of MCN-9-150 are shown in Fig. 6. The description of C 1s and N 1s peaks is also summarized and tabulated in Table 2. The XPS survey spectrum (Fig. 6A) shows the presence of C, N, and O. The presence of a small amount of oxygen can be attributed to the moisture, ethanol, atmospheric O2, or CO2 adsorbed on the surface of MCN-9-150. The overall atomic nitrogen to carbon ratio of MCN-9-150 determined by XPS is found to be 1.9, which is in close agreement with the results obtained from EELS, EDX and CHNS analysis showing a high content of nitrogen. This is quite remarkable considering the poor thermodynamic stability of N in the carbon matrix at a high temperature. This is mainly due to the fact that the CN framework composed of diamino-s-tetrazine moieties is quite stable at high temperature, providing a high thermal stability. The XPS C 1s spectrum of MCN-9 shows a major peak centered at 287.6 eV and two minor peaks at about 284.6 eV and 293.1 eV. The main peak at 287.6 eV is very sharp with a high intensity and is assigned to sp2 carbon atoms bonded to three neighboring nitrogen atoms.9,22 A similar peak was also assigned to the diamino-s-tetrazine based 2D MCN-4 material. The minute peak with the lowest energy contribution at 284.6 eV is attributed to sp2 carbon atoms in the sample. On the other hand, the highest energy contribution at 293.1 eV corresponds to sp2 hybridized carbon in the aromatic ring attached to terminal uncondensed NH2 groups. The N 1s spectrum of MCN-9-150 was mainly deconvoluted into three main peaks centered at binding energies of 398.3 eV, 400.2 eV and 403.5 eV. The main peak centered at 398.3 eV is attributed to nitrogen atoms bonded to sp2 carbon atoms in the diamino-s-tetrazine based CN network. The peaks at higher binding energies of about 400.2 and 403.5 eV are ascribed to the nitrogen trigonally bonded to the carbon atoms and the N![[double bond, length as m-dash]](https://www.rsc.org/images/entities/char_e001.gif) N bonding configuration, respectively, which is due to the presence of diamino-s-tetrazine based nitrogen atom arrangement in the MCN-9 wall structure.23 These results are quite consistent with the results obtained for the C 1s spectra.
N bonding configuration, respectively, which is due to the presence of diamino-s-tetrazine based nitrogen atom arrangement in the MCN-9 wall structure.23 These results are quite consistent with the results obtained for the C 1s spectra.
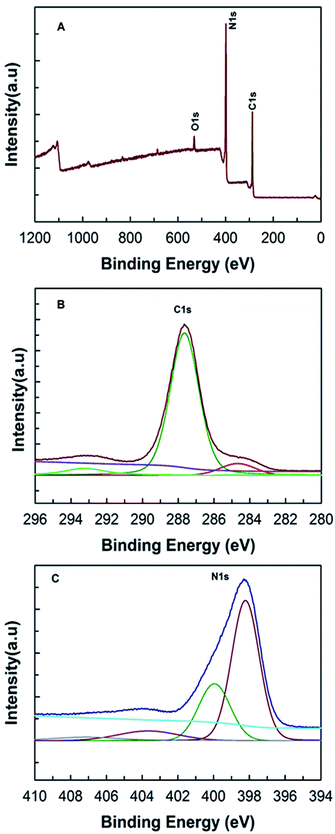 | ||
| Fig. 6 (A) XPS survey spectra, (B) C 1s XPS survey spectra, and (C) N 1s XPS survey spectra of MCN-9-150. | ||
| Sample (MCN-9-150) | From C 1s spectra | From N 1s spectra | |||
|---|---|---|---|---|---|
![[double bond splayed left]](https://www.rsc.org/images/entities/char_e009.gif) C C![[double bond, length as m-dash]](https://www.rsc.org/images/entities/char_e001.gif) N– N– |
C–NH2 | ![[double bond splayed left]](https://www.rsc.org/images/entities/char_e009.gif) C C![[double bond, length as m-dash]](https://www.rsc.org/images/entities/char_e001.gif) N– N– |
![[double bond splayed left]](https://www.rsc.org/images/entities/char_e009.gif) N– N– |
–N![[double bond, length as m-dash]](https://www.rsc.org/images/entities/char_e001.gif) N– N– |
|
| Peak position (eV) | 287.6 | 293.1 | 398.3 | 400.2 | 403.5 |
| FWHM | 2.06 | 1.95 | 1.99 | 1.59 | 4.67 |
| Area% | 83.3% | 11.3% | 66.9% | 17.0% | 14.2% |
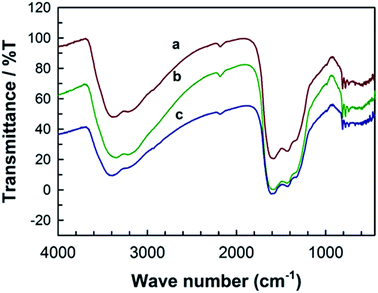
The surface chemical bonding state of the MCN-9 materials was characterized by FT-IR spectroscopy. Fig. 7 shows the FT-IR spectra of MCN-9 samples having different textural parameters. All the samples show similar IR bands suggesting that the nature and the coordination of the MCN-9 materials are not affected by the pore diameter of the template used in the preparation process. The IR bands in the region of 740–790 cm−1 are attributed to the syn- and anti-phase vibrations of N![[double bond, length as m-dash]](https://www.rsc.org/images/entities/char_e001.gif) N of the tetrazine ring. The peaks at 1321 and 1421 cm−1 are characteristic of C
N of the tetrazine ring. The peaks at 1321 and 1421 cm−1 are characteristic of C![[double bond, length as m-dash]](https://www.rsc.org/images/entities/char_e001.gif) N and N
N and N![[double bond, length as m-dash]](https://www.rsc.org/images/entities/char_e001.gif) N stretching modes of tetrazine moieties present in the MCN-9.15 Another band at 1574 cm−1 is assigned to the graphite-like C–N band, mainly originated due to the aromatic ring modes of the diamino-s-tetrazine molecule. Higher order absorptions at 3192 and 3327 cm−1 are ascribed to the terminal N–H stretching of uncondensed amino groups attached to the sp2 hybridized carbon and the O–H stretching of the H2O molecules adsorbed on the surface of the sample. A very weak absorption at 2168 cm−1 is also present in the spectrum, which may be attributed to N
N stretching modes of tetrazine moieties present in the MCN-9.15 Another band at 1574 cm−1 is assigned to the graphite-like C–N band, mainly originated due to the aromatic ring modes of the diamino-s-tetrazine molecule. Higher order absorptions at 3192 and 3327 cm−1 are ascribed to the terminal N–H stretching of uncondensed amino groups attached to the sp2 hybridized carbon and the O–H stretching of the H2O molecules adsorbed on the surface of the sample. A very weak absorption at 2168 cm−1 is also present in the spectrum, which may be attributed to N![[double bond, length as m-dash]](https://www.rsc.org/images/entities/char_e001.gif) C
C![[double bond, length as m-dash]](https://www.rsc.org/images/entities/char_e001.gif) O stretching due to the contaminated oxygen either from atmospheric O2 or CO2. Thermal stability of the MCN-9 samples in the presence of air was studied by TG-DTA and the result is shown in Fig. S4.† As shown in the TG curve, the MCN-9 sample is stable upto 450 °C in the presence of air but decomposes slowly upon increasing the temperature above 450 °C.
O stretching due to the contaminated oxygen either from atmospheric O2 or CO2. Thermal stability of the MCN-9 samples in the presence of air was studied by TG-DTA and the result is shown in Fig. S4.† As shown in the TG curve, the MCN-9 sample is stable upto 450 °C in the presence of air but decomposes slowly upon increasing the temperature above 450 °C.
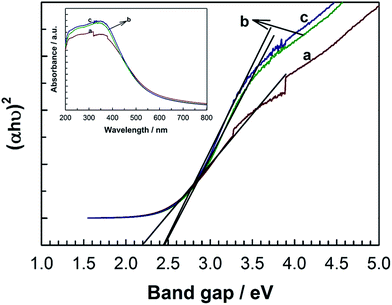
One of the most interesting features of the diamino-s-tetrazine based MCN-9 materials is their narrow band gap, which has been estimated by UV-Vis absorption spectroscopy (Fig. 8). As shown in Fig. 8, the intrinsic absorption edge of MCN-9 covers longer wavelengths of the visible region, indicating a small band gap energy. All of the MCN-9 samples show typical semiconducting absorption with an estimated band gap in the range of 2.2–2.5 eV, which is less than that of the melon based graphitic C3N4 band gap (2.7 eV). Interestingly, the UV-Vis absorption is shifted to higher wavelengths as the pore diameter of MCN-9 decreases. Among the samples studied, MCN-9-100 shows the lowest band gap of 2.25 eV whereas MCN-9-150 registered the largest band gap of 2.49 eV. The difference in the band gap of MCN-9 with different pore diameters could be attributed the number of CN layers in the wall structure of samples. It is expected that MCN-9-150 has thicker walls as compared to MCN-9-130 and MCN-9-100, causing a significant difference in the final band gap of the materials.
The chemical structure of MCN-9 was further confirmed by the synchrotron-based near-edge X-ray absorption fine structure (NEXAFS). The NEXAFS data and the proposed molecular structure of CN walls in MCN-9 are shown in Fig. 9. The results are also compared with the NEXAFS spectra of non-porous g-C3N4 prepared from a dicyandiamide precursor. As shown in the C K-edge spectra (Fig. 9A), the main characteristic peaks of carbon nitride observed in the MCN-9 and g-C3N4 materials are as follows: π*C–N–C (C1) at 288.9 eV and σ*C–C (C2) at 294–300 eV. As previously reported,24–26 the heptazine based g-C3N4 structure shows three main characteristic resonances predominantly at 399.7, 401.7, and 402.7 eV in the N K-edge spectra (Fig. 9B), which are attributed to π*C–N–C (N1: one tri-s-triazine hetero ring structure), π*N–3C (N3: graphitic 3-fold N configuration), and π*N–3C (N4: sp3 bridging N among three tri-s-triazine moieties), respectively (Fig. 9C).
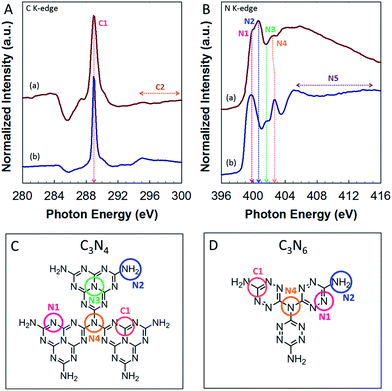 | ||
| Fig. 9 (A) C K-edge and (B) N K-edge NEXAFS spectra of (a) MCN-C3N6 and (b) g-C3N4. Schematic molecular structure of (C) g-C3N4 and (D) MCN-9 with the stoichiometry of C3N6. | ||
However, MCN-9 with C and N stoichiometry of C3N6 shows a completely different C and N bonding environment in the wall structure as presented in the N K-edge spectra and proposed molecular structure (Fig. 9D). The graphitic C–N–C bonds (N3) are not observed in the wall structure of MCN-9. The N4 peak position of MCN-9 is also slightly shifted to a lower energy state compared to that of g-C3N4, indicating that the sp3 bridging N of MCN-9 is affected by electron migration from N-rich three C2N4 moieties around the bridging N atom. It is also interesting to note that the N2 peak (terminal C–N–H bonds) of MCN-9 shows much higher intensity than that of g-C3N4, indicating that high nitrogen contents including –NH and –NH2 groups are created in the surface edges of the MCN-9 framework. These results confirm that the molecular structure of CN in the walls of MCN-9 is completely different from that of MCN with C3N4 stoichiometry. It is expected that the structure with tetrazine moieties, the density of these inbuilt amine functional groups and the presence of structural defect sites can have a significant effect on the electronic structure of MCN-9 such as the band gap and the band position, and their performance in various applications including photocatalysis. To determine the band gap structure of MCN-9 samples, we have carried out electrochemical Mott–Schottky measurements and recorded XPS valence band spectra (ESI, Fig. S6†), which revealed the typical n-type characteristics of the MCN-9-150 semiconductor. From the Mott–Schottky plots, we have observed the flat band potential of −0.93 eV for the MCN-9-150 sample, which is less than that of graphitic C3N4 whose conduction band edge has a band potential of −1.42 eV.31 As shown in Fig. S6,† the valence band (VB) values of the MCN-9-150 and 3D mesoporous C3N4 were approximately +1.56 and +2.08 eV respectively.
The photocatalytic activity of the MCN-9 samples was evaluated for H2 production from an aqueous proton solution under visible light irradiation (λ > 420 nm) and the results are also compared with the photocatalytic activity of nonporous CN prepared without using any hard template. Chloroplatinic acid and triethanolamine were used as precursors to create H2 reduction sites (Pt nanoparticles) and electron donors, respectively. The photocatalytic experiments were carried out with the water-insoluble MCN-9 and non-porous CN powders modified with 3 wt% platinum as the co-catalyst. Remarkably, the MCN-9 sample quickly reached steady H2 production from water containing 10 vol% triethanolamine as an electron donor, whereas nonporous CN showed a very poor catalytic performance. Fig. 10 shows the time course of H2 evolution obtained over the MCN-9-150 sample under visible light (λ > 420 nm) irradiation. In contrast, no reaction occurred in the dark even in the presence of the MCN-9 material. MCN-9-150 shows the best H2 evolution activity with a catalytic performance of 31.5 μmol h−1 (0.0910 μmol h−1 per unit surface area), whereas non-porous C3N6 registered a poor catalytic performance of 5.5 μmol h−1 (0.55 μmol h−1 per unit surface area). The H2 evolution on the MCN-9 was about 5 times higher than that of the non-porous C3N6 sample. The apparent quantum efficiency of MCN-9-150 was calculated to be 0.21% at 405 nm (Table S2†) by using eqn (1).
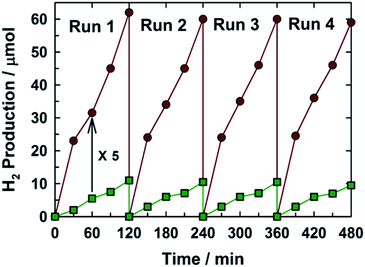 | ||
| Fig. 10 Time course of H2 gas evolution using the MCN-9 photocatalyst (circles), with reference to bulk non-porous C3N6 (squares) prepared from aminoguanidine hydrochloride without any template. | ||
The production of H2 increases steadily with prolonged time of light irradiation. After four consecutive runs (12 h), a total of 0.5 mmol H2 gas (11.2 mL) was produced, and no deactivation of the photocatalysts was found, suggesting the excellent stability of MCN-9-150 as an organic photocatalyst for solar H2 generation. This is a very important finding as it provides the pathway for the continuous production of hydrogen from aqueous solution and further paves the way for the commercialization of this technology. It should be mentioned that no nitrogen gas was observed, indicating the strong binding of N within the covalent structure of MCN-9. No reaction occurred when the system was illuminated in the absence of the MCN-9-150 catalyst, which confirms that the reaction is indeed driven by light absorption by the catalyst. The hydrogen evolution rate of MCN-9 under visible light irradiation is higher than those of the reported g-C3N4 materials.26–31 It is also interesting to note that the activity of the MCN-9 is much higher than those of mesoporous C3N6 with the 2D structure, mesoporous C3N4 prepared from the KIT-6-150 template and non-porous C3N4 (Fig. S5†). The excellent photocatalytic performance of MCN-9 for hydrogen evolution could be attributed to the combination of three dimensional pore structure with a high specific surface area and large pore volume, and the unique tetrazine molecular structure together with the low energy band gap which allow larger absorption of light in the visible region and more interaction with the water molecules. We surmise that these MCN nanostructures with unique molecular structures could also be used in various applications ranging from organic solar-cells and organic light emitting diodes to organic components for molecular electronics. We also strongly believe that the photocatalytic activity of diaminotetrazine based MCN materials could be enhanced by altering their electronic structure with the doping of either sulphur or phosphorous or other inorganic metal or metal oxide nanoparticles.
4. Conclusions
In summary, highly ordered three dimensional diamino-s-tetrazine based mesoporous carbon nitride materials (MCN-9) with a high specific surface area, a large pore volume, tunable pore diameters and C3N6 stoichiometry were prepared through self-condensation followed by polymerization of nitrogen enriched aminoguanidine hydrochloride (NH2NNHCNHNH2·HCl) as a single molecular precursor using 3D KIT-6 with different pore diameters as templates. High N content and a well ordered 3D mesoporous structure in MCN-9 materials were confirmed by EDX, EELS, XPS, CHNS, low angle powder XRD, N2 adsorption/desorption and HRTEM analysis. The textural parameters of the MCN-9 samples can be finely controlled with a simple adjustment of the pore diameter of the KIT-6 silica template. The XPS, EELS and FT-IR spectroscopy results reveal that MCN-9 was mainly composed of diamino-s-tetrazine moieties with a N/C ratio of 1.9. The band gap of these materials was estimated by using UV-Vis spectra and found to be in the range of 2.25–2.5 eV. The MCN-9 shows excellent activity for photochemical reduction of water with visible light in the presence of Pt as a co-catalyst and electron donors. MCN-9 also registered much higher performance than non-porous C3N4 and C3N6, 2D mesoporous C3N4 and 2D mesoporous C3N6. The combination of the unique structure with tetrazine moieties in the wall structure, low band gap (2.25–2.5 eV) and 3D mesoporous structure favors the excellent photocatalytic activity of MCN-9 for hydrogen evolution. We believe that MCN-9 materials with exceptional textural parameters, lower band gap and high nitrogen content could pave the way for using these materials for various other applications including solar cells, organic light-emitting diodes to organic components for molecular electronics, energy storage, capacitors, adsorption and separation of small and large organic toxic and biomolecules, vitamins and amino acids, and chemosensors.Acknowledgements
A. Vinu is grateful to the Australian Research Council for the Future Fellowship Award, Bessel Humboldt Award, and SABIC for the research grants. The authors also acknowledge the support of Dr Anton Tadich from the Australian Synchrotron for the soft X-ray beam time and Dr Wang for the photoelectrochemical measurements.References
- A. J. Bard and M. A. Fox, Acc. Chem. Res., 1995, 28, 141–145 CrossRef CAS.
- A. Fujishima and K. Honda, Nature, 1972, 238, 37–38 CrossRef CAS PubMed.
- K. Maeda and K. Domen, J. Phys. Chem. C, 2007, 111, 7851–7861 CAS.
- I. Tsuji, H. Kato and A. Kudo, Chem. Mater., 2006, 18, 1969–1975 CrossRef CAS.
- G. Hitoki, T. Takata, J. N. Kondo, M. Hara, H. Kobayashi and K. Domen, Chem. Commun., 2002, 1698–1699 RSC.
- S. Cao, J. Low, J. Yu and M. Jaroniec, Adv. Mater., 2015, 27, 2150–2176 CrossRef CAS PubMed.
- X. Wang, K. Maeda, A. Thomas, K. Takanabe, G. Xin, J. M. Carlsson, K. Domen and M. Antonietti, Nat. Mater., 2009, 8, 76–80 CrossRef CAS PubMed.
- A. Vinu, K. Ariga, T. Mori, T. Nakanishi, S. Hishita, D. Golberg and Y. Bando, Adv. Mater., 2005, 17, 1648–1652 CrossRef CAS.
- A. Vinu, Adv. Funct. Mater., 2008, 18, 816–827 CrossRef CAS.
- X. Wang, K. Maeda, X. Chen, K. Takanabe, K. Domen, Y. Hou, X. Fu and M. Antonietti, J. Am. Chem. Soc., 2009, 131, 1680–1681 CrossRef CAS PubMed.
- K.-D. Wehrstedt, W. Wildner, T. Güthner, K. Holzrichter, B. Mertschenk and A. Ulrich, J. Hazard. Mater., 2009, 170, 829–835 CrossRef CAS PubMed.
- Q. Li, B. Yue, H. Iwai, T. Kako and J. Ye, J. Phys. Chem. C, 2010, 114, 4100–4105 CAS.
- Y. Guo, S. Chu, S. Yan, Y. Wang and Z. Zou, Chem. Commun., 2010, 46, 7325–7327 RSC.
- (a) G. Liu, P. Niu, C. Sun, S. C. Smith, Z. Chen, G. Q. Lu and H.-M. Cheng, J. Am. Chem. Soc., 2010, 132, 11642–11648 CrossRef CAS PubMed; (b) Y. Zhang, T. Mori, J. Ye and M. Antonietti, J. Am. Chem. Soc., 2010, 132, 6294–6295 CrossRef CAS PubMed.
- E. Lieber and G. B. L. Smith, Chem. Rev., 1939, 25, 213–271 CrossRef CAS.
- (a) S. N. Talapaneni, G. P. Mane, A. Mano, C. Anand, D. S. Dhawale, T. Mori and A. Vinu, ChemSusChem, 2012, 5, 700–708 CrossRef CAS PubMed; (b) S. N. Talapaneni, D.-H. Park, J.-H. Choy, K. Ramadass, A. Elzatahry, A. S. Al Balawi, A. M. Al-Enizi, T. Mori and A. Vinu, ChemistrySelect, 2016, 1, 6062–6068 CrossRef CAS.
- Y. Sakamoto, M. Kaneda, O. Terasaki, D. Y. Zhao, J. M. Kim, G. Stucky, H. J. Shin and R. Ryoo, Nature, 2000, 408, 449–453 CrossRef CAS PubMed.
- A. Vinu, S. Anandan, C. Anand, P. Srinivasu, K. Ariga and T. Mori, Microporous Mesoporous Mater., 2008, 109, 398–404 CrossRef CAS.
- E. Z. Lee, Y.-S. Jun, W. H. Hong, A. Thomas and M. M. Jin, Angew. Chem., Int. Ed., 2010, 49, 9706–9710 CrossRef CAS PubMed.
- (a) S. N. Talapaneni, S. Anandan, G. P. Mane, C. Anand, D. S. Dhawale, S. Varghese, A. Mano, T. Mori and A. Vinu, J. Mater. Chem., 2012, 22, 9831–9840 RSC; (b) S. N. Talapaneni, J. H. Lee, S. H. Je, O. Buyukcakir, T.-w. Kwon, K. Polychronopoulou, J. W. Choi and A. Coskun, Adv. Funct. Mater., 2017, 27, 1604658 CrossRef.
- S. E. Rodil, W. I. Milne, J. Robertson and L. M. Brown, Appl. Phys. Lett., 2000, 77, 1458–1460 CrossRef CAS.
- D. Marton, K. J. Boyd, A. H. Al-Bayati, S. S. Todorov and J. W. Rabalais, Phys. Rev. Lett., 1994, 73, 118–121 CrossRef CAS PubMed.
- Y. Zhong, M. Jaidann, Y. Zhang, G. Zhang, H. Liu, M. Ioan Ionescu, R. Li, X. Sun, H. Abou-Rachid and L.-S. Lussier, J. Phys. Chem. Solids, 2010, 71, 134–139 CrossRef CAS.
- K. S. Lakhi, D. H. Park, G. Singh, S. N. Talapaneni, U. Ravon, K. Al-Bahily and A. Vinu, J. Mater. Chem. A, 2017, 5, 16220–16230 CAS.
- K. S. Lakhi, D. H. Park, S. Joseph, S. N. Talapaneni, U. Ravon, K. Al-Bahily and A. Vinu, Chem.–Asian J., 2017, 12, 595–604 CrossRef CAS PubMed.
- G. P. Mane, S. N. Talapaneni, K. S. Lakhi, H. Ilbeygi, U. Ravon, K. Al-Bahily, T. Mori, D. H. Park and A. Vinu, Angew. Chem., Int. Ed., 2017, 56, 8481–8485 CrossRef CAS PubMed.
- G. Zhang, J. Zhang, M. Zhang and X. Wang, J. Mater. Chem., 2012, 22, 8083–8091 RSC.
- J. Zhang, G. Zhang, X. Chen, S. Lin, L. Mohlmann, G. Dołega, G. Lipner, M. Antonietti, S. Blechert and X. Wang, Angew. Chem., Int. Ed., 2012, 51, 3183–3187 CrossRef CAS PubMed.
- N. Tiana, Y. Zhang, X. Li, K. Xiao, X. Du, F. Dong, G. I. N. Waterhouse, T. Zhang and H. Huang, Nano Energy, 2017, 38, 72–81 CrossRef.
- W. Wan, S. Yu, F. Dong, Q. Zhang and Y. Zhou, J. Mater. Chem. A, 2016, 4, 7823–7829 CAS.
- J. Zhang, X. Chen, K. Takanabe, K. Maeda, K. Domen, J. D. Epping, X. Fu, M. Antonietti and X. Wang, Angew. Chem., Int. Ed., 2010, 49, 441–444 CrossRef CAS PubMed.
Footnote |
| † Electronic supplementary information (ESI) available. See DOI: 10.1039/c7ta04041e |
| This journal is © The Royal Society of Chemistry 2017 |


