
 Open Access Article
 This Open Access Article is licensed under a Creative Commons Attribution-Non Commercial 3.0 Unported Licence
Principles of doping ceria for the solar thermochemical redox splitting of H2O and CO2†
Christopher
Muhich
 * and
Aldo
Steinfeld
* and
Aldo
Steinfeld
ETH Zurich, Department of Mechanical and Process Engineering, 8092 Zurich, Switzerland. E-mail: cmuhich@ethz.ch
First published on 8th July 2017
Abstract
Ceria-based metal oxides are promising redox materials for solar H2O/CO2-splitting thermochemical cycles. Density functional theory (DFT) computations are applied to elucidate the underlying mechanism of the role of dopants in facilitating ceria based redox cycles; specifically, we explain why some dopants increase performance, while others do not. Firstly, we find that Zr and Hf dopants increase the oxygen exchange capacity of ceria because they store energy in tensilely strained Zr– or Hf–O bonds which is released upon O-vacancy formation. This finding corrects a long held assumption that Zr and Hf decrease the O-vacancy formation energy by compensating for ceria expansion upon reduction. Although the released strain energy decreases the O-vacancy formation energy, O-vacancy formation remains sufficiently endothermic to split H2O and CO2. Secondly, we show that two electrons must be promoted into the high energy Ce f-band during reduction if the O-vacancies are to store sufficient energy to drive the oxidative gas splitting step. This means that di- and trivalent dopants are not suitable for this process. Lastly, we show that dopants which break O bonds due to their small size or strongly covalent character, such as Ti and the pentavalent dopants, substantially decrease the O-vacancy formation energy because only three O bonds must break during reduction. These vacancies, therefore, are too low in energy to drive gas splitting. Based on these findings, we develop guidelines for new ceria doping strategies to facilitate solar thermochemical gas splitting cycles.
1. Introduction
The 2-step solar thermochemical redox cycle has been identified as a promising high-efficiency approach for solar fuel production.1–4 It consists of the reduction of a metal oxide using concentrated solar process heat to liberate O2, followed by its re-oxidation with H2O and/or CO2, generating H2 and/or CO, according to:1.1. Reduction

| (1) |
1.2. Oxidation
| MOx−δ + δH2O → MOx + δH2 | (2a) |
| MOx−δ + δCO2 → MOx + δCO | (2b) |
 | (3) |
 | (4) |
As shown in eqn (3), increasing the H2 production capacity can be accomplished by either decreasing the reduction enthalpy or increasing the reduction entropy. Altering the reduction energy is more straight forward, and is accomplishable via doping. To this end, many researchers have attempted to dope ceria with di-, tri-, tetra- and pentavalent dopants to improve the redox performance of ceria. Di-, tri- and pentavalent dopants, including Li, Mg, Cu, Zn, Sr, Al, Sc, Cr, Mn, Fe, Co, Ni, Y, La, Pr, Sm, Gd, and Ta provide little, if any, improvement in the H2 production capacity of ceria, although some prevent sintering and grain growth.16,20,23–31 Tetravalent Zr and Hf, however, have been shown to significantly improve the redox capacity of ceria.24,30,32–34 To date the selection of dopants for STWS is mostly based on trial and error; therefore, we attempt to bring an understanding of ceria dopants to the STWS community.
Currently, Zr and Hf dopants are thought to decrease the reduction energy of ceria, and thereby increase the reduction extent and the resulting H2 production,24,30,32–34 by compensating for the expansion that ceria undergoes upon reduction.33,35–38 The rational for this hypothesis is explained as follows. When O-vacancies form in ceria during reduction, each removed O2− anion nominally releases two electrons to the ceria bulk; these electrons localize on two Ce4+ reducing them to Ce3+ cations, as shown in Kroger–Vink notation:
 | (5) |
This reduction is associated with ceria expansion, which has traditionally been ascribed to the formation of Ce3+ cations, which are larger than Ce4+ cations.33,37,39–42 The presence of the smaller dopant cations, i.e. Zr and Hf, are believed to alleviate the expansive strain caused by the larger Ce3+ cations via the overlap of tensile and compressive strain fields; simultaneously decreasing the extent of expansion and decreasing the reduction energy.33,35–38 This is very logical based on the cationic radius explanation for the expansion of ceria upon reduction. However, we have recently shown that the formation of Ce3+ cations is not responsible for ceria expansion, but rather ceria expands because of outward relaxation from the O-vacancy due to non-counterpoised forces.43 This then suggests that the strain compensation theory for improved performance with Zr and Hf is incorrect. Therefore, the effects of tetravalent dopants on ceria need to be reevaluated if new and improved modifications to ceria are to be rationally designed.
In this work we develop a fundamental understanding of the role of dopants in altering the ceria O-vacancy formation energy, and therefore its redox performance for STWS, using Density Functional Theory (DFT)44 based quantum mechanical simulations. Specifically, we investigate early transition metal di-, tri-, tetra- and pentavalent dopants, their effects on the O-vacancy formation energies in ceria and the reason for their effects. We will show that dopants alter the ceria reduction energy via three modes: (1) altering the Fermi energy of the system, and therefore the energy required to promote the electrons released upon O vacancy formation to empty bands; (2) intrinsically breaking O bonds which reduce the number of O bonds which must be severed during O-vacancy formation; and (3) storing strain energy in the dopant-O bonds which is released upon O vacancy formation. We show that only the latter mode of altering the reduction energy improves the redox performance for STWS for single element doped ceria because it suppresses the reduction energy the least and thus enables the O-vacancy to store sufficient energy to drive eqn (2a). Of all the dopants investigated, only the tetravalent Hf and Zr operate via the third mode. Lastly, we suggest guidelines for future doping strategies.
2. Computational methods
Doped ceria materials were investigated using periodic boundary condition based density functional theory quantum chemical calculations as implemented in the Quantum Espresso software package.45 Exchange and correlation energies were calculated using the Perdew–Burke–Ernzerhof (PBE) generalized gradient approximation (GGA) density functional.46 The use of ultra-soft pseudo-potentials47 enabled us to only explicitly simulate the valance and outer core electrons while maintaining chemical accuracy. In the case of O, we only calculated the valence electrons (2s, and 2p); however, we included s and p outer core electrons for all metals and transition metals, for example the Ce 5s, and 5p electrons were calculated in addition to the valence 6s, 5d, and 4f electrons. Wave functions were based on summations of plane-waves with energies up to 530.6 eV (39 Ry) which was determined by a cut-off energy study conducted from 408.2 to 680.3 eV (30–50 Ry). The O-vacancy formation energy in CeO2 was only 0.002 eV higher at a 530.6 eV cut-off energy as compared to the 680.3 eV cut-off energy in a 2 × 2 × 2 super cell; therefore, the less computationally demanding 530.6 eV cut-off energy was used. Due to the large super cell, and the associated extensive Brillion zone folding, all calculations were conducted at the gamma point, however, DOS and PDOS were calculated on a 2 × 2 × 2 Monkhorst–Pack k-point mesh or finer.This investigation utilized a super cell composed of a 3 × 3 × 3 repetition of the primitive ceria fluorite cell. The 3 × 3 × 3 super cell consisted of 27 cerium and 54 oxygen ions, for a total of 81 ions. Here, super cells containing either one or two O vacancies represent 1.85% or 3.70% O-vacancy concentrations, or reduction extents of δ = 0.037 or 0.074, respectively. The replacement of one or two Ce atoms by a dopant resulted in doping concentrations of 3.7%, or 7.4%, respectively. The 3 × 3 × 3 supercell size was chosen to represent likely reduction extents, and doping concentrations, while minimizing periodic image interactions (lattice vectors of ∼11.5 Å) and computational costs. O-vacancy formation energies were calculated by:
 | (6) |
A Hubbard correction (DFT+U)49 of U = 3.125 eV was imposed on the Ce f-orbitals to correct the propensity of generalized gradient approximation (GGA) based functionals, including PBE, to overly delocalize highly correlated electrons. This value was shown to be a good compromise between electronic structure accuracy and reduction energy accuracy for the Ultrasoft pseudopotential used in this work.43 We additionally considered correcting the d-orbitals of the dopant elements. We determined that imposing a U correction on the dopants has almost no effect (<0.02 eV variation) on the reduction energy based on a study of the effect Ueff values ranging from 0 (no correction) to 5 eV on the d-orbitals of Nb-CeO2, in addition to the 3.125 eV Hubbard correction on the Ce f-orbitals, as shown in (ESI) Fig. S1.† Therefore, no correction was applied to dopant ions. The nearly independent nature of the O-vacancy formation energy with respect to the correction of dopant d-states arises because the Ce f-states, rather than the dopant d-states, are largely responsible for accepting the electrons released by O-vacancy formation.
The calculations were conducted at 0 K. This assumes that the changes in energy and structure at the operational temperatures are small in comparison to the effects of doping. This is rationalized by the fact that introducing dopants into the system changes the reduction energy by up to 4 eV (see below), and it is unlikely that the formation of sub phases affects reduction energies to similar extents.
3. Results
In order to understand the effects of doping ceria on the redox cycle we first briefly discuss undoped ceria to establish a baseline for comparison. Among the dopants, we first discuss Zr and Hf tetravalent dopants which aid the redox performance,24,30,32–34 before discussing those dopants which do not, i.e. di-, tri-, Ti-, and pentavalent dopants,16,20,23–31 in that order. In each case, we investigated the elements from periodic table rows 4, 5, and 6, and detail the row 5 elements and then compare the row 4 and 6 elements to the exemplar. For each dopant, we examined an array of O-vacancy and Ce3+ localization configurations. All results are summarized in Table 1.| Single dopant atom (3.7%) | Two dopant atoms (7.4%) | |||||||||
|---|---|---|---|---|---|---|---|---|---|---|
| Ox cell length | Ox dopant–O bond length | Favorable O-vac site | E O-vac | O-vac site preference | Red cell length | Red dopant – O bond lengtha | Pair preferenceb | E O-vac | ||
| a Reported values do not include the distance to the O anion directly across from the vacancy, which is significantly shorter. b A positive number indicates that the paired configuration is preferred, a negative number indicates dopant repulsion. c A single number indicates that all three cell vector are the same length, a series of three shows the length of all three vectors. d Numbers separated by a slashes indicates a tetrahedral configuration, the first number is the tetrahedral bond length, the second number is the average of the remaining bond lengths. e N and F indicate a preference for the O-vacancy to neighbor the dopant or be away from the dopant, respectively. f Numbers in parenthesis correspond to the system after the formation of a second O-vacancy. | ||||||||||
| Pure | Ce | 11.66 | n/a | n/a | 2.85 | n/a | 11.69c | n/a | n/a | n/a |
| 4+ | Ti | 11.64 | 1.92/2.67d | Ne | 1.90 | 0.85 | 11.67, 11.65, 11.67 | 1.93/2.50 | 0.73 | 1.49 |
| Zr | 11.63 | 2.27 | N | 2.16 | 0.81 | 11.66 | 2.17/2.24 | −0.01 | 1.52 | |
| Hf | 11.63 | 2.26 | N | 2.08 | 0.88 | 11.66 | 2.16/2.23 | −0.03 | 1.33 | |
| 2+f | Ca | 11.66 | 2.45 | N | −1.20 | 0.35 | 11.67, 11.67, 11.64 | 2.41 (2.36) | n/a | n/a |
| (N) | (2.56) | (0.08) | (11.69, 11.69, 11.72) | |||||||
| Sr | 11.68 | 2.52 | N | −1.25 | 0.21 | 11.66, 11.70, 11.70 | 2.48 (2.49) | n/a | n/a | |
| (F) | (2.60) | (0.14) | (11.70, 11.74, 11.73) | |||||||
| Ba | 11.69 | 2.52 | N | −0.95 | 0.26 | 11.72, 11.65, 11.72 | 2.54 (2.53) | n/a | n/a | |
| (N) | (2.47) | (0.13) | (11.72, 11.72, 11.78) | |||||||
| 3+f | Sc | 11.63 | 2.31 | N | 0.33 | 0.69 | 11.65, 11.65, 11.64 | 2.26 | 0.44 | −1.52 (2.87) |
| Y | 11.65 | 2.38 | N | 0.70 | 0.22 | 11.67 | 2.34 | 0.06 | −1.37 (2.79) | |
| La | 11.67 | 2.45 | F | 0.83 | 0.05 | 11.69 | 2.46 | 0.03 | −1.03 (2.80) | |
| 5+ | V | 11.68 | 1.77/2.79 | N | 1.61 | 0.83 | 11.74, 11.64, 11.74 | 1.76/2.75 | 1.23 | 1.79 |
| Nb | 11.66 | 1.94/2.58 | N | 1.84 | 0.90 | 11.69, 11.68, 11.68 | 1.94/2.35 | 0.63 | 1.46 | |
| Ta | 11.66 | 1.94/2.56 | N | 1.71 | 1.35 | 11.66, 11.67, 11.66 | 2.01/2.22 | 0.48 | 1.15 | |
3.1 Reduction of undoped ceria
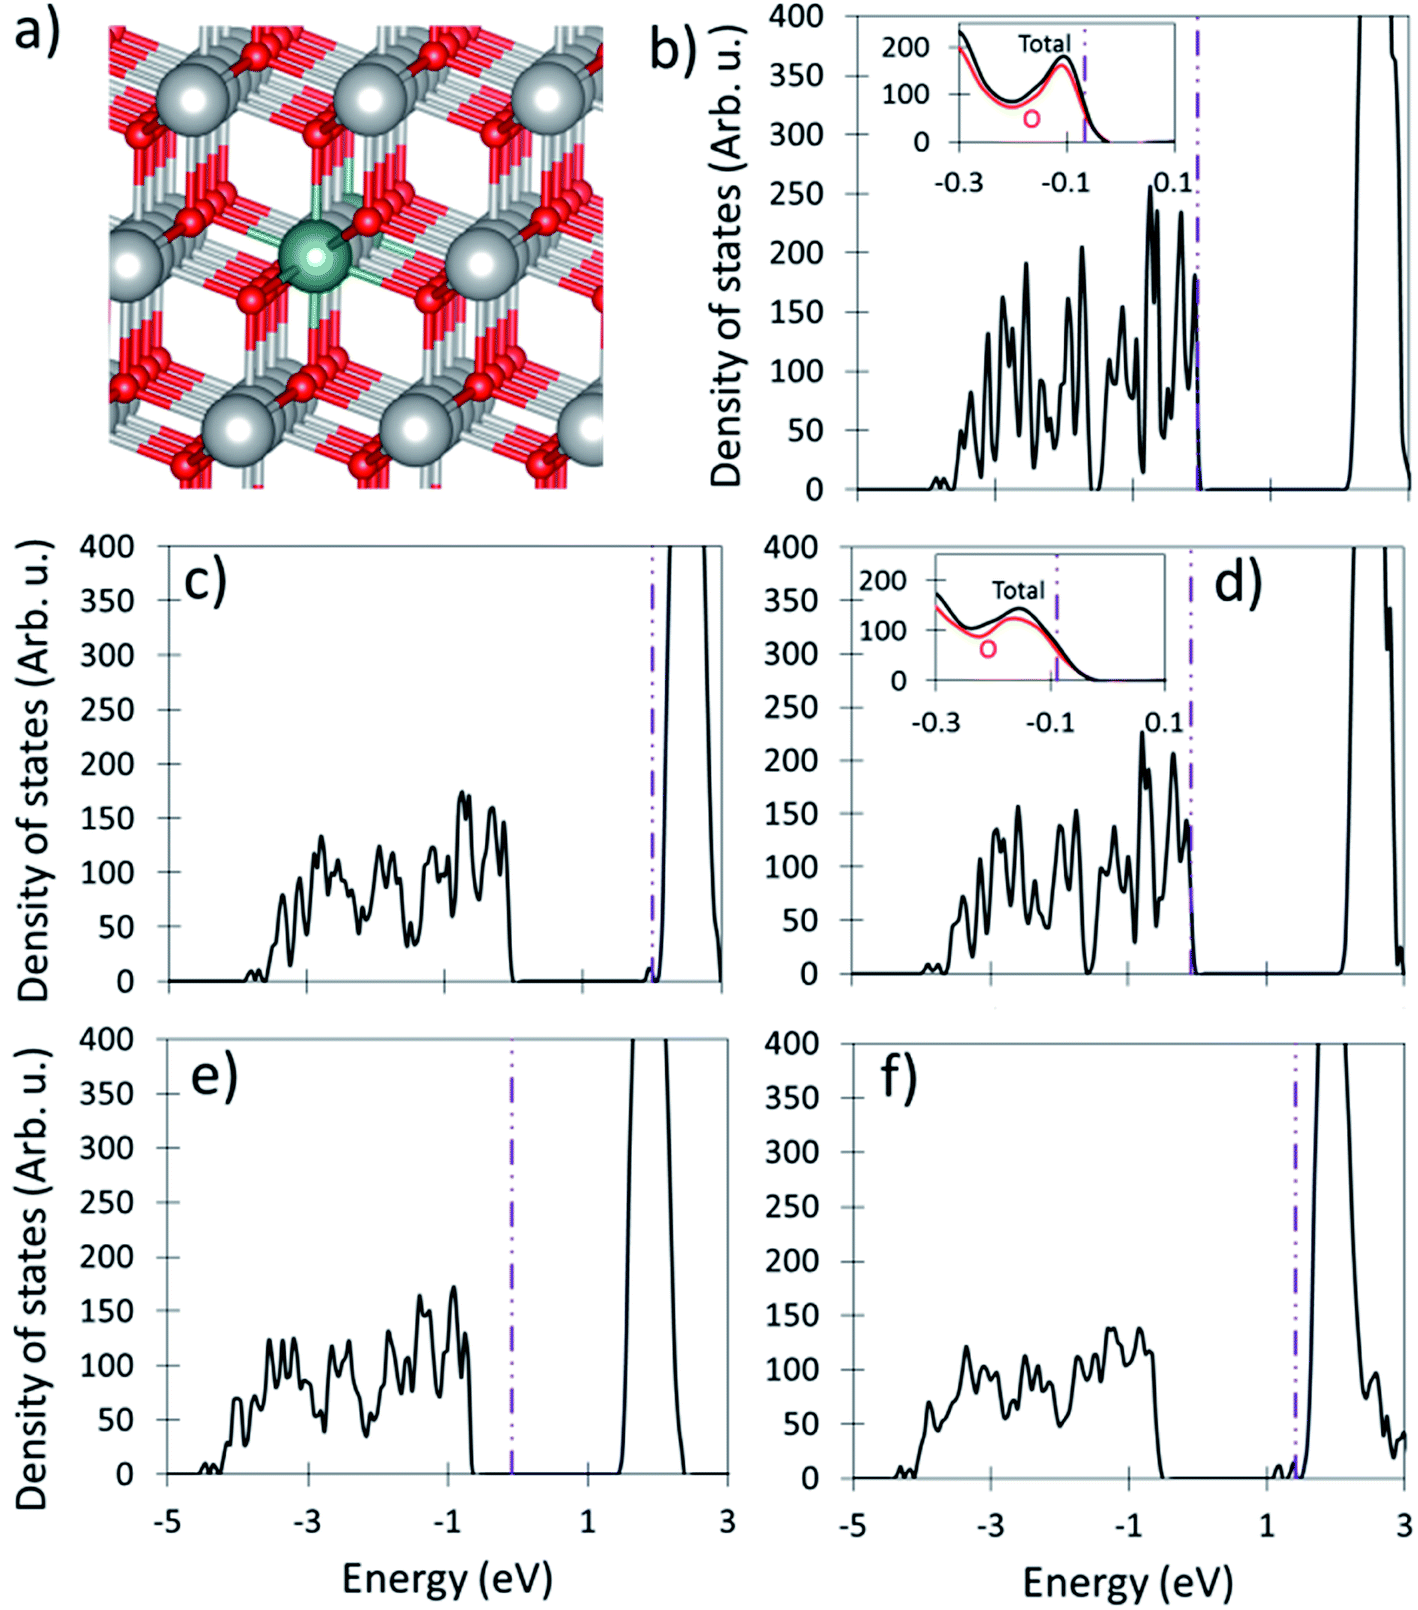
We calculate a ceria cubic lattice constant of 5.496 Å, which corresponds to lattice vectors of 11.658 Å in the 3 × 3 × 3 primitive cell based super cell used in this work and shown in Fig. 1a and tabulated in Table 1. The Ce cations are cubically (8-fold) coordinated while the O anions are tetrahedrally (4-fold) coordinated with a Ce–O bond length of 2.38 Å, and a Ce4+ to Ce4+ inter atomic distance (Ce4+–Ce4+ IAD) of 3.89 Å. The O anions are reduced while the Ce cations are oxidized, as shown by the fact that the valence band is mostly composed of O 2p states while the conduction band is composed of Ce d states, as shown in Fig. 1b, and ESI Fig. S2.† A narrow band of Ce 4f orbitals lies in the middle of the band gap. Bader change analysis confirms this, showing that O ions have charges of −1.23 while the Ce cations have charges of +2.46. The discrepancy in Bader and formal charges (−2 and +4 for O and Ce ions, respectively) arises from electron sharing in covalent bonds and the fact that charge assignment methods are imperfect. | ||
| Fig. 1 Oxidized and reduced ceria. (a) The geometric representation of the fully oxidized ceria cell, and (b) the density of states plot of the oxidized cell. (c) The geometric representation of reduced ceria, and (d) the density of states plot of the reduced cell. Large gray and small red spheres shows Ce and O ions respectively. In both (b) and (d) the insert shows the projected density of states. Projections onto the Ce orbitals is shown in ESI Fig. S2.† The purple dotted dashed line shows the Fermi level. | ||
Ceria reduction is endothermic by 2.85 eV, however this is an underestimation of the experimentally determined values (roughly 4.5 eV at δ = 0.03)50 due to the inclusion of the Hubbard correction. Upon reduction two electrons are promoted from the valence band to the f-band, localizing on two Ce cations that are second Ce nearest neighbors (2NN) from the O vacancy. This is confirmed by DOS analysis which shows that 74% of the two promoted electrons localized on the two 2NN Ce cations. The localization at the 2NN site is consistent with previous experimental and computational work.43,51–54 Because the O-vacancy formation energy (i.e. reduction energy) of a metal oxide stems from both the strength of the metal–oxygen bonds and the energy required to promote the electrons donated by the removed O anion into available bonds,55,56 it is unsurprising that ceria has a high O-vacancy formation energy owing to its relatively large band gap between the valence band and Ce f-band and strong Ce–O bonds.
The presence of an O-vacancy causes the lattice to expand to a = 11.691 Å, b = 11.688 Å, and c = 11.690 Å (a = 5.511 Å, b = 5.511 Å, and c = 5.510 Å in the cubic representation), as shown in Table 1. As detailed in our previous work,43 the expansion of the O anions around the Ce3+ cations (O2–Ce3+ IAD ∼2.45 Å) is counterbalanced by a contraction of the O2–Ce4+ IAD one coordination shell away from the Ce3+. This results in a negligible change in the cationic lattice, as indicated by the Ce3+–Ce4+ IAD of 3.90 Å, which is essentially unchanged from that in oxidized ceria (Ce4+–Ce4+ IAD of 3.89 Å). Ceria expansion is caused by the outward relaxation of the vacancy neighboring Ce4+ cations (Cevac4+) due the non-counterpoised attraction to the O anion opposite the vacancy. This results in a Ce4+vac–Ce4+vac IAD of ∼4.14 Å. These results are summarized in Table 1.
We also investigated the reduction energy of ceria when only one, or zero electrons are promoted to the f-band. To do this, either one or two electrons were removed from super cells with and without an O-vacancy. When only one electron is promoted (i.e. the cell has a +1 charge) the reduction energy decreases to only 0.98 eV. The reduction energy becomes exothermic (EO-vac = −1.09 eV) when no elections are promoted (i.e. the cell has a +2 charge). These findings demonstrate that the energy required to promote electron density into high energy f-bands is responsible for a large portion of the reduction energy of ceria. Therefore, dopants which do not require electronic promotion are expected to substantially decrease the reduction energy.
3.2 Performance improving materials: tetravalent dopants
 | (7) |
 | ||
| Fig. 2 Geometric and electronic characteristics of Zr-CeO2. (a) shows the oxidized material while (b) shows the reduced materials. In both (a) and (b), the left, middle and right panels show a geometric representation of the super cell, a close up view of the Zr cation and its coordinating O anions (including Zr–O distances), and the density of states plot. The large gray, medium green, and small red spheres of the left and middle panels represent Ce, Zr, and O ions respectively. The dotted square shows the location of the O-vacancy. The vertical dotted dashed line indicates the Fermi level in the DOS plots. | ||
The presence of the Zr cation disrupts the O anion symmetry; therefore, many unique O-vacancy sites exist. We calculated the formation energy of an O-vacancy at a site neighboring the Zr dopant (EO-vac = 2.16 eV) and one ∼7.12 Å from the dopant (EO-vac = 2.98 eV). In each case multiple Ce3+ configurations were assessed, and only the lowest energy configuration is discussed. When an O-vacancy forms in Zr-CeO2, two electrons are promoted into the f-band regardless of the O-vacancy location, just as in the case of undoped ceria, as is shown in Fig. 2. From an electronic promotion perspective, we would expect a similar O-vacancy formation energy at either position in Zr-CeO2 and in undoped ceria. From a bond breaking perspective we would expect that O-vacancies neighboring the Zr cation would be more unfavorable than those far from the Zr because Zr–O bonds are stronger than Ce–O bonds, based on the relative reduction energies of CeO2 and ZrO2.22,58 However, neither of these predictions is correct; therefore, the difference in O-vacancy formation energies arises from geometric changes in the material, as suggested by Wang et al.59
The formation of the O-vacancy in either position results in an expansion of the lattice from 11.63 Å to 11.66 Å. The similar expansion predicted for both O-vacancy configurations despite the large difference in reduction energy is contrary to the current explanation for the role of Zr, i.e. that the smaller Zr ionic radius compensates for Ce radius expansion and thereby lowers the reduction energy. Additionally, the Zr–Ce IAD's across the O-vacancy (4.13 Å) are larger than the Ce–Ce IAD (4.08 Å) when the O-vacancy neighbors the dopant, which is the opposite behavior than expected from the current explanation. Therefore, the current hypothesis is likely incorrect. However, other geometric changes occur when the O-vacancy neighbors the Zr cation.
The decreased O-vacancy formation energy of Zr-CeO2 arises from the strained Zr–O bonds. When the O-vacancy forms at a site neighboring the dopant three Ce–O and one Zr–O bonds are broken. This enables significant structural relaxation of the Zr cation, and a decrease in Zr–O bond length. The O–Zr bonds of the once cubically coordinated Zr cation relax from their elongated 2.27 Å length to a coordination where four anions form a distorted tetrahedral with Zr–O bond lengths of 2.11–2.18 Å, while the remaining three anions undergo a smaller 0.02 Å contraction to roughly 2.24 Å, as shown in Fig. 2 and detailed in Table 1. The new Zr–O bond lengths are much closer to those of Zr in its monoclinic structure – which has Zr–O bond lengths of 2.06 Å (two), 2.16 Å (three), and 2.25 Å (two).57 Consequently the Zr–O bonds in the reduced ceria are much less strained and therefore lower in energy. This released strain energy partially compensates for the energy of O-vacancy formation. When the O-vacancy is far from Zr, no Zr–O bonds are broken, and only minor relaxation of the Zr coordination occur (four O anions contract to a Zr–O IAD of 2.23 Å while four expand to a Zr–O IAD of 2.33 Å), resulting in minimal stress release, and minimal changes to the O-vacancy formation energy compared to undoped ceria.
We also investigated the behavior of Zr-CeO2 at a higher Zr concentration (7.3%) by including a second dopant in the super cell. This enabled multiple Zr configurations, two of which we examined: (1) the Zr cations are third cationic nearest neighbors (∼6.7 Å apart) which we call the far configuration; and (2) the Zr cations are first cationic nearest neighbors (∼3.80 Å apart) which we call the near configuration. These configurations are shown in ESI Fig. 3. The far configuration does not significantly alter the reduction energetics of ceria when the O-vacancy neighbors a dopant, where both have EO-vac = 2.16 eV, as shown in Table 1. However, the higher concentration increases the number of O anions coordinated to Zr dopants, and therefore increases the number of O-sites with a lowered reduction energy. The near configuration, where the O-vacancy neighbors both dopants, however, has a substantially decreased reduction energy (EO-vac = 1.52 eV). The decrease arises because two Zr cations relax and thus more bond strain is released. These O-vacancies are predicted to not be redox active because their formation energy is too low to drive water splitting. Because there is almost no energy preference for one configuration or the other (the separated configuration is preferred 0.01 eV), the Zr cations are likely randomly distributed through the material, where the isolated dopant cations facilitate STWS while paired dopants do not. This explains the initial increase and subsequent decrease in STWS performance of Zr-CeO2 with increasing Zr content.30,50 At low concentrations there are more isolated Zr cations and therefore many O-sites capable of splitting water, but as the concentration increase the portion of O-sites neighboring two dopants also increases, and therefore the number of STWS active sites eventually decreases.
 | ||
| Fig. 3 The effects of Sr-CeO2. (a) shows the geometry of Sr substituted ceria. The large gray and green, and small red spheres represent Ce, Sr, and O ions respectively. (b–d) show the DOS plots of Sr-CeO2 under different reduction extents, where (b) is the DOS when all O sites are occupied, (c) shows the presence of one O-vacancy and (d) shows the presence of a second O-vacancy. The inset of (b) details the area near the valence band maximum. The dotted–dashed purple vertical line indicates the location of the Fermi level. | ||
Overall, the decrease in reduction energy of Zr-CeO2 stems from strain stored in the Zr–O bonds which is released upon O-vacancy formation, rather than size compensation between the smaller Zr4+ cations and the enlarged Ce3+ cations, as is often suggested.33,35–38 This finding builds on the work of Wang et al., who suggested that structural relaxation is the driver for the decreased reduction energy,59 by explaining that the energy released during structural relaxation stems from strain release of the Zr–O bonds. The promotion of two electrons into the Ce f-orbitals and breakage of four O-cation bonds results in an O-vacancy formation energy that is high enough to drive water splitting when the vacancy is filled. This explains the improved behavior or Zr-CeO2 for STWS.24,30,32–34 Additionally, there is no attraction between Zr-dopants and therefore no driving force for the formation of O-sites with two Zr neighbors which have reduction energies too low for water splitting.
3.3 Non-performance improving materials
Here we discuss dopants which do not substantially increase the H2 production capacity of ceria. First we discuss di- and trivalent dopants, as they behave similarly, before discussing Ti and pentavalent dopants as they behave similarly, although by a different mechanism than the di- and trivalent dopants. All results are summarized in Table 1 and only major differences between dopants are highlighted. | (8) |
The formation of a charge compensating O-vacancy is exothermic at sites both neighboring (EO-vac = −1.25 eV) and away (EO-vac = −1.04 eV) from the Sr dopant. The formation of the oxygen vacancies results in the elimination of the empty O-2p states present in the over oxidized super cell and the movement of the Fermi level into the band gap, as shown in Figures Fig. 3b and c. The formation of O vacancies is favorable as no electrons must be promoted into the high energy f-orbitals, and the remaining O anions reduce towards their preferred −2 oxidation state. The exothermic O-vacancy formation energy indicates the spontaneous formation of O-vacancies in the lattice by Sr doping. The O-vacancy preferentially neighbors Sr cations because of the relative strengths of Sr–O bonds and Ce–O bonds. The Sr–O bonds are weaker than the Ce–O bonds because of the lower ionic attraction between O2− and Sr2+ than O2− and Ce4+; therefore, when the O-vacancy localizes next to the Sr dopant, an additional more stable Ce4+–O2− bond is maintained. As the formation of charge compensating O-vacancies is favorable, they cannot store energy, and therefore cannot drive water splitting.
A second O-vacancy was introduced into the lattice to investigate non-exothermic O-vacancy formation. Because of the strong site preference discussed above, an O-vacancy was maintained next to the Sr cation, while the second O-vacancy was subsequently placed on O lattice sites either near the Sr – but not directly next to the previous O-vacancy – or far from it. We calculate a reduction energy of 2.74 and 2.60 eV in the near and far configurations, respectively. The formation of the second O-vacancy formally results in the reduction of two Ce4+ cations to Ce3+ cations. This is shown in PDOS of Fig. 3d, where the Fermi energy has moved into the Ce f-orbital band. As in the case of pure ceria, the occupied Ce f-orbitals sit below the band of unoccupied Ce f-orbitals, indicating localized, rather than delocalized Ce3+ states.
The formation energy for the second, non-charge-compensating, vacancy (EO-vac = 2.60 eV) is only slightly lower than that of the undoped ceria (EO-vac = 2.85 eV). This is because in both cases two elections must be promoted into the high energy Ce f-states, and minimal strain energy is released (see Table 1). The charge compensating O-vacancies form spontaneously upon doping, therefore only non-charge compensating O-vacancies form at high temperatures. These vacancies have O-vacancy formation energies that are only 9% lower than in undoped ceria, which explains the similar STWS behavior of Sr-CeO2 and undoped CeO2,24 even though Sr-CeO2 has intrinsic vacancies.
 | (9) |
 | ||
| Fig. 4 The effects of Y-CeO2. (a) shows the geometry of Y substituted ceria. The large gray, medium olive green, and small red spheres represent Ce, Y, and O ions respectively (b–f) shows DOS plots of Y-CeO2 under different doping concentrations and reduction extents, where (b) is the DOS when all O sites are occupied, (c) shows the presence of one O-vacancy, (d) shows the presence of a second dopant, (e) shows the presence of an O-vacancy in a cell with two Y cations, and (f) shows the cell with two O-vacancy and two Y dopants. The insets of (b) and (d) detail the area near the valence band maximum. The dotted–dashed purple vertical line indicates the location of the Fermi level. | ||
Given the similar size of Y3+ and Ce4+, it is unsurprising that the structure undergoes little geometric change upon doping. The Y–O bonds are very slightly elongated, ∼2.384 Å, from the pure ceria Ce–O bond length of ∼2.379 Å, but they are substantially longer than the bonds in Y2O3 which range from 2.223 to 2.294 Å depending on the site.63 This suggests that the Y–O bonds are under tensile strain. Although the Y–O bonds are slightly elongated, the lattice vectors shrink slightly from 11.658 to 11.652 Å, as shown in Table 1, which we attribute to the under reduction of the O anions and the corresponding slightly decreased ionic attraction.
O-vacancy formation in Y-CeO2 is endothermic, and the O-vacancy preferentially occupies a site neighboring the dopant (0.74 eV), rather than far from the dopant (0.98 eV). The formation of the O vacancy next to the Y dopant allows the Y cation to move towards the remaining O-anions, decreasing the average bond length by 0.06 Å to 2.32 Å, which is closer to the Y–O bond lengths in Y2O3 (2.223 to 2.294 Å). We attribute the 0.24 eV site preference to the release of energy stored in the strained Y–O bond and the weaker ionic attraction of the +3 Y cation as compared to the +4 Ce cation. Upon formation of an O-vacancy, the electron density previously associated with the removed O anion redistributes through the material and only one electron is promoted to the Ce f-band, see Fig. 4c. The promotion of only one electron to the f-band, rather than two in undoped ceria, is responsible for the ∼2 eV decrease in reduction energy of Y-CeO2. The low energy of O-vacancy formation energy suggests that these vacancies are incapable of splitting water.
The presence of a second Y dopant results in two missing electrons in the valence band when all O sites are occupied, as shown in Fig. 4d. This suggests that the material should behave similarly to divalently doped ceria. Indeed, the O-vacancy formation energy in doubled Y-CeO2 is exothermic by −1.20 eV. Upon O-vacancy formation the Fermi energy moves back into the band gap. The formation of a second O-vacancy is endothermic by 2.79 eV which is similar (∼2% difference) to that of undoped ceria. This means that only the second O-vacancy is STWS redox active as the first is incapable of splitting water. Additionally, because the second O-vacancy has a formation energy similar to that of undoped ceria, they should have similar STWS activities, as is seen experimentally.24,31,64
When a second +3 dopant is present, the O-vacancy formation becomes exothermic for both La (−0.96 eV) and Sc (−1.52 eV) and are incapable of splitting water. Therefore, only additional, non-charge compensating O-vacancies which have similar energies to those in undoped ceria, as shown in and Table 1, are STWS active. Base on their O-vacancy formation energies, trivalent dopants are not expected to significantly improve to the STWS behavior of ceria which is seen experimentally.24,31,64 From these results, and those of charged undoped ceria, and divalently doped ceria, we can see that the energy input associated with double electron promotion to the f-band is necessary for storing enough energy in ceria to split water.
 | ||
| Fig. 5 The effects of Ti-CeO2. (a) and (b) show the fully oxidized material with 3.7 and 7.4% doping concentrations respectively. In both (a) and (b), the top, middle and bottom panels show a geometric representation of the super cell, a close up view of the Ti cation and its coordinating O anions (including Ti–O distances), and the density of states plot. The large gray, medium blue and small red spheres of the top and middle panels represent Ce, Ti, and O ions respectively. The vertical dotted dashed line indicates the Fermi level in the DOS plots. | ||
The presence of a single Ti dopant decreases the reduction energy to 1.87 eV and 2.75 eV when the dopant neighbors or is far from the cation, respectively. The decrease in O-vacancy formation energy does not arise from Ti–O bond strain release as the bond length of the tetrahedrally coordinating O anions remains essentially unchanged before (1.92 Å) and after O removal (1.91 Å), as shown in Table 1. Instead, we attribute the decreased reduction energy to the under-coordinated of O anions. This is counter to previous work which suggest that the size of Ti compensates for expansion upon reduction.35 To remove an O anion, only three Ce–O bonds must break rather than four when the anions are fully coordinated. The O-vacancy formation energies of Ti-, Hf-, and Zr-CeO2 (1.90, 2.08, and 2.16 eV respectively) would indicate that doping ceria with Ti should slightly improve the water splitting performance over Hf-, and Zr-CeO2; however, this is not the case.
Ti cations in CeO2 attract each other and thereby generate sites with very low O-vacancy formation energies. It is downhill in energy by 0.70 eV for two Ti cations to be cationic nearest neighbors as compared to two separated cations (i.e. one super cell with two neighboring cations and one without dopants vs. two super-cells containing one Ti cation each) as shown in Table 1. This suggests that most, if not all, Ti dopants will pair. For example, less than 1% of Ti cations are predicted to be unpaired at 1500 °C, based on a Boltzmann distribution. Therefore, the paired state must be the one considered for evaluating the doping effect of Ti on CeO2. When the Ti cations pair, each maintains its tetrahedral coordination to four O anions, while the remaining four of the previously eight coordinating anions relax outwards. Because the Ti dopants share two coordinating O anions, the relaxation of one of the Ti away from an O anion enables the anion to relax closer to the other Ti cation, as is shown in Fig. 5b. The associated of one O anion with each Ti is responsible for the greater stabilization of paired Ti cations. This drive for pairing also explain the low solubility of Ti in CeO2. In the paired configuration, the O-vacancy formation energy is suppressed to only 1.52 eV, or roughly half that of undoped ceria. The substantially decreased O-vacancy formation energy at sites neighboring two dopants arises because O anions at these sites are only 3-fold rather than 4-fold coordinated, and their removal enables further favorable structural relaxation. After O-vacancy formation the tetrahedral coordination remains, but the bond lengths to the remaining three O anions decrease, as shown in ESI Fig. S4.† The O-vacancy formation energy at these sites is so low that the vacancy cannot store sufficient energy to drive water splitting. Therefore, even if Ti were substantially soluble in ceria, which it is not, it would be unlikely to facilitate STWS.
 | (10) |
 | ||
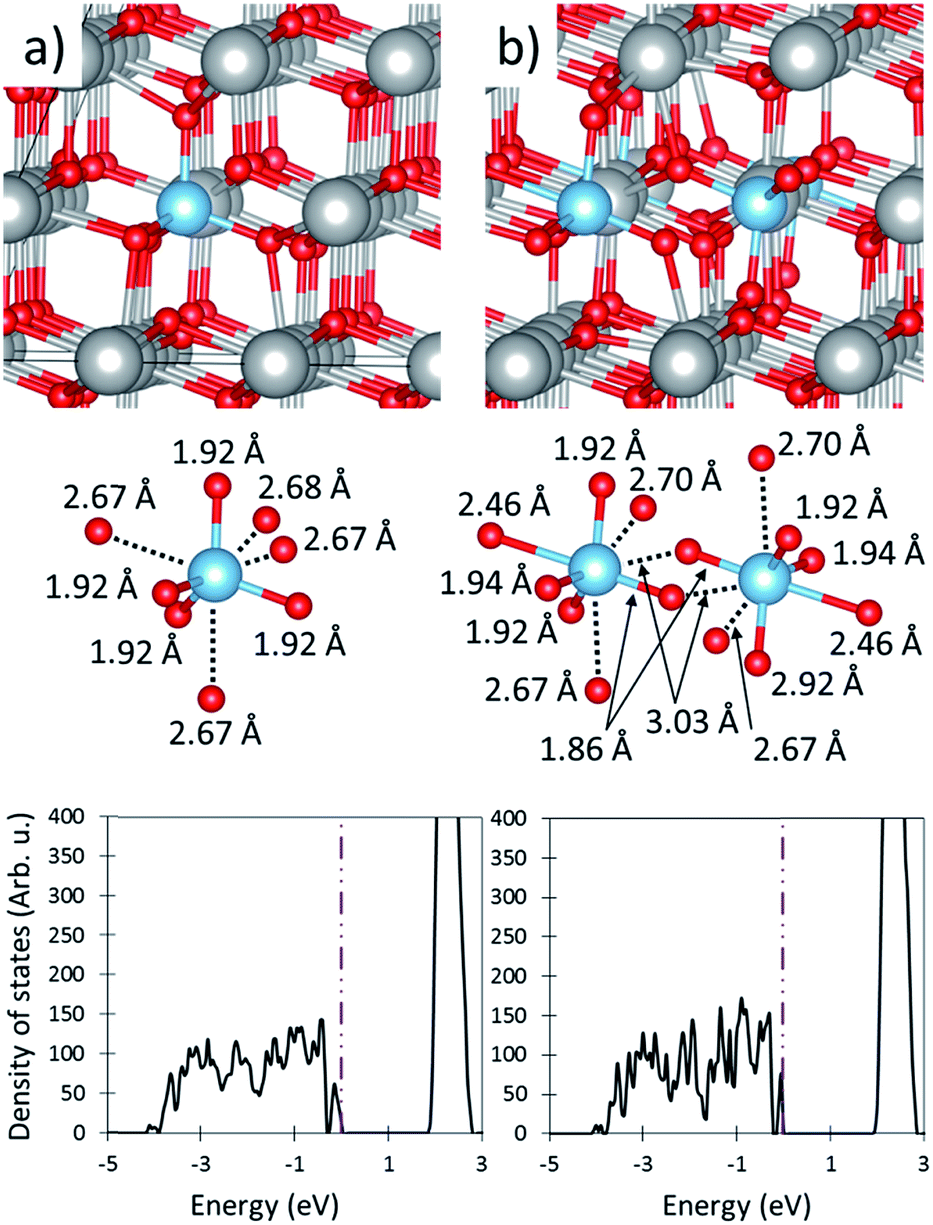
| Fig. 6 The effects of Nb-CeO2. (a) and (b) show the fully oxidized material with 3.7 and 7.4% doping concentrations respectively. In both (a) and (b), the top, middle and bottom panels show a geometric representation of the super cell, a close up view of the Nb cation and its coordinating O anions (including Nb–O distances), and the density of states plot. The large gray, medium green and small red spheres of the top and middle panels represent Ce, Nb, and O ions respectively. The vertical dotted dashed line indicates the Fermi level in the DOS plots. The insets of the bottom panels shows the PDOS of the cations. | ||
The relatively small ionic radius of Nb and the more covalent character of the Nb–O bonds result in large structural modifications of its coordinating O anions, as seen in Fig. 6. Similarly to Ti doping, the Nb cation is tetrahedrally coordinated, with Nb–O bond lengths of 1.94 Å and the remaining four O anions relaxing outward to an Nb–O IAD of ∼2.58 Å, as shown in Table 1. This suggests that there is only a bond between the Nb and the tetrahedrally positioned O anions, while the remaining O anions are under-coordinated and have dangling bonds. The high energy dangling bonds, therefore, are the cause of the valance band shoulder, and suggest that these O anions have a substantially reduced O-vacancy formation energy, as was seen in for Ti-CeO2.
The large distortions caused by the presence of a Nb dopant drastically decreases the O-vacancy formation energy to 1.84 eV and 2.75 eV for vacancy sites neighboring and far from the dopant, respectively. As is the case for Ti-CeO2, the under coordinated O anions in Nb-CeO2 are more easily removed from the lattice because only three bonds must be broken (i.e. the O–Ce bonds), rather than the four in undoped ceria. The similarity in behavior of Ti and Nb with respect to bond lengths and reduction energies, suggests that the extra electron of Nb has little effect on the behavior of Nb-CeO2, but rather that the geometric effects of the smaller Nb and Ti cations are the main cause for the modified ceria behavior.
Just as in the case of Ti, Nb cations attract each other, where Nb dopants preferentially occupy nearest cation neighbor sights by 0.63 eV compared to separated dopants. This large energy preference once again indicates that Nb dopants are likely to cluster, even at high temperatures, and that these configurations are the appropriate model for examining STWS behavior. In this configuration the O-vacancy formation energy is further decreased to 1.43 eV, similarly to Ti-CeO2, and is incapable of driving water splitting. Therefore, only secondary O-vacancies, such as those far from Nb centers are predicted to be STWS active, and the redox behavior of Nb-CeO2 is predicted to be similar to undoped ceria.
4. Discussion
Dopants alter the reduction energy of ceria, and therefore its STWS ability, through three effects: modifying the energy required to promote the electrons released by O-vacancy formation, inducing bond strain within the material, and inherently breaking O bonds. The latter two both arise from cationic size mismatch but the extent of the mismatch results in significant differences in their behaviors. The modification of promotion energy depresses the O-vacancy formation energy the most, followed by inherent bond breaking and finally O-dopant bond strain, as can be seen in Fig. 7. We will briefly comment on each of these effects and how they facilitate or hinder STWS. | ||
| Fig. 7 O-vacancy formation energy of doped ceria. The O-vacancy formation energy of undoped ceria with various charges are shown in solid black lines. Dashed lines are added to guide the eye. Solid markers show single O-vacancies, empty markers indicate two O-vacancies. Squares, diamonds, circles, and triangles mark di-, tri-, tetra- and pentavalent cations, respectively. The gray square shows two trivalent dopants with one O-vacancy. | ||
4.1 Decreasing electron promotion energy
The energy required to promote electrons to available bands upon reduction largely determines the O-vacancy formation energy. Doping ceria with di- and trivalent cations, or removing electrons from pure ceria, results in the under-reduction of the O-anions, and the generation of empty low energy O-2p states. Therefore, when an O vacancy forms, less (or no) electron density must be promoted into high energy Ce-f states. The more electron density that has to be promoted, the higher the energy penalty is for O-vacancy formation. The trivalent dopants are excellent examples of this because the number of missing electrons is controllable via the number of dopants. When two trivalent dopants are present, and therefore no electrons must be promoted, O-vacancy formation is exothermic. Additionally, the exothermicity almost exactly matches that of the divalent dopants and is quite similar to the pure CeO2 with two missing electrons, as shown in Fig. 7. This shows that despite slightly different ion sizes and charges the suppression of reduction energy is caused by the lack of electronic promotion. When only one trivalent dopant is present (i.e. one electron promotion to a Ce f-orbital) the reduction energy is roughly half way between the reduction of undoped ceria and ceria with two trivalent dopants. Lastly, when two O-vacancy form in divalent or doubly trivalent doped ceria, two electrons once again must be promoted to the f-band upon reduction, and the resulting O-vacancy formation energy is quite close (<10% difference) to that of undoped ceria. This shows that without the promotion of two electrons to the Ce-f band upon reduction, ceria reduction is exothermic or only slightly endothermic, in agreement with previous work,62,67–69 and therefore does not store sufficient energy to drive water splitting. Therefore, any modifications to ceria in an attempt to increase its redox behavior should require the promotion of two electrons into Ce-f orbitals.4.2 Breaking O bonds
The introduction of dopants with four or more valence electrons enables the full reduction of the O-anions and, therefore, ceria reduction requires the promotion of two electrons into high energy Ce-f bands. However, if the dopant cation is very small, or its O bonds have strong covalent character, it induces large structural reconfiguration and substantially weakens, if not fully brakes, O-cation bonds. This is seen in cases of Ti and the pentavalent dopants in Fig. 7. The O-vacancy formation energy at sites neighboring the dopant are significantly suppressed because an O-cation (the dopant) bond is already broken, and therefore only three O-cation (Ce) bonds must be severed to form an O-vacancy rather than four in undoped ceria. This substantially decrease the O-vacancy formation energy; as a result, these O-vacancies do not store enough energy to abstract an O atom from H2O molecules and consequently cannot drive STWS. Additionally, these rearrangements seem to lead to dopant clustering which further suppresses the O-vacancy formation energies. As in the case of under-reduction, only secondary O-vacancies with formation energies similar to undoped ceria are expected to be capable of driving water splitting. This means that bond breaking dopants do not increase the STWS capacity of ceria, and such doping strategies should be avoided.4.3 Straining O-bonds
Dopants which are slightly smaller than Ce4+ cations and fully reduce the O anions, such as Zr and Hf, pull their eight coordinating O anions inward without inducing changes to its coordination. If these bonds are longer than their ideal bond length because the O anions remain coordinated to three Ce cations, the bonds are strained and thus are high energy. The generation of an O-vacancy enables the dopant cations to relax towards the remaining O anions, decreasing the associated bond lengths and thus releasing the stored energy. This released energy in turn compensates for some of the energy required to break the four O-cation bonds and promote electron density into the Ce-f bands. The fact that strained bonds reduces the ceria reduction energy corrects a long held misunderstanding that they compensate for ceria expansion.33,35–38 Additionally, this explanation provides the fundamental understanding for why the geometric relaxation of Zr-CeO2 during reduction is associated with a decreased O-vacancy formation energy.59 While the energy released is sizable, it does not decrease the reduction energy to the same extent as the presence of pre-broken bonds or decreased electron promotion energy. Therefore, sufficient energy is still stored in the O-vacancies to split water. New ceria doping strategies which induce bond strain or otherwise slightly weaken the cation-O bond without breaking O-bonds or decreasing the electron promotion energy should be developed to increase STWS capacity.5. Conclusions
Using density functional theory, we investigated how doping ceria alters its ability to drive the H2O and CO2 splitting redox cycle. We showed that Zr and Hf dopants decrease the O-vacancy formation energy by storing energy in strained Zr–O or Hf–O bonds which is released when O-vacancies form. This corrects a long standing misunderstanding of the role of Zr and Hf dopants. We also show that dopants which result in the under-reduction of the O anions, i.e. di- and trivalent dopants, severely decrease the O-vacancy formation energy because electron density does not have to be promoted to the Ce-f orbitals upon reduction. It is the energy associated with two high energy electrons which drives water splitting. Lastly, we showed that dopants which result in under-coordinated O anions, due to their small size or highly covalent bonding character, also severely decrease the O-vacancy formation energy. To store sufficient energy for driving the redox cycle, four O-cation bonds have to be broken. From the understanding developed in this work, several guidelines for ceria modification to improve its redox performance are derived. First, the modification should result in the complete reduction of the O anions, and therefore O-vacancy formation should entail the promotion of two electrons into the f-orbitals. This then requires the dopants to be tetravalent or higher. Second, the dopants should not cause local restructuring which leaves O anions under-coordinated. Therefore, small cations with highly covalent O bonds are to be avoided. Third, dopants which decrease the strength, or increase the energy (i.e. tensile stain) of the O-dopant bond while remaining consistent with the above listed guidelines are desirable. Based on the properties of the elements, finding a single (non-Zr or -Hf) dopant that meets these criteria is unlikely. Therefore, doping strategies that modify both the behavior of ceria and the dopants themselves may meet the doping guidelines outlined above and should be sought.Acknowledgements
We gratefully acknowledge the financial support by the European Research Council under the European Union's ERC Advanced Grant (SUNFUELS – No. 320541). The DFT calculations were performed at the High-Performance Computation cluster of ETH Zürich.References
- A. Steinfeld, Sol. Energy, 2005, 78, 603–615 CrossRef CAS.
- C. Perkins and A. W. Weimer, Int. J. Hydrogen Energy, 2004, 29, 1587–1599 CrossRef CAS.
- C. L. Muhich, B. D. Ehrhart, I. Al-Shankiti, B. J. Ward, C. B. Musgrave and A. W. Weimer, Wiley Interdiscip. Rev.: Energy Environ., 2016, 5, 261–287 CrossRef CAS.
- M. Romero and A. Steinfeld, Energy Environ. Sci., 2012, 5, 9234–9245 CAS.
- C. L. Muhich, B. D. Ehrhart, V. A. Witte, S. L. Miller, E. N. Coker, C. B. Musgrave and A. W. Weimer, Energy Environ. Sci., 2015, 8, 3687–3699 CAS.
- A. Steinfeld, Int. J. Hydrogen Energy, 2002, 27, 611–619 CrossRef CAS.
- E. Koepf, W. Villasmil and A. Meier, Appl. Energy, 2016, 165, 1004–1023 CrossRef CAS.
- T. Nakamura, Sol. Energy, 1977, 19, 467–475 CrossRef CAS.
- P. Lichty, X. Liang, C. Muhich, B. Evanko, C. Bingham and A. W. Weimer, Int. J. Hydrogen Energy, 2012, 37, 16888–16894 CrossRef CAS.
- M. D. Allendorf, R. B. Diver, N. P. Siegel and J. E. Miller, Energy Fuels, 2008, 22, 4115–4124 CrossRef CAS.
- J. R. Scheffe, J. H. Li and A. W. Weimer, Int. J. Hydrogen Energy, 2010, 35, 3333–3340 CrossRef CAS.
- A. H. McDaniel, A. Ambrosini, E. N. Coker, J. E. Miller, W. C. Chueh, R. O'Hayre and J. Tong, Energy Procedia, 2014, 49, 2009–2018 CrossRef CAS.
- M. Takacs, M. Hoes, M. Caduff, T. Cooper, J. R. Scheffe and A. Steinfeld, Acta Mater., 2016, 103, 700–710 CrossRef CAS.
- A. H. McDaniel, E. C. Miller, D. Arifin, A. Ambrosini, E. N. Coker, R. O'Hayre, W. C. Chueh and J. H. Tong, Energy Environ. Sci., 2013, 6, 2424–2428 CAS.
- S. Abanades and G. Flamant, Sol. Energy, 2006, 80, 1611–1623 CrossRef CAS.
- W. C. Chueh and S. M. Haile, Chemsuschem, 2009, 2, 735–739 CrossRef CAS PubMed.
- W. C. Chueh, C. Falter, M. Abbott, D. Scipio, P. Furler, S. M. Haile and A. Steinfeld, Science, 2010, 330, 1797–1801 CrossRef CAS PubMed.
- S. Ackermann, L. Sauvin, R. Castiglioni, J. L. M. Rupp, J. R. Scheffe and A. Steinfeld, J. Phys. Chem. C, 2015, 119, 16452–16461 CAS.
- B. Bulfin, F. Call, M. Lange, O. Lübben, C. Sattler, R. Pitz-Paal and I. V. Shvets, Energy Fuels, 2015, 29, 1001–1009 CrossRef CAS.
- H. Kaneko, T. Miura, H. Ishihara, S. Taku, T. Yokoyama, H. Nakajima and Y. Tamaura, Energy, 2007, 32, 656–663 CrossRef CAS.
- B. D. Ehrhart, C. L. Muhich, I. Al-Shankiti and A. W. Weimer, Int. J. Hydrogen Energy, 2016, 41, 19881–19893 CrossRef CAS.
- R. J. Panlener, R. N. Blumenthal and J. E. Garnier, J. Phys. Chem. Solids, 1975, 36, 1213–1222 CrossRef CAS.
- S. Abanades, A. Legal, A. Cordier, G. Peraudeau, G. Flamant and A. Julbe, J. Mater. Sci., 2010, 45, 4163–4173 CrossRef CAS.
- Q.-L. Meng, C.-i. Lee, T. Ishihara, H. Kaneko and Y. Tamaura, Int. J. Hydrogen Energy, 2011, 36, 13435–13441 CrossRef CAS.
- Q.-L. Meng, C.-i. Lee, S. Shigeta, H. Kaneko and Y. Tamaura, J. Solid State Chem., 2012, 194, 343–351 CrossRef CAS.
- H. Kaneko, H. Ishihara, S. Taku, Y. Naganuma, N. Hasegawa and Y. Tamaura, J. Mater. Sci., 2008, 43, 3153–3161 CrossRef CAS.
- Q. Jiang, G. Zhou, Z. Jiang and C. Li, Sol. Energy, 2014, 99, 55–66 CrossRef CAS.
- E. V. Ramos-Fernandez, N. R. Shiju and G. Rothenberg, RSC Adv., 2014, 4, 16456–16463 RSC.
- A. Le Gal, S. Abanades, N. Bion, T. Le Mercier and V. Harlé, Energy Fuels, 2013, 27, 6068–6078 CrossRef CAS.
- J. R. Scheffe, R. Jacot, G. R. Patzke and A. Steinfeld, J. Phys. Chem. C, 2013, 117, 24104–24114 CAS.
- A. Le Gal and S. Abanades, J. Phys. Chem. C, 2012, 116, 13516–13523 CAS.
- A. Le Gal, S. Abanades and G. Flamant, Energy Fuels, 2011, 25, 4836–4845 CrossRef CAS.
- J. Scaranto and H. Idriss, Top. Catal., 2015, 58, 143–148 CrossRef CAS.
- Y. Hao, C.-K. Yang and S. M. Haile, Chem. Mater., 2014, 26, 6073–6082 CrossRef CAS.
- D. A. Andersson, S. Simak, N. V. Skorodumova, I. Abrikosov and B. Johansson, Appl. Phys. Lett., 2007, 90, 1909 Search PubMed.
- D. A. Andersson, S. Simak, N. V. Skorodumova, I. Abrikosov and B. Johansson, Phys. Rev. B: Condens. Matter Mater. Phys., 2007, 76, 174119 CrossRef.
- G. Balducci, J. Kašpar, P. Fornasiero, M. Graziani, M. S. Islam and J. D. Gale, J. Phys. Chem. B, 1997, 101, 1750–1753 CrossRef CAS.
- S. R. Bishop, D. Marrocchelli, W. Fang, K. Amezawa, K. Yashiro and G. W. Watson, Energy Environ. Sci., 2013, 6, 1142–1146 CAS.
- I. Al-Shankiti, F. Al-Otaibi, Y. Al-Salik and H. Idriss, Top. Catal., 2013, 56, 1129–1138 CrossRef CAS.
- S. Hull, S. T. Norberg, I. Ahmed, S. G. Eriksson, D. Marrocchelli and P. A. Madden, J. Solid State Chem., 2009, 182, 2815–2821 CrossRef CAS.
- S. R. Bishop, Acta Mech. Sin., 2013, 29, 312–317 CrossRef CAS.
- E. Aneggi, M. Boaro, S. Colussi, C. de Leitenburg and A. Trovarelli, Handb. Phys. Chem. Rare Earths, 2016, 50, 209–242 Search PubMed.
- C. L. Muhich, J. Phys. Chem. C, 2017, 121, 8052–8059 Search PubMed.
- W. Kohn and L. J. Sham, Phys. Rev., 1965, 140, 1133–1138 CrossRef.
- G. Paolo, B. Stefano, B. Nicola, C. Matteo, C. Roberto, C. Carlo, C. Davide, L. C. Guido, C. Matteo, D. Ismaila, C. Andrea Dal, G. Stefano de, F. Stefano, F. Guido, G. Ralph, G. Uwe, G. Christos, K. Anton, L. Michele, M.-S. Layla, M. Nicola, M. Francesco, M. Riccardo, P. Stefano, P. Alfredo, P. Lorenzo, S. Carlo, S. Sandro, S. Gabriele, P. S. Ari, S. Alexander, U. Paolo and M. W. Renata, J. Phys.: Condens. Matter, 2009, 21, 395502 CrossRef PubMed.
- J. P. Perdew, K. Burke and M. Ernzerhof, Phys. Rev. Lett., 1996, 77, 3865 CrossRef CAS PubMed.
- D. Vanderbilt, Phys. Rev. B: Condens. Matter Mater. Phys., 1990, 41, 7892–7895 CrossRef.
- K. Momma and F. Izumi, J. Appl. Crystallogr., 2011, 44, 1272–1276 CrossRef CAS.
- J. Hubbard, Proc. R. Soc. London, Ser. A, 1963, 276, 238–257 CrossRef.
- M. Takacs, J. R. Scheffe and A. Steinfeld, Phys. Chem. Chem. Phys., 2015, 17, 7813–7822 RSC.
- B. Wang, X. Xi and A. N. Cormack, Chem. Mater., 2014, 26, 3687–3692 CrossRef CAS.
- G. E. Murgida, V. Ferrari, M. V. Ganduglia-Pirovano and A. M. Llois, Phys. Rev. B: Condens. Matter Mater. Phys., 2014, 90, 115120 CrossRef.
- J. E. Sutton, A. Beste and S. H. Overbury, Phys. Rev. B: Condens. Matter Mater. Phys., 2015, 92, 144105 CrossRef.
- J.-F. Jerratsch, X. Shao, N. Nilius, H.-J. Freund, C. Popa, M. V. Ganduglia-Pirovano, A. M. Burow and J. Sauer, Phys. Rev. Lett., 2011, 106, 246801 CrossRef PubMed.
- A. M. Deml, V. Stevanovic, C. L. Muhich, C. B. Musgrave and R. O'Hayre, Energy Environ. Sci., 2014, 7, 1996–2004 CAS.
- A. M. Deml, A. M. Holder, R. P. O'Hayre, C. B. Musgrave and V. Stevanović, J. Phys. Chem. Lett., 2015, 6, 1948–1953 CrossRef CAS PubMed.
- C. J. Howard, R. J. Hill and B. E. Reichert, Acta Crystallogr., Sect. B: Struct. Sci., 1988, 44, 116–120 CrossRef.
- A. S. Foster, V. B. Sulimov, F. Lopez Gejo, A. L. Shluger and R. M. Nieminen, Phys. Rev. B: Condens. Matter Mater. Phys., 2001, 64, 224108 CrossRef.
- H.-F. Wang, X.-Q. Gong, Y.-L. Guo, Y. Guo, G. Z. Lu and P. Hu, J. Phys. Chem. C, 2009, 113, 10229–10232 CAS.
- G. M. Rignanese, X. Gonze, G. Jun, K. Cho and A. Pasquarello, Phys. Rev. B: Condens. Matter Mater. Phys., 2004, 69, 184301 CrossRef.
- P. A. O'Day, M. Newville, P. S. Neuhoff, N. Sahai and S. A. Carroll, J. Colloid Interface Sci., 2000, 222, 184–197 CrossRef PubMed.
- A. B. Kehoe, D. O. Scanlon and G. W. Watson, Chem. Mater., 2011, 23, 4464–4468 CrossRef CAS.
- J. Zhang, F. Paumier, T. Höche, F. Heyroth, F. Syrowatka, R. J. Gaboriaud and H. S. Leipner, Thin Solid Films, 2006, 496, 266–272 CrossRef CAS.
- J. R. Scheffe and A. Steinfeld, Energy Fuels, 2012, 26, 1928–1936 CrossRef CAS.
- J. Muscat, V. Swamy and N. M. Harrison, Phys. Rev. B: Condens. Matter Mater. Phys., 2002, 65, 224112 CrossRef.
- G. Zhou, J. Hanson and R. J. Gorte, Appl. Catal., A, 2008, 335, 153–158 CrossRef CAS.
- D. E. P. Vanpoucke, P. Bultinck, S. Cottenier, V. Van Speybroeck and I. Van Driessche, J. Mater. Chem. A, 2014, 2, 13723–13737 CAS.
- M. Nolan, J. Mater. Chem., 2011, 21, 9160–9168 RSC.
- Z. Hu and H. Metiu, J. Phys. Chem. C, 2011, 115, 17898–17909 CAS.
Footnote |
| † Electronic supplementary information (ESI) available. See DOI: 10.1039/c7ta04000h |
| This journal is © The Royal Society of Chemistry 2017 |