 Open Access Article
Creative Commons Attribution 3.0 Unported Licence
Facilitating hole transfer on electrochemically synthesized p-type CuAlO2 films for efficient solar hydrogen production from water†
Seung Yo
Choi
ab,
Chang-Duk
Kim
c,
Dong Suk
Han
d and
Hyunwoong
Park
 *abe
*abe
aSchool of Energy Engineering, Kyungpook National University, Daegu 41566, Korea. E-mail: hwp@knu.ac.kr; Tel: +82-53-950-8973
bSchool of Architectural, Civil, Environmental, and Energy Engineering, Kyungpook National University, Daegu 41566, Korea
cDepartment of Physics, Kyungpook National University, Daegu 41566, Korea
dChemical Engineering Program, Texas A&M University at Qatar, Education City, P.O. Box 23874, Doha, Qatar
eAdvanced Institute of Water Industry, Kyungpook National University, Daegu 41566, Korea
First published on 5th April 2017
Abstract
Delafossite CuAlO2 photoelectrodes are synthesized via the electrodeposition of Cu(II) and Al(III) onto fluorine-doped tin oxide (FTO) substrates in water and dimethylsulfoxide (DMSO) solvents, followed by annealing in air and Ar. The surface properties, crystalline structure, and photoelectrochemical (PEC) performance of the as-synthesized samples are significantly affected by the synthetic conditions. Optimized CuAlO2 electrodes (synthesized in DMSO and annealed in air) possess suitable energetics for H2 production under sunlight (an optical bandgap of ∼1.4 eV and a conduction band level of −0.24 VRHE). They exhibit a photocurrent onset potential of ∼+0.9 VRHE along with a faradaic efficiency of ∼70% at +0.3 VRHE in an alkaline solution (1 M KOH) under simulated sunlight (AM 1.5; 100 mW cm−2). The addition of sacrificial hole scavengers (sulfide and sulfite) significantly improves the PEC performance of CuAlO2 by a factor of eight, along with providing a faradaic efficiency of ∼100%. This indicates that the hole transfer limits the overall PEC performance. This issue is addressed by employing a ∼150 nm-thick Au film-coated FTO substrate for the CuAlO2 deposition. In the absence of hole scavengers, the H2 production with the Au-underlain CuAlO2 photoelectrode (Au/CuAlO2) is three-fold higher than that with bare CuAlO2, while the faradaic efficiencies at +0.3 and +0.55 VRHE are ∼100%. The time-resolved photoluminescence emission decay spectra of the CuAlO2 and Au/CuAlO2 confirm the facilitated charge transfer in the latter.
1. Introduction
The semiconductor-based solar production of carbon-neutral chemicals (e.g., H2 and formate from water and CO2, respectively) has been studied over the past four decades,1–4 but has recently received greater attention because of the increase in the concentration of atmospheric CO2 beyond 400 ppm. There are numerous semiconductors available, including oxides,5–9 chalcogenides,10–13 silicon,14–16 and III–V composites.3,17 However, they often suffer from low efficiency, a complicated synthetic process, the use of expensive components, non-scalability, and low durability. Cu(I)-based delafossite materials are unique in terms of their structure (CuIMIIIO2 type, where M = Fe,18–21 Rh,22 Al,23,24 Ga,25etc.); various bandgap (Eg) energies (1.2–3.0 eV); high conduction band (Ecb) level, which is sufficient for H2 production and CO2 reduction; and relative stability in aqueous solutions compared to other p-type III–V and II–VI materials.26,27 For example, electrodeposited p-CuFeO2 (Eg ∼ 1.36 eV) was shown to be capable of producing H2 in an aqueous alkaline solution,28 whereas intercalating Mg2+ or oxygen atoms into CuFeO2 enhanced the photoelectrochemical (PEC) performance.18 Furthermore, CuFeO2 coupled with CuO (Eg ∼ 1.4 eV) could produce formate from CO2 and water at a circumneutral pH with a ∼1% energy efficiency in the absence of any potential bias.29–31In comparison to CuFeO2, CuAlO2 has been given less attention despite their similar physicochemical properties. The typical synthetic route of CuAlO2 is annealing a Cu(I) and Al(III) salt mixture at high temperature (solid-solution process),23,26 which results in irregular, coarse particles of several micrometers.18,25 Although this method has some advantages (e.g., high yield), the as-synthesized particles are difficult to fabricate into durable films on transparent conducting oxide (TCO) substrates because of the absence of particle-to-particle interaction. Even if they are formed, the films have less intimate and looser interparticle connections undergoing a significant charge recombination at the solid/solid interface.18,23 This difficulty in synthesizing CuAlO2 films has caused this material to be less studied despite its potential as a promising photocathode.
With this in mind, we have, for the first time, attempted to synthesize CuAlO2 films on TCO substrates via electrochemical deposition (ED) under various experimental conditions (e.g., ED potentials, times, solution media, and annealing atmospheres). The as-synthesized CuAlO2 samples were characterized using various surface analysis tools (SEM, EDX, XRD, XPS, UV-vis, impedance, and time-resolved fluorescence spectrometry). They were then further evaluated in terms of their PEC hydrogen production in aqueous alkaline solutions under simulated sunlight (AM 1.5; 1 sun). The results of this evaluation showed that the hole transfer limited the overall PEC performance, and the use of sacrificial hole scavengers (electron donors) significantly improved the H2 production. To address this issue, thin Au layers (∼150 nm), as a hole conductor, were pre-deposited onto TCO substrates via an electron-beam evaporation system to facilitate the hole transfer of CuAlO2. In the absence of the hole scavengers, the H2 production with the Au-underlain CuAlO2 photoelectrode (Au/CuAlO2) was three-fold higher than that with bare CuAlO2, while the faradaic efficiencies were ∼100%.
2. Experimental
2.1. Synthesis of samples
Pieces of fluorine-doped SnO2 (F:SnO2, FTO)-coated glass (Pilkington Co, 1 cm × 3 cm) were ultrasonically cleaned in ethanol for 10 min, rinsed with deionized water (>18 MΩ cm, Barnstead), and dried in an N2 stream. For the electrochemical plating of Cu and Al, the as-prepared FTO (working electrode), saturated calomel electrode (SCE, reference electrode), and Pt wire (counter electrode) were immersed in a deionized water or dimethylsulfoxide (DMSO, >99%, Wako) solution containing Cu(NO3)2·3H2O (4 mM, >99%, Sigma Aldrich), Al(NO3)3·9H2O (20 mM, >98%, Sigma Aldrich), and KClO4 (50 mM, >99%, Sigma Aldrich). Then, the FTO substrates were held at constant potentials (−0.31 VSCE in water and −1.91 VSCE in DMSO) for 2 h using a potentiostat/galvanostat (CompactStat, Ivium) (Fig. S1†). After the deposition, the samples were dried, washed with deionized water, and placed in a tube furnace (Ajeon Heating Industrial Co., LTD) at room temperature in the presence of atmospheric air or Ar. The furnace temperature was increased to 700 °C at a rate of 2 °C min−1 and held at 700 °C for 1 h. If necessary, Au-layered FTO (FTO/Au) was used for the deposition of CuAlO2. For this, FTO substrates were coated with a 150 nm-thick Au layer using an electron-beam evaporation system (Dada Korea) with a metallic Au evaporation slug (99.999%) in a reactor chamber at a pressure of 2 × 10⁻⁵ Torr. The growth rate of the Au layer was estimated to be ∼0.05 nm s−1.322.2. Photoelectrochemical measurements and product analysis
The as-synthesized samples (working electrodes) were immersed in aqueous potassium hydroxide (1 M KOH at pH ∼13.5, Sigma Aldrich) pre-purged with N2 for over 1 h in an airtight single (undivided) glass cell with an SCE (reference electrode) and a platinum wire (counter electrode). Light-chopped linear sweep voltammograms were obtained via a potential sweep from +0.3 to −0.9 VSCE at a scan rate of 5 mV s−1 under simulated solar light (100 mW cm−2) from a 150 W xenon arc lamp (ABET Technology) equipped with an air mass (AM) 1.5G filter. The light intensity was weekly re-calibrated to be 1 sun (100 mW cm−2) using a standard mono-Si solar cell (K801S-K009, McScience Inc.), as described elsewhere.33 For the PEC H2 production, constant potentials (−0.75 VSCE and −0.5 VSCE) were applied to the samples under irradiation. The potentials of the reference electrode (SCE) were converted to those of a reversible hydrogen electrode (RHE) using the following relationship:| VRHE = VSCE + 0.241 + 0.059 × pH |
Unless otherwise specified, the RHE was omitted for simplicity. The incident photon-to-current efficiency (IPCE) was estimated using a CS130 monochromator (Mmac-200, Spectro) with a 300 W Xe arc lamp using the following equation:
For quantification of molecular hydrogen (H2) evolved, varying volumes (10–250 μL) of a standard H2 gas (99.999%) with Ar carrier gas were flowed through a 5 Å molecular sieve column equipped in a gas chromatograph (GC, YoungLin, ACME-6100) with a thermal conductivity detector (TCD) (detection limit of H2 ∼ 0.01%), and a standard curve fit between the standard gas concentration and the corresponding spectral area was obtained. The faradaic efficiencies for H2 under constant potentials were estimated using the following equation:
2.3. Surface characterization
The surface morphologies and side views of the samples were analyzed using a field-emission SEM (FE-SEM, Hitachi S4800) equipped with an energy-dispersive X-ray (EDX) detector. The UV-vis diffuse reflectance absorption spectra of the powders collected from the sample films were obtained using a UV-vis spectrophotometer (UV-2450, Shimadzu), with BaSO4 as a ref. 29. The obtained reflectance (R) was then converted into absorbance via the Kubelka–Munk function ((1 − R)2/2R).34 X-ray diffraction (XRD) measurements were performed to examine the crystalline structures of the samples with a Philips X-pert powder diffractometer (PW3040/00) in a Bragg–Brentano geometry under Cu Kα radiation. X-ray photoelectron spectroscopy (XPS) and Auger spectroscopy (Cu LMM; XPS, ULVAC-PHI) analyses were performed on a PHI 5500 model spectrometer equipped with an Al Kα monochromator X-ray source at 20 kV, a hemispherical electron energy analyzer, and a multichannel detector. The time-resolved photoluminescence (TRPL) lifetimes were measured using a confocal microscope (MicroTime-200, Picoquant, Germany) with a 20× objective. The measurements were performed at the Korea Basic Science Institute (KBSI), Daegu Center, South Korea. A single-mode pulsed diode laser (379 nm with a pulse width of ∼30 ps and a laser power of ∼30 μW) was used as the excitation source. A dichroic mirror (Z375RDC, AHF), a long pass filter (HQ405lp, AHF), a 75 μm pinhole, a band-pass filter, and an avalanche photodiode detector (PDM series, MPD) were used to collect emissions from the samples. The details of the measurements and data analysis can be found elsewhere.9,29,31,353. Results and discussion
3.1. Electrochemical synthesis and characterization of CuAlO2
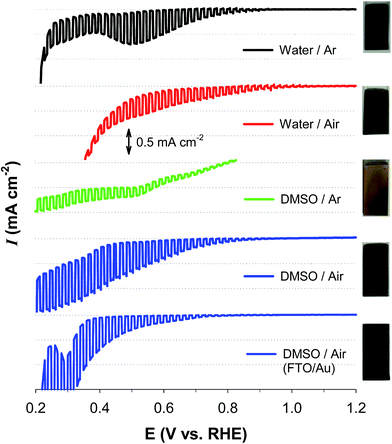
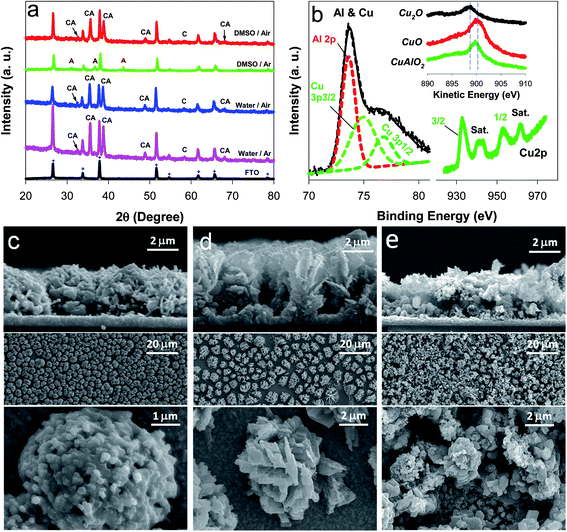
Fig. 1 compares the light-chopped linear sweep voltammograms (LSVs) of samples that were electrochemically synthesized under diverse conditions. The sample deposited in the water solvent and annealed in an Ar atmosphere (water/Ar) showed a photocurrent onset potential (Eon) of ∼0.9 V and a significant dark current of E ∼0.45 V. In addition, there was a cathodic peak at ∼0.5 V, which was attributed to the reductions of Cu(I) and/or Cu(II) (E°(Cu2+/Cu+) = +0.153 V; E°(Cu+/Cu0) = +0.521 V). On the other hand, the sample deposited in water and annealed in an air atmosphere (water/air) exhibited a more anodic Eon (∼1.0 V) and yet large dark currents. The sample deposited in DMSO and annealed under Ar (DMSO/Ar) was poor at generating a photocurrent and suffered from a significant dark current. In contrast, the sample annealed in an air atmosphere (DMSO/air) displayed an Eon of ∼0.9 V and a high photocurrent. Furthermore, a dark current started from E ∼0.42 V, indicating that the sample is more durable than the other samples. The DMSO/Ar sample was yellowish, whereas the other samples were blackish. This suggests that the latter three samples possess similar compositions and/or crystalline structures.The XRD patterns of the as-synthesized samples were further examined to gain knowledge about the crystalline structures (Fig. 2a). Most of the XRD peaks in the water/Ar sample were indexed to CuAlO2 (e.g., 006, 101, 012, 009, 018, and 112 planes at 2θ = 32.5°, 35.7°, 38.8°, 48.9°, 57.1°, and 68.1°, respectively; JCPDS no. 73-9485), whereas there was a peak indexed to CuO (220) at 2θ = 58.4°. The water/air sample exhibited the same XRD pattern. In the DMSO/air sample, CuAlO2 peaks were predominant, whereas the intensity of CuO (220) was significantly reduced. It should be noted that the Cu(I) in the Cu-based delafossites (CuIMIIIO2) is readily oxidized to Cu(II) in the synthesis process and/or a partial oxidation of CuAlO2 in air, leading to oxygen-enriched oxides.23,29,31 The presence of the mixed valence state of Cu(I) and Cu(II) usually increases the charge transfer.19,31,36,37 In contrast to these samples, the DMSO/Ar sample did not exhibit CuAlO2 peaks, whereas only Al2O3-associated peaks (e.g., 111, 110, and 113 planes at 2θ = 31.1°, 36.7°, and 43.6°, respectively; JCPDS no. 75-0277) were found. This remarkable difference from the other samples was further confirmed by the yellowish color of the DMSO/Ar sample (Fig. 1).
Based on this knowledge, CuAlO2 (i.e., the DMSO/air sample) was further analyzed using the XPS (Fig. 2b). The sample showed mixed bands at binding energies of 72 and 80 eV, the deconvolution of which indicated the co-presence of Al2p (73.6 eV) and Cu3p (74.9 and ∼76.8 eV) at an atomic ratio of 1![[thin space (1/6-em)]](https://www.rsc.org/images/entities/char_2009.gif) :
:![[thin space (1/6-em)]](https://www.rsc.org/images/entities/char_2009.gif) 1. The EDX analysis of the sample confirmed the similar composition ratio (Fig. S2†). In addition, the XPS O1s band could be resolved into a single oxygen atom coordinated to Cu(I) at 529.6 eV and two oxygen atoms coordinated to Al(III) (one from the AlO6 edge-sharing octahedral layer at 530.8 eV and the other from a surface hydroxide or hydrated species at 531.9 eV) (Fig. S3†). Two satellite peaks in the Cu2p spectrum further suggested the existence of Cu(II) (Fig. 2b),33 which was consistent with the results of the XRD analysis. The presence of Cu(II) was further confirmed by the XPS spectra of the Cu LMM Auger transition (Fig. 2b inset). The as-synthesized CuAlO2 sample exhibited a kinetic energy peak at ∼899.7 eV, which was located between those of Cu2O (∼898.8 eV) and CuO (∼900.3 eV). The as-synthesized CuAlO2 samples (i.e., water/Ar, water/air, and DMSO/air) exhibited ∼7 μm-thick porous particulate films composed of flower-like three-dimensional aggregates (Fig. 2c–e). This morphology is quite similar to those of electrochemically synthesized Cu-based oxide films (CuFeO2, CuO, Cu2O, etc.),29–31 throughout which the component elements are uniformly distributed.29,31 The elemental mapping of the CuAlO2 confirmed the uniform distribution of Cu and Al horizontally and vertically in the sample (Fig. S4†).
1. The EDX analysis of the sample confirmed the similar composition ratio (Fig. S2†). In addition, the XPS O1s band could be resolved into a single oxygen atom coordinated to Cu(I) at 529.6 eV and two oxygen atoms coordinated to Al(III) (one from the AlO6 edge-sharing octahedral layer at 530.8 eV and the other from a surface hydroxide or hydrated species at 531.9 eV) (Fig. S3†). Two satellite peaks in the Cu2p spectrum further suggested the existence of Cu(II) (Fig. 2b),33 which was consistent with the results of the XRD analysis. The presence of Cu(II) was further confirmed by the XPS spectra of the Cu LMM Auger transition (Fig. 2b inset). The as-synthesized CuAlO2 sample exhibited a kinetic energy peak at ∼899.7 eV, which was located between those of Cu2O (∼898.8 eV) and CuO (∼900.3 eV). The as-synthesized CuAlO2 samples (i.e., water/Ar, water/air, and DMSO/air) exhibited ∼7 μm-thick porous particulate films composed of flower-like three-dimensional aggregates (Fig. 2c–e). This morphology is quite similar to those of electrochemically synthesized Cu-based oxide films (CuFeO2, CuO, Cu2O, etc.),29–31 throughout which the component elements are uniformly distributed.29,31 The elemental mapping of the CuAlO2 confirmed the uniform distribution of Cu and Al horizontally and vertically in the sample (Fig. S4†).
3.2. Use of CuAlO2 for photoelectrochemical H2 production
The PEC hydrogen evolution with CuAlO2 (i.e., DMSO/air sample) was systematically examined in an alkaline electrolyte (1 M KOH) with sulfide and/or sulfite (0.1 M Na2S, 0.1 M Na2SO3, and their mixed solution) as the sacrificial hole scavenger (Fig. 3a). It should be noted that sulfide and sulfite are typical products in the flue gas desulfurization processes of smelters and coal-fired power plants.38 The overall shapes of the LSVs of the sulfide and sulfide/sulfite solutions were similar, with an Eon of ∼0.85 V and a cathodic peak at ∼0.45 V. When sulfite alone was present, a large dark current flowed at E < ∼0.7 V, whereas no cathodic peak was found. This suggests that the cathodic peak of CuAlO2 could be attributed to sulfide, which has a higher reducing power (E°(S/S2−) = −0.476 V) than sulfite (E°(S2O62−/H2SO3) = 0.564 V). Despite the cathodic peak of the mixed solution, the dark current was inhibited down to an E value of ∼0.37 V, which was 0.1 V more negative than that in water (Fig. 1dvs.Fig. 3a). In the absence of the hole scavengers, the application of a potential at +0.55 V did not produce H2 for 3 h despite a photocurrent flow. We could observe measurable amounts of H2 (∼2.5 μmol for 3 h) only at E ≤ +0.3 V (Fig. 3b). A photocurrent of ∼0.1 mA cm−2 was generated during the same period (Fig. S5†), leading to a Faraday efficiency of ∼70% for H2 production (Fig. 3c). In the presence of sulfite alone, the H2 production and Faraday efficiency were enhanced yet insignificantly (∼5 μmol for 3 h and ∼80%, respectively). However, the addition of sulfide to the water and sulfite solutions markedly enhanced the H2 production by ∼7 and ∼4 times, with Faraday efficiencies of ∼90 and ∼100%, respectively. Compared to sulfide alone, the higher efficiency of the sulfite/sulfide mixture was attributed to the regeneration of hole-oxidized sulfide (e.g., S22−) by sulfite.10–12,39 The Faraday efficiency of ∼100% with bare CuAlO2 in the mixed solution reveals that electron injection at the p-type material/water interface was highly efficient, whereas the internal hole transfer limited the overall charge transfer (see below). For comparison, the PEC activities of the other samples (DMSO/Ar, water/Ar, and water/air) were examined in the mixed solution (Fig. S6†). The DMSO/Ar sample produced neither photocurrents nor H2 at +0.3 V because of the predominant structure of Al2O3 (Fig. 2a). The other two samples with the crystalline structure of CuAlO2 exhibited the PEC activity; however, their H2 production values were less than 5% of the production with the DMSO/air sample, and their faradaic efficiencies were less than 20%.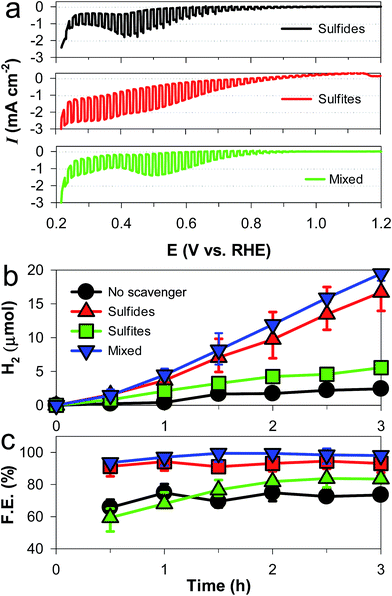 | ||
| Fig. 3 Effects of hole scavengers (sulfide and/or sulfite, each 0.5 M) on the photoelectrochemical performance of CuAlO2 electrodes in aqueous KOH solution (1 M) purged with N2: (a) light-chopped LSVs, (b) H2 production at +0.3 VRHE, and (c) faradaic efficiencies (F. E.) for H2 production at +0.3 VRHE. “No scavenger” refers to 1 M KOH. See Fig. S5† for the photocurrent changes during the H2 production tests. | ||
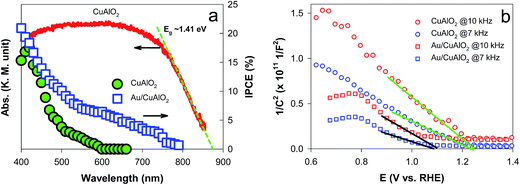
The energetics of the as-synthesized CuAlO2 (i.e., DMSO/air samples) were examined in detail. The UV-vis diffuse reflectance absorption spectrum of the CuAlO2 particles (collected from the films) showed a broadband light absorption in the wavelength range of 400–900 nm, and the bandgap (Eg) was estimated to be ∼1.4 eV (corresponding to a λ value of ∼885 nm; see Fig. 4a). This Eg value was attributed to the indirectly allowed transition of CuAlO2 (1.2–1.7 eV),23,40,41 whereas the directly allowed transition usually leads to large Eg values of 3–3.5 eV.24,27 The indirect transition-induced photogeneration of charge carriers was confirmed by the IPCE profiles (Fig. 4a). The IPCE value at λ = 400 nm was estimated to be ∼15% (E = +0.3 V; see Fig. 1 for the photocurrent profile), which was not only far greater than the value reported in the literature (∼0% at λ > 400 nm) for CuAlO2 synthesized via a sol–gel process24 but also >2-fold greater than those of other copper-based delafossites (e.g., CuFeO2 at E = +0.15 V) synthesized via the electrodeposition method.29 In addition, the IPCE values decreased with increasing wavelength, with a wavelength onset of ∼610 nm. A Mott–Schottky analysis of the as-synthesized CuAlO2 film was performed at two frequencies (7 and 10 kHz) to estimate the flat band potential (Efb) according to the following equation:42
However, even though the energetics appeared to be suitable for PEC H2 production, the as-synthesized CuAlO2 generated a relatively small photocurrent density of ∼0.1 mA cm−2 at 0.3 V in the absence of a hole scavenger (Fig. S5†). The addition of the hole scavenger enhanced the photocurrent density to ∼0.6 mA cm−2 and the faradaic efficiency to ∼100% (Fig. 3c), indicating that the hole transfer was limited. The hole transfer limit was straightforwardly examined by comparing the LSVs of the CuAlO2 irradiated through the FTO substrate and electrolyte (Fig. S7†). Compared to the substrate-side irradiation, the electrolyte-side irradiation led to significantly reduced photocurrents, even though the light intensity arriving at CuAlO2 in the substrate side-irradiation was ∼80% of the reference light (AM 1.5G; 100 mW cm−2) owing to the semi-transparent FTO (Fig. S8†).33 Assuming the light penetration depth is the same between the two irradiation directions, the photogenerated holes and electrons under the electrolyte and substrate-side irradiations, respectively, must travel further than their counter charge carriers. Therefore, the reduced photocurrent in the electrolyte-side irradiation reveals that the hole transfer is limited compared to the electron transfer.
3.3. Facilitating hole transfer
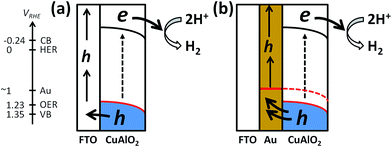
To facilitate the hole transfer in water without hole scavengers, a 150 nm-thick Au film was overlaid onto FTO substrates via an electron-beam process, onto which CuAlO2 was electrodeposited. The work function (Wf) of Au is 5.31–5.47 eV,44 depending on the surface orientation, which can be estimated to be ∼0.3 V more negative than the CuAlO2 VB level (Scheme 1b). Accordingly, the Fermi level (EF) equilibration between the Wf of Au and the EF of CuAlO2 causes an enhanced upward band-bending, leading to efficient hole transfer while inhibiting the electron–hole charge recombination. A comparison between the LSVs of the CuAlO2 samples deposited on bare FTO and FTO/Au (denoted Au/CuAlO2) showed that the Eon of the latter was ∼0.1 V more negative than that of the former (Fig. 1) because of the upward shift in the EF of the latter (Scheme 1b). In addition, the presence of the Au underlayer significantly inhibited the dark currents to E ∼0.4 V (Fig. 1), while enhancing the photocurrents (Fig. S9†). The latter was further confirmed by the IPCE profile of Au/CuAlO2, particularly in the range of λ > ∼450 nm (Fig. 4a). In contrast to the pristine sample, Au/CuAlO2 exhibited an IPCE value of ∼10% at λ = 500 nm and IPCE onset at λ = ∼800 nm. These enhanced PEC properties could be attributed to the altered energetics produced by the Au underlayer. The Mott–Schottky plot of Au/CuAlO2 showed an Efb of ∼1.1 V, which was approximately 0.15 V more negative than the Efb of CuAlO2 (Fig. 4b). Although slightly smaller than the estimated value of ∼0.3 V, this shift qualitatively explains the enhanced upward band-bending.Fig. 5a shows the PEC H2 production values using Au/CuAlO2 films at 0.3 and 0.55 V in an aqueous KOH solution (1 M) without the sulfide/sulfite hole scavengers. The H2 production rate at 0.3 V was ∼2.5 μmol h−1, three-fold higher than the case of CuAlO2 (Fig. 3b). The similar amounts of H2 on the pristine CuAlO2 at 0.3 V and Au/CuAlO2 at 0.55 V (Fig. 3bvs.5a) indicate that the deposition of the Au underlayer can save 0.25 V. Furthermore, the Au layer enhanced the photocurrent (Fig. S9†), while the faradaic efficiencies were similar (∼100%) in these cases (CuAlO2@0.3 V vs. Au/CuAlO2@0.55 V) (Fig. 5b). Accordingly, it is obvious that the Au layer insignificantly influenced the electron injection at the CuAlO2/water interface, while substantially enhancing the charge separation and transfer.
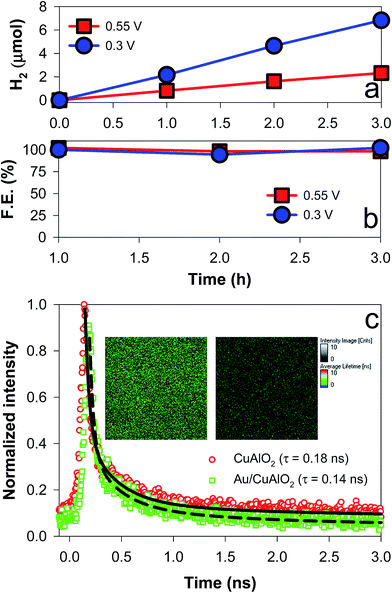 | ||
| Fig. 5 (a) PEC H2 production and (b) faradaic efficiencies using Au/CuAlO2 electrodes at +0.3 VRHE and +0.55 VRHE in aqueous KOH solutions (1 M) purged with N2. See Fig. S9† for the time-profiled changes in the photocurrents. (c) Time-resolved photoluminescence emission (500–700 nm) decay spectra of CuAlO2 and Au/CuAlO2. The average lifetime (τ) is also shown. The inset shows the 2D luminescence intensity and lifetime images of the samples. See Fig. S10–S12† for more information on the emission spectrum. | ||
To examine the charge transfer kinetics and pathways, the time-resolved photoluminescence (TRPL) emission decay spectra of CuAlO2 and Au/CuAlO2 samples were compared (Fig. 5c). Prior to the TRPL analysis, the PL emissions of CuAlO2 and Au/CuAlO2 were examined in the range of λ > ∼370 nm (Fig. S10†). There were no specific emission bands, except for a band at ∼470 nm. This band is usually found in other oxides and metals, and it could be attributed to the substrate and/or impurities. Accordingly, the samples were excited at λ = 379 nm, and the long wavelength emission (green emission of 500–700 nm) spectra were primarily compared (see Fig. S11† for the blue emission of 400–500 nm). Upon excitation, the emission intensities of both samples decayed exponentially on a nanosecond time scale, and the average decay time (τ) was estimated by fitting with exponential components (Fig. S11†). As a result, the τ of CuAlO2 was found to be ∼0.18 ns, which decreased to ∼0.14 ns with the Au underlayer (Fig. 5c). When the instrument response was subtracted from the decay profiles, the τ values of CuAlO2 and Au/CuAlO2 were estimated to be 1.706 and 1.513 ns, respectively (Fig. S12†). This decrease in τ should have resulted from the charge transfer facilitated by the Au layer, leading to a reduction in the charge recombination. The emission intensity images in the inset of Fig. 5c further confirm the reduced charge recombination on the Au/CuAlO2 film.
4. Conclusions
We demonstrated that a CuAlO2 electrode could be readily synthesized via an electrodeposition process, and further attempted to enhance the PEC performance of the as-synthesized materials for H2 production. Whereas CuAlO2 displayed a similar morphology irrespective of the synthetic conditions (solvent and annealing atmosphere), the electroplating solvent significantly affected the surface properties, crystalline structure, and PEC performance of CuAlO2. In an alkaline solution, the optimized CuAlO2 samples showed an Eon value of ∼0.9 V and H2 production with a faradaic efficiency of ∼70% at 0.3 V. The addition of hole-scavengers (sulfide and sulfite) to the solution significantly improved the PEC H2 production by a factor of 8, and led to a faradaic efficiency of ∼100%. This strongly suggested that the hole transfer limits the overall PEC performance, which was confirmed by a comparison of the irradiation directions. To facilitate the hole transfer, CuAlO2 was synthesized on an FTO substrate with a thin Au layer. In the absence of the hole scavengers, the H2 production with Au/CuAlO2 was three-fold that with CuAlO2, while the faradaic efficiencies at 0.3 and 0.55 V were ∼100%. The TRPL emission decay spectra of CuAlO2 and Au/CuAlO2 samples confirmed the facilitated charge transfer in the latter.Acknowledgements
This research was supported by the Global Research Network Program (2014S1A2A2027802) and the Basic Science Research Program (2016R1A2B4007366), Korea. In addition, we are grateful to the Korea CCS R&D Center (KCRC) (No. 2014M1A8A1049354) for financial support. This publication was made possible by a grant from the Qatar National Research Fund under its National Priorities Research Program (NPRP 9-052-2-020).References
- H.-J. Lewerenz and L. Peter, Photoelectrochemical Water Splitting: Materials, Processes and Architectures, The Royal Society of Chemistry, Cambridge, 2013 Search PubMed.
- K. Maeda and K. Domen, J. Phys. Chem. Lett., 2010, 1, 2655–2661 CrossRef CAS.
- F. E. Osterloh, Chem. Soc. Rev., 2013, 42, 2294–2320 RSC.
- H. Park, H.-i. Kim, G.-h. Moon and W. Choi, Energy Environ. Sci., 2016, 9, 411–433 CAS.
- J. K. Kim, G. Shin, S. M. Cho, T.-W. Lee and J. H. Park, Energy Environ. Sci., 2011, 4, 1465–1470 CAS.
- S. K. Choi, S. Kim, S. K. Lim and H. Park, J. Phys. Chem. A, 2010, 114, 16475–16480 CrossRef CAS PubMed.
- S. K. Choi, W. Choi and H. Park, Phys. Chem. Chem. Phys., 2013, 15, 6499–6507 RSC.
- H. W. Jeong, S. Y. Choi, S. H. Hong, S. K. Lim, D. S. Han, A. Abdel-Wahab and H. Park, J. Phys. Chem. C, 2014, 118, 21331–21338 CAS.
- H. W. Jeong, W.-S. Chae, B. Song, C.-H. Cho, S.-H. Baek, Y. Park and H. Park, Energy Environ. Sci., 2016, 9, 3143–3150 CAS.
- Y. K. Kim and H. Park, Energy Environ. Sci., 2011, 4, 685–694 CAS.
- H. Park, Y. K. Kim and W. Choi, J. Phys. Chem. C, 2011, 115, 6141–6148 CAS.
- Y. K. Kim and H. Park, Appl. Catal., B, 2012, 125, 530–537 CrossRef CAS.
- H. Park, H. H. Ou, A. J. Colussi and M. R. Hoffmann, J. Phys. Chem. A, 2015, 119, 4658–4666 CrossRef CAS PubMed.
- S. K. Choi, U. Kang, S. Lee, D. J. Ham, S. M. Ji and H. Park, Adv. Energy Mater., 2014, 4, 1301614 CrossRef.
- S. K. Choi, W.-S. Chae, B. Song, C.-H. Choi, J. Choi, D. S. Han, W. Choi and H. Park, J. Mater. Chem. A, 2016, 4, 14008–14016 Search PubMed.
- K. Sun, X. Pang, S. Shen, X. Qian, J. S. Cheung and D. Wang, Nano Lett., 2013, 13, 2064–2072 CrossRef CAS PubMed.
- O. Khaselev and J. A. Turner, Science, 1999, 280, 425–427 CrossRef.
- J. Gu, A. Wutting, J. W. Krizan, Y. Hu, Z. M. Detweiler, R. J. Cava and A. B. Bocarsly, J. Phys. Chem. C, 2013, 117, 12415–12422 CAS.
- Y. J. Jang, Y. B. Park, H. E. Kim, Y. H. Choi, S. H. Choi and J. S. Lee, Chem. Mater., 2016, 28, 6054–6061 CrossRef CAS.
- M. S. Prévot, N. Guijarro and K. Sivula, ChemSusChem, 2015, 8, 1359–1367 CrossRef PubMed.
- O. Yehezkeli, N. M. Bedford, E. Park, K. Ma and J. N. Cha, ChemSusChem, 2016, 9, 1–9 CrossRef PubMed.
- J. Gu, Y. Yan, J. W. Krizan, Q. D. Gibson, Z. M. Detweiler, R. J. Cava and A. B. Bocarsly, J. Am. Chem. Soc., 2014, 136, 830–833 CrossRef CAS PubMed.
- N. Koriche, A. Bouguelia, A. Aider and M. Trari, Int. J. Hydrogen Energy, 2005, 30, 693–699 CrossRef CAS.
- M. S. Prévot, Y. Li, N. Guijarro and K. Sivula, J. Mater. Chem. A, 2016, 4, 3018–3026 Search PubMed.
- K. Gurunathan, J.-O. Baeg, S. M. Lee, E. Subramanian, S.-J. Moon and K.-J. Kong, Catal. Commun., 2008, 9, 395–402 CrossRef CAS.
- A. P. Amrute, Z. Lodziana, C. Mondelli, F. Krumeich and J. Perez-Ramirez, Chem. Mater., 2013, 25, 4423–4435 CrossRef CAS.
- I. Sullivan, B. Zoellner and P. A. Maggard, Chem. Mater., 2016, 28, 5999–6016 CrossRef CAS.
- C. G. Read, Y. Park and K.-S. Choi, J. Phys. Chem. Lett., 2012, 3, 1872–1876 CrossRef CAS PubMed.
- U. Kang, S. K. Choi, D. J. Ham, S. M. Ji, W. Choi, D. S. Han, A. Abdel-Wahabe and H. Park, Energy Environ. Sci., 2015, 8, 2638–2643 CAS.
- S. Lee, U. Kang, G. Piao, S. Kim, D. S. Han and H. Park, Appl. Catal., B, 2017, 207, 35–41 CrossRef CAS.
- U. Kang and H. Park, J. Mater. Chem. A, 2017, 5, 2123–2131 CAS.
- H. J. Kim, Y.-S. Sohn, C.-d. Kim and D.-h. Jang, J. Korean Phys. Soc., 2016, 69, 793–797 CrossRef CAS.
- N. C. Deb Nath, S. Y. Choi, H. W. Jeong, J.-J. Lee and H. Park, Nano Energy, 2016, 25, 51–59 CrossRef CAS.
- H. Park, H.-H. Ou, U. Kang, J. Choi and M. R. Hoffmann, Catal. Today, 2016, 266, 153–159 CrossRef CAS.
- S.-H. Hwang, Y. K. Kim, S. H. Yoon, S. K. Lim and H. Park, RSC Adv., 2016, 8, 85521–85528 RSC.
- P. Wang, Y. H. Ng and R. Amal, Nanoscale, 2013, 5, 2952–2958 RSC.
- Y. Yang, D. Xu, Q. Wu and P. Diao, Sci. Rep., 2016, 6, 35158 CrossRef CAS PubMed.
- N. de Nevers, Air Pollution Control Engineering, McGraw-Hill, New York, 1995 Search PubMed.
- H. Park, W. Choi and M. R. Hoffmann, J. Mater. Chem., 2008, 18, 2379–2385 RSC.
- R. Brahimi, M. Trari, A. Bouguelia and Y. Bessekhouad, J. Solid State Electrochem., 2010, 14, 1333–1338 CrossRef CAS.
- N. Benreguia, S. Omeiri, B. Bellal and M. Trari, J. Hazard. Mater., 2011, 192, 1395–1400 CrossRef CAS PubMed.
- T. H. Jeon, A. D. Bokare, D. S. Han, A. Abdel-Wahab, H. Park and W. Choi, Appl. Catal., B, 2017, 201, 591–599 CrossRef CAS.
- S. R. Morrison, Electrochemistry at Semiconductor and Oxidized Metal Electrodes, Springer, New York, 1980 Search PubMed.
- D. R. Lide, CRC Handbook of Chemistry and Physics, CRC Press, New York, 90 edn, 2009 Search PubMed.
Footnote |
| † Electronic supplementary information (ESI) available: Fig. S1–S12. See DOI: 10.1039/c7ta01919j |
| This journal is © The Royal Society of Chemistry 2017 |


