 Open Access Article
Bifunctional 2D-on-2D MoO3 nanobelt/Ni(OH)2 nanosheets for supercapacitor-driven electrochromic energy storage†
Liangliang
Zhu
a,
Connor Kang
Nuo Peh
a,
Ting
Zhu
a,
Yee-Fun
Lim
 b and
Ghim Wei
Ho
 *abc
*abc
aDepartment of Electrical and Computer Engineering, National University of Singapore, 4 Engineering Drive 3, Singapore 117583. E-mail: elehgw@nus.edu.sg
bInstitute of Materials Research and Engineering, A*STAR (Agency for Science, Technology and Research), 3 Research Link, Singapore 117602
cEngineering Science Programme, National University of Singapore, 9 Engineering Drive 1, Singapore 117575
First published on 4th April 2017
Abstract
A hybrid composite that unifies multiple structural attributes is the key for improved functional device performance. Moreover, hierarchical and porous assembly of dissimilar constituent elements at various length scales and dimensionality is highly appropriate for mass transfer and surface/interfacial-dominated reactions. Here, we demonstrate solution processed 2D-on-2D hierarchical architecture of nanobelt core–nanosheets shell consisting of dissimilar transition metal composite. The defining benefits of such hetero-structured material design are short ion diffusion pathway of a thin 2D nanobelt core that is interfaced to large surface area and porous 2D nanosheets. Accordingly, an integrated energy system that delivers multiple functionalities, i.e. supercapacitive charge storage and electrochromic optical modulation, is investigated due to its attractive complementary energy storage and energy conservation capabilities. Consequently, bifunctional electrochromism–supercapacitive properties are demonstrated where desirable optical transmittance modulation and coloration efficiency properties in parallel with favorable pseudocapacitive storage and specific capacitance properties are simultaneously realized. Such an integrated energy system is anticipated to have a broad range of smart applications in buildings, automobiles and other emerging electronics needs.
Introduction
Design of nanomaterial of dissimilar composition and structure presents potential synergistic effects between different material constituents and dimensionality for improved device performance.1–5 Moreover, rational hierarchical and porous structural design can lead to superior physicochemical properties beneficial for various mass transfer and surface/interfacial-dominated reactions.6–8 On the contrary, aggregated and non-porous materials generally grant limited accessibility to the surface owing to restricted contact of only the outermost material with reactants. Besides, it is well known that a 2D nanostructure which is largely made up of surface atoms with highly exposed surfaces is the ideal morphological basis for surface/interfacial-dependent electrochemical reactions.9,10 2D nanostructures, in particular transition metal oxides and hydroxides, are well suited for electrochemical studies since most of them possess not only multiple oxidation states but also layered crystal structures that favor reversible intercalation reactions.11–13Electrochemical-based phenomena, i.e. supercapacitive charge storage and electrochromic optical modulation, have garnered immense attention due to their corresponding attractive energy storage and energy conservation capabilities.14,15 In prior works, electrochromic materials were mostly studied with external powering batteries without considering deployment or reutilization of the energy stored in these electrochromic materials for useful purposes.16,17 However, with increasing interest in integrated energy systems that can deliver multiple functionalities, it is appealing to adopt electrochromism and supercapacitive capabilities into an integrated system. The associated mechanisms are highly compatible in operation since some of the electrochemically active materials exhibit charge insertion/extraction or chemical reduction/oxidation processes that are accompanied by reversible change of colors.18,19 Despite rapid advancement in the independent research on supercapacitor and electrochromic nanomaterials, there is limited work on completely solution-processed 2D hetero-structured transition metal materials with hierarchical porous architecture that exhibit complementary capacitive storage and chromogenic capabilities. Presumably the challenges lie in the difficulties in controlling different growth mechanisms and in regulating growth dynamics of disparate material systems into an appropriate design framework.
Herein, we synthesize a 2D-on-2D hierarchical architecture of nanobelt core–nanosheets shell of disparate transition metal composite based completely on the solution processing method. The growth of 2D Ni(OH)2 nanosheets on free-standing 2D MoO3 nanobelts manifests in a 3D hierarchical architecture of numerous nanosheets that extend radially outward. The defining advantages of such hetero-structured material design are short ion diffusion pathway of the 2D thin nanobelt core that interfaces with large surface area and interconnected porous 2D nanosheets.20 Accordingly, bifunctional electrochromism–supercapacitive application is demonstrated based on the inexpensive electrochemical active transition metal hydroxide/oxide hierarchical structure. The porous core–shell nanostructures of Ni(OH)2/MoO3 display desirable electrochromic optical modulation and coloration efficiency properties alongside favorable pseudocapacitive storage and specific capacitance properties. The high rate capacity for complementary energy storage and optical modulation capabilities can be attributed to the beneficial structural features of the hybrid metal oxide–metal hydroxide composition and nanobelt backbone core that supports large surface area electrochemically active nanosheets. To this end, bifunctional electrochromic and supercapacitive materials are anticipated to have a broad range of energy applications in smart windows, displays, automobiles and various intelligent electronics.
Experimental section
Synthesis of single crystal MoO3 nanobelts
In a typical procedure, a certain amount of sodium molybdate (Na2MoO4·2H2O) was dissolved into 25 ml deionized water to form a 0.1 mol L−1 solution. The pH of the Na2MoO4·2H2O solution was adjusted to be 1.5 using hydrochloric acid (HCl, 37–38 wt%). After that, the solution was transferred into a 50 ml Teflon-lined stainless steel autoclave and was heated at 180 °C for 10 hours. After hydrothermal treatment, the autoclave was cooled down to room temperature. Subsequently, the precipitates were separated and washed with deionized water by centrifugation 3 times. Finally, the products were dried in vacuum at 60 °C for 2 hours.Synthesis of MoO3/Ni(OH)2
5 mg as-prepared MoO3 nanobelts were dispersed in 30 ml absolute ethanol. After sonication for a few minutes, 0.0727 g nickel nitrate hexahydrate (Ni(NO3)2·6H2O) and 0.28 g hexamethylenetetramine were added to the suspension. The hydrothermal treatment was subsequently conducted at 120 °C for 4 hours. After the reactions, the products were washed with ethanol and dried at 55 °C.Characterizations
Crystallographic information about the fabricated products was obtained using X-ray diffraction (XRD, Bruker D5005 X-ray diffractometer with Cu Kα radiation at λ = 1.541 Å). Morphology and structural characteristics were studied using field-emission scanning electron microscopy (SEM, JEOL FEG JSM 7001F). The elements were analyzed by energy-dispersive X-ray spectroscopy (EDX, Oxford Instruments). The crystal structure of the composite was investigated by using transmission electron microscopy (TEM, Philips FEG CM300) at 200 kV, and X-ray photoelectron spectroscopy (XPS, VG Thermo Escalab 220I-XL). Fourier transform infrared (FT-IR) spectra were recorded with a Shimadzu IR Prestige-21 FT-IR spectrophotometer. Brunauer–Emmett–Teller (Quantachrome Nova 2200) measurements were conducted with nitrogen (N2) as the adsorbate at liquid nitrogen temperature.Electrochemical measurements
The working electrodes were prepared by mixing 70 wt% of electroactive material (MoO3/Ni(OH)2 and pure Ni(OH)2 nanosheets), 20 wt% of carbon black, and 10 wt% of polyvinylidene difluoride (Aldrich). The slurry was then pressed onto Ni metal foams, and dried thoroughly at 55 °C. The electrolyte used was a 3 M potassium hydroxide (KOH) aqueous solution. The electrochemical performances including CV, GCCD and EIS (frequency ranging from 0.01 to 100 kHz with 5 mV amplitude) of the individual electrodes were evaluated with a CHI660e electrochemical workstation using cyclic voltammetry and chronopotentiometry tests with a three-electrode cell where Pt foil served as the counter electrode and a standard calomel electrode (SCE) as the reference electrode.Assembly of MoO3/Ni(OH)2 asymmetrical supercapacitors
Asymmetrical supercapacitor full cells (5 cm × 4 cm) were assembled using two pieces of nickel foam loaded with MoO3/Ni(OH)2 and carbon nanotubes (CNTs), respectively. The two electrodes were packed with Al foil using an electrolyte-soaked (3 M KOH) separator in between. The mass of the active materials in the two electrodes was calculated beforehand based on the charge balance to maximize the energy density of the cells.Electrochromic measurements
The MoO3/Ni(OH)2 composite was dispersed in glycol and spin-coated onto fluorine-doped tin oxide (FTO) glass. The coated FTO glass was then dried at 55 °C for 3 h. The sample (working electrode) was placed in 1 M KOH electrolyte solution and a Pt foil was used as the counter electrode. A forward voltage bias was applied to induce a color change in the MoO3/Ni(OH)2 coating and a reverse bias was applied to bleach the electrochromic layer. The absorption and transmittance spectra of the samples were measured with a UV-VIS-NIR spectrophotometer (Shimadzu UV-3600). Real time transmittance measurement was carried out with a spectrophotometer (Ocean Optics Maya2000 Pro) and a 500 nm light emitting diode (LED) was used as the light source. Based on setting the transmittance of the bleached state as ca. 90%, each bias state was maintained for 10 s before switching to the opposite polarity.Electrochromic storage device measurements
Three coated FTO glasses were connected in series. A +2 V voltage was applied to drive the electrochromic reaction. After the glasses turned black, a green LED was connected in the circuit and it lit up.Results and discussion
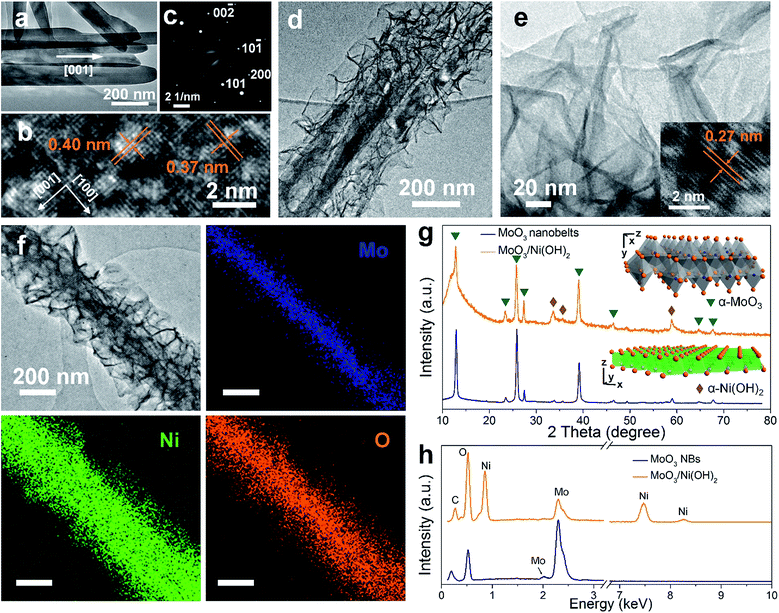
2D MoO3 nanobelts and secondary outerlying 2D Ni(OH)2 nanosheets were fabricated successfully by facile hydrothermal and solvothermal methods, respectively.21,22 A schematic illustration is shown in Fig. 1a. The morphology and structure of MoO3 nanobelt and Ni(OH)2/MoO3 were first characterized by SEM, as shown in Fig. 1b–g. The smooth MoO3 nanobelt structures with an average width of 150 nm (Fig. 1b and c) and thickness of ca. 30 nm (Fig. 1d) can be clearly observed. Using the MoO3 nanobelts as a nucleation platform, Ni(OH)2 nanosheets could be uniformly grown solvothermally. The Ni(OH)2 nanosheets distributed on the surface of the MoO3 nanobelts and thus formed a 2D-on-2D hierarchical architecture of nanobelt core–nanosheets shell (Fig. 1e–g). The TEM images of MoO3 nanobelts show that the distances of lattice strips are about 0.40 nm and 0.37 nm, corresponding to the (100) and (001) planes of the orthorhombic α-MoO3 phase (Fig. 2a and b).23,24 The selected area electron diffraction pattern recorded perpendicular to the growth axis of a single nanobelt (Fig. 2c) could be attributed to the [010] zone axis diffraction of single-crystalline α-MoO3, and suggested that the nanobelt grew along the [001] direction.25–27 A clear core/shell structure of MoO3/Ni(OH)2 is illustrated in the TEM image (Fig. 2d). An interplanar spacing of 0.27 nm in outer thin nanosheets (Fig. 2e) corresponds to the (100) planes of Ni(OH)2 (Fig. 2e, inset).28 Elemental mapping was also performed to better illustrate the core/shell structure. As shown in Fig. 2f, the nanobelt core of MoO3 inside is revealed by the Mo element mapping, covered by a uniform sheath consisting of Ni and O elements.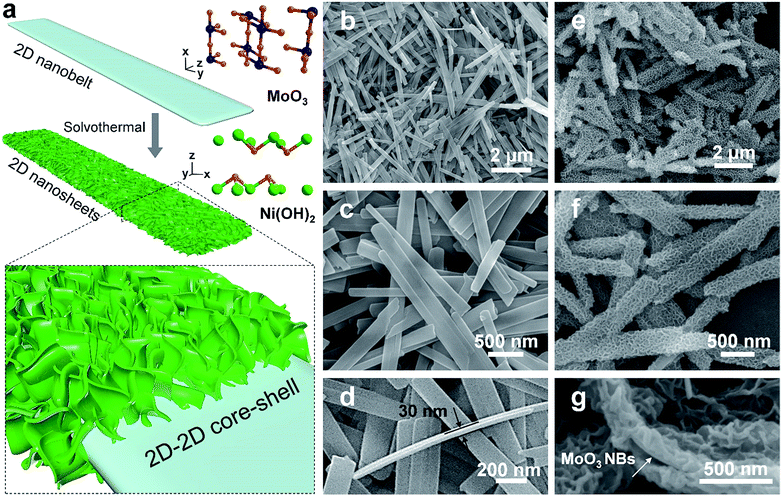 | ||
| Fig. 1 (a) Schematic illustration of synthesis of 2D-on-2D MoO3/Ni(OH)2. (b–d) SEM images of MoO3 nanobelts. (e–g) SEM images of MoO3/Ni(OH)2. | ||
The crystal structures of MoO3 nanobelts and MoO3/Ni(OH)2 were also investigated by XRD and the spectra are shown in Fig. 2g. XRD perfectly assigned to orthorhombic α-MoO3 (JCPDS card no. 05-0508) in accordance with the results of TEM analysis, which is the conventional thermodynamically stable phase. The absence of noticeable impurity peaks suggests the high purity of the α-MoO3 product. The stronger intensities of the (020), (040), and (060) diffraction peaks suggest highly anisotropic growth of the nanostructures.26 The structure of α-MoO3 is shown in Fig. 2g (inset, upper), which is constituted of [MoO6] octahedra, with sharing edges and corners, resulting in zigzag chains and unique layer parallel to the (010) plane structure, presenting open channels for H+ ion intercalation.29 After growth of Ni(OH)2 nanosheets, the enhanced peaks located at 33° and 59° can be indexed to (110) and (300) crystal planes of α-Ni(OH)2 (JCPDS card no. 22-0444), the crystalline structure of which is illustrated in Fig. 2g (inset, lower). The XRD spectrum of pure Ni(OH)2 nanosheets (morphology and structure are illustrated in Fig. S1 and S2†) synthesized in the absence of MoO3 nanobelts under the same conditions further indicates the α-Ni(OH)2 phase, as shown in Fig. S3.†30 The EDX spectra of both MoO3 nanobelts and MoO3/Ni(OH)2 in Fig. 2h show C, O and Mo peaks at 0.26 keV, 0.52 keV, 2.02 keV and 2.30 keV, corresponding to the composition of MoO3 nanobelts. Ni peaks are seen at 0.85, 7.47 and 8.25 keV in MoO3/Ni(OH)2, indicating the growth of Ni(OH)2 nanosheets.23,31 The chemical compositions of MoO3 nanobelts and MoO3/Ni(OH)2 were also confirmed by FT-IR spectra, shown in Fig. S4.† The bands appearing at approximately 3600–3000, 1700–1400, 1380, 1300–1000 and 1000–800 cm−1 can be assigned to the characteristic vibrations of O–H stretching, O–H bending, NO3− anions, C–O stretching and Mo–O2 stretching, Mo–O–Mo bridge stretching.32 The peak at 610 cm−1 can be assigned to the Ni–O, O–Ni–O, and Ni–O–Ni vibrations.30
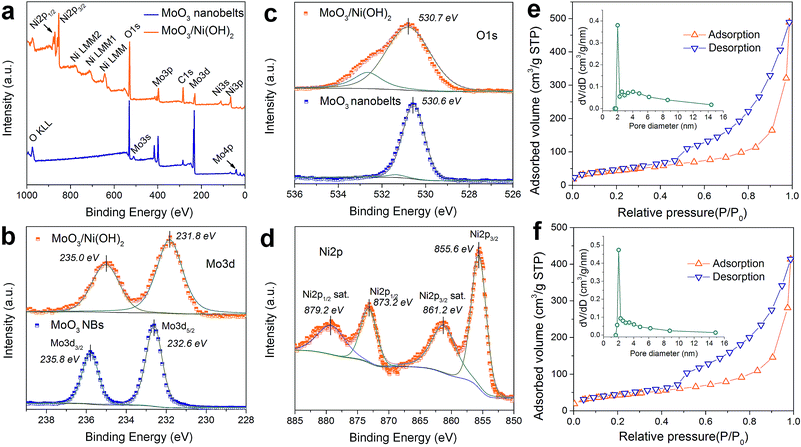
XPS analysis was adopted to determine the chemical states of the MoO3 nanobelts and MoO3/Ni(OH)2, particularly for Mo, O and Ni. The wide scan spectrum in Fig. 3a shows the binding energy peaks at 285.0 and 530.1 eV, which are attributed to C 1s and O 1s, respectively. Binding energies of 232.6 and 235.8 eV are indicative of Mo 3d5/2 and Mo 3d3/2, with the Mo 3d spectrum (Fig. 3b) corresponding to the Mo6+.27 Meanwhile, a slight shift and FWHM broadening of the peaks of Mo 3d and O 1s for MoO3/Ni(OH)2 could be ascribed to the growth of Ni(OH)2 nanosheets. A shoulder peak appearing at 532.6 eV (Fig. 3c, MoO3/Ni(OH)2) is attributed to the interstitial oxygen or the chemisorbed oxygen atoms on the surface of MoO3.33 The Ni 2p peak is shown in Fig. 3d. The Ni 2p3/2 peak is located at 855.6 eV with a shakeup satellite peak at about 861.2 eV and Ni 2p1/2 at 873.2 eV with a shakeup satellite peak at about 879.2 eV, which correspond to NiII.34,35 The gap between Ni 2p3/2 and Ni 2p1/2 is about 17.6 eV, which is in agreement with previous reports.36 N2 adsorption–desorption measurements obtained from MoO3/Ni(OH)2 and pure Ni(OH)2 nanosheets gave specific surface areas of 152.6 and 148.2 m2 g−1 and a similar pore size distribution of ∼2 nm, as shown in Fig. 3e and f, respectively.
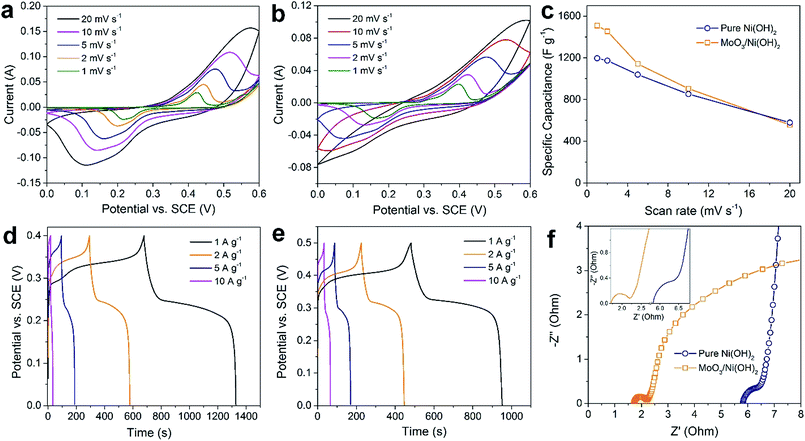
The as-prepared MoO3/Ni(OH)2 and pure Ni(OH)2 nanosheets were evaluated as electrodes for supercapacitors. Fig. 4a shows the cyclic voltammetry (CV) curves obtained from different scan rates (1–20 mV s−1) with a voltage window of 0–0.6 V (vs. SCE) for pure Ni(OH)2 nanosheets and MoO3/Ni(OH)2. A pair of redox peaks is observed in each curve suggesting that measured capacitance is mainly based on the pseudocapacitive mechanism. The intensities of the redox peaks increase and the cathodic peak is shifted to the positive direction while the anodic peak is shifted to the negative direction with scan rate, further confirming the pseudocapacitive property of the material.37,38 The average specific capacitances of the samples can be calculated from the CV curves based on the following equation:39
 | (1) |
The average specific capacitances of the two samples calculated from different scan rates are displayed in Fig. 4a and b. Specific capacitances of 1510, 1455, 1142, 736, and 358 F g−1 can be calculated at scan rates of 1, 2, 5, 10 and 20 mV s−1 for MoO3/Ni(OH)2, which are higher than those of pure Ni(OH)2 except at the rate of 20 mV s−1 (Fig. 4c). The specific capacitances were also determined by galvanostatic charge–discharge (GCD) measurements at various current densities at room temperature and calculated by the following equation:40
 | (2) |
Furthermore, the cyclic stability of the electrode materials is another key issue for practical application; therefore, the GCD test was performed to evaluate the stability of the electrode at a current density of 5 A g−1. As shown in Fig. S6,† the electrode exhibits good long-term cyclic stability, maintaining 80% of its original capacitance (a decrease from 1150 to 921 F g−1) after 3000 cycles. The electrochemical impedance spectroscopy (EIS) analyses of MoO3/Ni(OH)2 and pure Ni(OH)2 nanosheets in the frequency range from 0.01 to 100 kHz are shown as Nyquist plots in Fig. 4f. The equivalent series resistance was only 1.71 Ω in the high-frequency region, which is lower than that of pure Ni(OH)2 nanosheets. The semicircles crossing high and mid-frequencies are attributed to the charge-transfer resistance, which has been enlarged and shown in the inset of Fig. 4f. The lower equivalent series resistance together with the smaller radius of charge-transfer resistance can generally indicate a lower impedance and better electric conductivity for MoO3/Ni(OH)2, which could lead to a better electrochemical performance.
α-Ni(OH)2 is an excellent anodic electrochromic material and can change color upon OH− ion insertion due to its isostructure with hydrotalcite and constituents of hydroxyl-deficient host and interlayer species, such as anions and H2O molecules.41 The electrochromic reaction of Ni(OH)2 is a reversible redox reaction in which the reduced form is nearly transparent while the oxidized material is dark brown, which is summarized in the following equation:42,43
| [Ni(OH)2 + OH−]bleached ↔ [NiOOH + H2O + e−]colored | (3) |
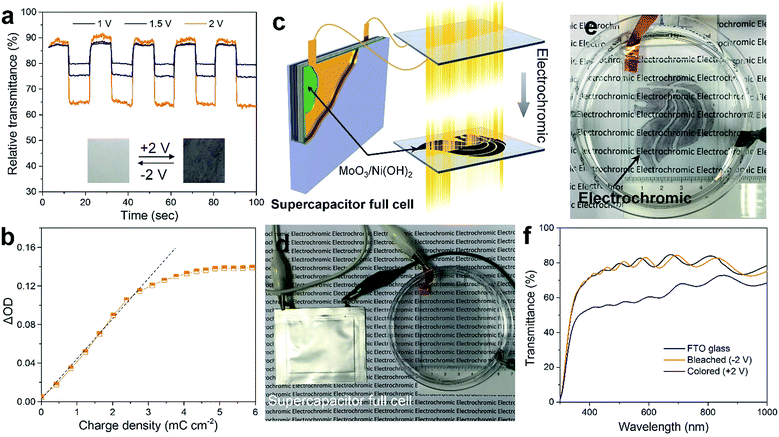
The as-prepared MoO3/Ni(OH)2 also exhibits electrochromic property due to the shell of α-Ni(OH)2 nanosheets and the transmittance spectra of the sample coated on FTO glass recorded at ±1, 1.5 and 2 V are shown in Fig. 5a. The good reversibility of the bleaching/coloration and a stable transmittance change (ΔT) of 7.6, 13.5 and 26.1% for ±1, 1.5 and 2 V at a wavelength of 500 nm could be verified. Also, the bleaching/coloration responses occur almost instantaneously. Digital photographs of reversible bleached and colored states of the MoO3/Ni(OH)2 coating are shown in Fig. 5a, insets. The corresponding coloration efficiency is calculated to be 34.8 cm2 C−1 (Fig. 5b), which is comparable with that of Ni(OH)2/NiO reported previously.43,44 This coloration phenomenon could be ascribed to the charge storage behavior of the electrode observed during the oxidation of the α-Ni(OH)2 layer. It is also believed that the system can store charge by the conversion of α-Ni(OH)2 into the NiOOH counterpart which finally acts as a color center for the respective electrochromic behavior.45
The electrochromism is shown to be driven by an as-prepared supercapacitor (Fig. S7†) which is a more efficient power source due to its high capacity, fast charging, and excellent cycling stability (Fig. 5c). An asymmetric supercapacitor cell, using a slurry of MoO3/Ni(OH)2 packed into full cells and CNTs as counter electrodes, was fabricated and then connected to power the electrochromic reaction on the FTO glass (Fig. 5d). The “Singapore Lion” pattern of MoO3/Ni(OH)2 was coated in advance. Notably, the pattern is almost transparent under the bleached state but discernibly displayed after being powered by the supercapacitor cell (Fig. 5e and S8†). The display evolved from a clear coated glass that allows high transmittance of the printed words to selective dark black patterned coloration. The corresponding transmittance spectra are shown in Fig. 5f, revealing a similar transmittance between the coated and bare FTO glass in the bleached state. Whereas in the colored state, a broad absorption band in the visible range and a corresponding transparency decrease from 80% to 56% at a wavelength of 500 nm were observed, making it a promising, inexpensive optical modulation material.
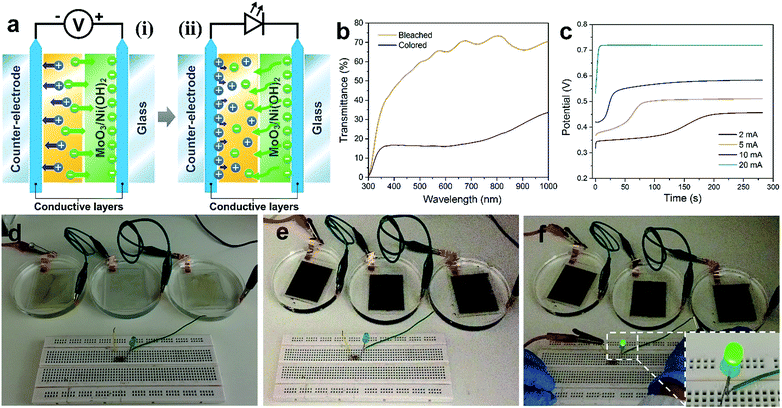
Given the electrochromic process happens when the charge injects or ejects, the electrochromic process can be integrated with charge storage devices.14 Here we demonstrate the combination of electrochromism and energy storage, achieving the advantages of both in these two associated effects. The combination has two aspects (Fig. 6a). Firstly, the electrochromic device was made using 3 pieces of FTO glass coated with a thicker layer of MoO3/Ni(OH)2 and connected in order to store enough energy for subsequent application (Fig. 6d). After applying a potential of +2 V, electrochromism took place and the glasses turned black (Fig. 6e). The corresponding transmittance spectra in Fig. 6b show a transmittance level of 60% in the bleached state and 16% in the colored state. The transmittance contrast increased because of the higher loading of MoO3/Ni(OH)2. During the electrochromic reaction process, the charging performance of the MoO3/Ni(OH)2/FTO glass was investigated at different current densities of 2, 5, 10 and 20 mA. A higher current density leads to a faster charging rate and higher resultant voltage, as shown in Fig. 6c. Thereafter, the energy stored in the electrochromic devices was utilized. The three charged electrochromic FTO substrates are connected in series to form a closed circuit to power an LED (Fig. 6f). The electrochromic device could easily light up a commercial green LED after being charged (Fig. 6f, inset). Our newly designed 2D-on-2D architecture not only has a good electrochromic property, but also features further energy storage properties, which may be used to power electronic devices, such as mobile phones and sensors, in the future.
Conclusions
In summary, dissimilar 2D-on-2D hierarchical architecture of nanobelt core–nanosheets shell of disparate transition metal composite based on a facile solution processing method was produced. The growth of 2D Ni(OH)2 nanosheets on free-standing 2D MoO3 nanobelts manifests in a 3D hierarchical architecture of numerous nanosheets that extend radially outward. Moreover, bifunctional electrochromism–supercapacitive properties are simultaneously realized based on the inexpensive electrochemical active transition metal hydroxide hierarchical structure. The porous core–shell nanostructures of Ni(OH)2/MoO3 display desirable electrochromic optical modulation and coloration efficiency properties alongside favorable pseudocapacitive storage and specific capacitance properties. Such an integrated energy system is anticipated to have a broad range of smart applications in buildings, automobiles and other various electronics needs.Acknowledgements
This work is supported by the National Research Foundation Singapore, Ministry of National Development, R-263-000-C22-277.References
- X. Yu, T. J. Marks and A. Facchetti, Nat. Mater., 2016, 15, 383 CrossRef CAS PubMed.
- N. E. Motl, A. F. Smith, C. J. DeSantisa and S. E. Skrabalak, Chem. Soc. Rev., 2014, 43, 3823 RSC.
- P. Yang, Y. Ding, Z. Lin, Z. Chen, Y. Li, P. Qiang, M. Ebrahimi, W. Mai, C. P. Wong and Z. L. Wang, Nano Lett., 2014, 14, 731 CrossRef CAS PubMed.
- H.-Y. Wang, S.-F. Hung, H.-Y. Chen, T.-S. Chan, H. M. Chen and B. Liu, J. Am. Chem. Soc., 2016, 138, 36 CrossRef CAS PubMed.
- C.-W. Tung, Y.-Y. Hsu, Y.-P. Shen, Y. Zheng, T.-S. Chan, H.-S. Sheu, Y.-C. Cheng and H. M. Chen, Nat. Commun., 2015, 6, 8106 CrossRef CAS PubMed.
- M. Gao, L. Zhu, W. L. Ong, J. Wang and G. W. Ho, Catal. Sci. Technol., 2015, 5, 4703 CAS.
- L. Zhu, M. Hong and G. W. Ho, Sci. Rep., 2015, 5, 11609 CrossRef CAS PubMed.
- T. Zhu, C. K. N. Peh, M. Hong and G. W. Ho, Chem.–Eur. J., 2014, 20, 11505 CrossRef CAS PubMed.
- Z. Sun, T. Liao, Y. Dou, S. M. Hwang, M. S. Park, L. Jiang, J. H. Kim and S. X. Dou, Nat. Commun., 2014, 5, 3813 CAS.
- M. Chhetri, M. Rana, B. Loukya, P. K. Patil, R. Datta and U. K. Gautam, Adv. Mater., 2015, 27, 4430 CrossRef CAS PubMed.
- B. Wang, J. S. Chen, Z. Wang, S. Madhavi and X. W. Lou, Adv. Energy Mater., 2012, 2, 1188 CrossRef CAS.
- H. Yin, S. Zhao, K. Zhao, A. Muqsit, H. Tang, L. Chang, H. Zhao, Y. Gao and Z. Tang, Nat. Commun., 2015, 6, 6430 CrossRef CAS PubMed.
- N.-T. Suen, S.-F. Hung, Q. Quan, N. Zhang, Y.-J. Xu and H. M. Chen, Chem. Soc. Rev., 2017, 46, 337 RSC.
- P. Yang, P. Sun and W. Mai, Mater. Today, 2015, 19, 394 CrossRef.
- P. Yang, P. Sun, Z. Chai, L. Huang, X. Cai, S. Tan, J. Song and W. Mai, Angew. Chem., Int. Ed., 2014, 53, 11935 CrossRef CAS PubMed.
- J. W. Liu, J. Zheng, J. L. Wang, J. Xu, H. H. Li and S. H. Yu, Nano Lett., 2013, 13, 3589 CrossRef PubMed.
- R. T. Wen, C. G. Granqvist and G. A. Niklasson, Nat. Mater., 2015, 14, 996 CrossRef CAS PubMed.
- L. Guo, Y. Ren, J. Liu, S. Y. Chiam and W. K. Chim, Small, 2014, 10, 2611 CrossRef CAS PubMed.
- D. Wei, M. R. J. Scherer, C. Bower, P. Andrew, T. Ryhänen and U. Steiner, Nano Lett., 2012, 12, 1857 CrossRef CAS PubMed.
- S. Jin, G. Yang, H. Song, H. Cui and C. Wang, ACS Appl. Mater. Interfaces, 2015, 7, 24932 CAS.
- Y. Shen, Y. Yang, F. Hu, Y. Xiao, P. Yan and Z. Li, Mater. Sci. Semicond. Process., 2015, 29, 250 CrossRef CAS.
- J. Zhu, L. Huang, Y. Xiao, L. Shen, Q. Chen and W. Shi, Nanoscale, 2014, 6, 6772 RSC.
- D. Chen, M. Liu, L. Yin, T. Li, Z. Yang, X. Li, B. Fan, H. Wang, R. Zhang, Z. Li and H. Xu, J. Mater. Chem., 2011, 21, 9332 RSC.
- P. J. Lu, M. Lei and J. Liu, CrystEngComm, 2014, 16, 6745 RSC.
- Y. B. Li, Y. Bando, D. Golberg and K. Kurashima, Appl. Phys. Lett., 2002, 81, 5048 CrossRef CAS.
- Z. Wang, S. Madhavi and X. W. Lou, J. Phys. Chem. C, 2012, 116, 12508 CAS.
- K. Dewangan, N. N. Sinha, P. K. Sharma, A. C. Pandey, N. Munichandraiah and N. S. Gajbhiye, CrystEngComm, 2011, 13, 927 RSC.
- W. Zhou, X. Liu, Y. Sang, Z. Zhao, K. Zhou, H. Liu and S. Chen, ACS Appl. Mater. Interfaces, 2014, 6, 4578 CAS.
- L. Zheng, Y. Xu, D. Jin and Y. Xie, Chem. Mater., 2009, 21, 5681 CrossRef CAS.
- R. Li, Z. Hu, X. Shao, P. Cheng, S. Li, W. Yu, W. Lin and D. Yuan, Sci. Rep., 2016, 6, 18737 CrossRef CAS PubMed.
- K. Zhou, W. Zhou, L. Yang, J. Lu, S. Cheng, W. Mai, Z. Tang, L. Li and S. Chen, Adv. Funct. Mater., 2015, 25, 7530 CrossRef.
- M. Ayala-G, E. Puello, P. Quintana, G. González-García and C. Diaz, RSC Adv., 2015, 5, 102652 RSC.
- H. Y. Chen, H. C. Su, C. H. Chen, K. L. Liu, C. M. Tsai, S. J. Yen and T. R. Yew, J. Mater. Chem., 2011, 21, 5745 RSC.
- I. Chang, T. T. Chen, M. H. Yang, H. T. Chiu and C. Y. Lee, J. Mater. Chem. A, 2014, 2, 10370 CAS.
- C. Tang, N. Cheng, Z. Pu, W. Xing and X. Sun, Angew. Chem., Int. Ed., 2015, 54, 9351 CrossRef CAS PubMed.
- L. Zhang, Q. Ding, Y. Huang, H. Gu, Y. E. Miao and T. Liu, ACS Appl. Mater. Interfaces, 2015, 7, 22669 CAS.
- H. B. Li, M. H. Yu, F. X. Wang, P. Liu, Y. Liang, J. Xiao, C. X. Wang, Y. X. Tong and G. W. Yang, Nat. Commun., 2013, 4, 1894 CrossRef CAS PubMed.
- Y. Zhao, L. Hu, S. Zhao and L. Wu, Adv. Funct. Mater., 2016, 26, 4085 CrossRef CAS.
- T. Zhu, J. Wang and G. W. Ho, Nano Energy, 2015, 18, 273 CrossRef CAS.
- R. Zhang, Y. Xu, D. Harrison, J. Fyson and D. Southee, Int. J. Electrochem. Sci., 2016, 11, 7922 CrossRef CAS.
- T. Gao and B. P. Jelle, J. Phys. Chem. C, 2013, 117, 17294 CAS.
- W. L. Ong, S. W. L. Ng, C. Zhang, M. Hong and G. W. Ho, J. Mater. Chem. A, 2016, 4, 13307 CAS.
- F. Grote, Z. Y. Yu, J. L. Wang, S. H. Yu and Y. Lei, Small, 2015, 11, 4666 CrossRef CAS PubMed.
- X. H. Xia, J. P. Tu, J. Zhang, X. L. Wang, W. K. Zhang and H. Huang, Sol. Energy Mater. Sol. Cells, 2008, 92, 628 CrossRef CAS.
- D. K. Bora, A. Braun, R. Erni, U. Müller, M. Döbelie and E. C. Constable, Phys. Chem. Chem. Phys., 2013, 15, 12648 RSC.
Footnote |
| † Electronic supplementary information (ESI) available: Additional SEM, TEM, XRD, FTIR and photographs. Specific capacitances and cycling performances of the material. See DOI: 10.1039/c7ta01858d |
| This journal is © The Royal Society of Chemistry 2017 |

