
 Open Access Article
 This Open Access Article is licensed under a Creative Commons Attribution-Non Commercial 3.0 Unported Licence
Oxygen-induced doping on reduced PEDOT†
E.
Mitraka
a,
M. J.
Jafari
 b,
M.
Vagin
ab,
X.
Liu
b,
M.
Fahlman
b,
T.
Ederth
b,
M.
Berggren
a,
M. P.
Jonsson
a and
X.
Crispin
*a
b,
M.
Vagin
ab,
X.
Liu
b,
M.
Fahlman
b,
T.
Ederth
b,
M.
Berggren
a,
M. P.
Jonsson
a and
X.
Crispin
*a
aDepartment of Science and Technology, Linkoping University, Campus Norrkoping, S-60174 Norrkoping, Sweden. E-mail: xavier.crispin@liu.se
bDepartment of Physics, Chemistry and Biology, Linkoping University, S-581 83 Linkoping, Sweden
First published on 6th February 2017
Abstract
The conducting polymer poly(3,4-ethylenedioxythiophene) (PEDOT) has shown promise as air electrode in renewable energy technologies like metal–air batteries and fuel cells. PEDOT is based on atomic elements of high abundance and is synthesized at low temperature from solution. The mechanism of oxygen reduction reaction (ORR) over chemically polymerized PEDOT:Cl still remains controversial with eventual role of transition metal impurities. However, regardless of the mechanistic route, we here demonstrate yet another key active role of PEDOT in the ORR mechanism. Our study demonstrates the decoupling of conductivity (intrinsic property) from electrocatalysis (as an extrinsic phenomenon) yielding the evidence of doping of the polymer by oxygen during ORR. Hence, the PEDOT electrode is electrochemically reduced (undoped) in the voltage range of ORR regime, but O2 keeps it conducting; ensuring PEDOT to act as an electrode for the ORR. The interaction of oxygen with the polymer electrode is investigated with a battery of spectroscopic techniques.
Introduction
Both the pollution level of the environment and the increasing energy demands have stimulated intense research on the development of efficient, low-cost, environmentally friendly energy conversion and storage systems. The oxygen reduction/evolution reactions (ORR/OER) play important roles in such renewable-energy technologies, including use in metal–air batteries and fuel cells.1The air electrode is one of the most essential parts of both fuel cells and metal–air batteries and it is responsible for the reduction of O2. Platinum is currently the benchmark electrode material of air batteries and fuel cells. Compared to regular metals, Pt does not form an insulating metal oxide, which would render the air electrode inactive. However, Pt is expensive and exhibits other important disadvantages, such as CO poisoning2,3 and agglomeration,4 which diminish the performance of the fuel cells. Extensive research has therefore been devoted to reduce the amount of Pt used in ORR electrodes,5–7 and to develop metal free air-electrodes.
Several non-conventional materials that fulfill the requirements for the electrocatalytic oxygen reduction process have been investigated for use in air electrodes, including carbon nanotubes,8 nitrogen-doped graphene,9 conducting polymers10,11 and modified conducting polymer composites.12 Among many other intrinsically conducting polymers (ICPs),10 PEDOT (poly(3,4-ethylenedioxythiophene:tosylate)) emerged as an alternative to Pt as cathode catalyst material.11 Since then, several studies have been conducted in the area, using either plain PEDOT13,14 or modified PEDOT composites.1,15,16
While recently reported air-electrodes based on PEDOT exhibited as high efficiency as Pt,14 there are still vital pieces of the ORR catalytic mechanism that remain unknown. First, it is not known which PEDOT sites O2 (and H2O2) interacts on. Second, it remains to elucidate the role, if any, of the crystal structure and ordering of the conducting polymer.17 Third, information on potential intermediate species that form during the complex ORR would be highly beneficial for a complete understanding.
In this study, we show that electrochemically reduced PEDOT is more conducting at lower negative applied potentials in presence of O2 (during ORR) than in its absence (no ORR). We demonstrate the active role of PEDOT in the ORR mechanism by using a model system: electrochemically reduced PEDOT films in N2. The dried reduced PEDOT films were then exposed to air while monitoring their optical (NIR-Vis spectroscopy), electrical (4-probe measurement) and structural properties (XPS and FTIR). Those experiments rationalize the active role of PEDOT in the reaction with O2. Our findings and improved insights will be of high importance for the development of the next generation of low-cost environmentally friendly air electrodes.
Experimental
Film manufacturing/synthesis
PEDOT:Tos (poly(3,4-ethylenedioxythiophene:tosylate)) films were prepared using the following materials: iron(III) tris-p-toluenesulphonate (40 wt%) in butanol (Clevios™ CB 40 V2), anhydrous pyridine (Aldrich) and 3,4-ethylenedioxythiophene (EDOT) (Sigma-Aldrich). The chemical polymerization of EDOT in the presence or iron tosylate followed a method described elsewhere.18 In brief, pyridine is added through the Clevios™ solution (0.5 mol per 1 mol of iron tosylate), as an inhibitor to control the kinetics of the polymerization. The solution is stirred for 2 hours. Next, EDOT is added and the solution is stirred in a vortex mixer (VWR). The resulting solution is spin coated onto the substrate (500 rpm for 5 s and 1500 rpm for 1 min) and baked on a hot-plate at 90 °C for 20 min to complete the polymerization. Finally, the PEDOT:Tos films are rinsed in hydrochloric acid, in order to exchange tosylate with chloride (as shown in Fig. S1†), and subsequently dried with nitrogen. The obtained PEDOT:Cl film thickness is approximately 100 nm, as measured with a DEKTAK profilometer.Electrochemical measurements (in situ resistometry and chronoamperometry)
All the chronoamperometric measurements were performed with an Autolab (PGSTAT30) potentiostat/galvanostat coupled to a computer using GPES software and a three electrode electrochemical cell was employed (Fig. S2a†). The counter and reference electrodes were a platinum mesh electrode and a Ag/AgCl (3 M KCl) electrode, respectively. The electrolyte used was 0.1 M aqueous KCl. The working electrode was prepared on a silicon wafer covered by an insulating oxide layer to avoid contributions from any conductive substrate. Moreover, a layer of Au (80 nm) was used for better contact (Fig. S2a†). This Au layer below PEDOT did not come in contact with the electrolyte.The chronoamperometric measurement in N2 conditions was conducted in a glovebox. The electrode and the electrolyte stayed in the glovebox overnight before the measurement, in order to avoid O2 contamination. The efficiencies of PEDOT:Cl and Pt in oxygen reduction were determined in excess of O2.
The in situ resistometry measurements were performed with an Autolab (PGSTAT30) potentiostat/galvanostat coupled to a computer using Nova 2.0 software. The in situ resistometry cell comprised of a four electrode electrochemical setup. The working electrode was prepared on glass with two interdigitated gold electrodes (WE(1) and WE(2), Fig. S2b†). A bias of 50 mV was applied and maintained between the two working electrodes (WE(1) and WE(2)), while sweeping the potential relative to the counter electrode from 0.6 V to −0.9 V at a scan rate of 5 mV s−1. The electrolyte used and the counter and reference electrodes were the same with the chronoamperometric measurements.
Three devices were studied for the in situ resistometry measurements in order to obtain some statistics. Each couple of interdigitated electrodes (device) was covered with a PEDOT:Cl film and it was studied in the range of 0.6 to −0.9 V in both N2 and O2. The electrolyte was bubbled with N2 for 2 hours prior to measurement. The N2 bubbling continued also during the measurement. Next, the in situ resistance was measured in excess of O2 by bubbling the electrolyte with O2 (100%) for 20 min prior to the measurement (also here the bubbling continued during the measurement). Finally, in the manuscript we present the in situ resistometry results with an emphasis to potentials lower than −0.4 V, since resistance is stable in the range of 0.6 V to −0.4 V.
Resistance measurements
The samples were prepared in an oxygen-free (N2) glovebox on glass substrates with pre-patterned gold contacts (80 nm). The PEDOT:Cl films were immersed in an organic solution (0.1 M tetraethylammonium chloride in acetonitrile) and a potential of 0.3 V is applied until the current reached a steady state (ca. 90 s). Next, each sample was reduced at 0 V, −0.5 V or −0.9 V, respectively, until the current again reached a steady state (ca. 90 s). After reduction, the films were rinsed in acetonitrile to remove any residual salt. The resistance of the film was recorded continuously by 4-probe measurements, first in the N2 environment for 5 min and then air was allowed to enter in the glovebox in order for the sample to come in contact with O2.Vis-NIR spectroscopy
The sample preparation was the same as in the resistance measurements. After reduction and rinsing with acetonitrile, the samples were placed in a bottle, which was then sealed with parafilm. The bottle was transferred to the spectrophotometer (PerkinElmer Lambda 90). A single layer of parafilm for sealing of the bottle was proved to be enough to keep O2 out for the short period of transferring the sample to the spectrophotometer. The same type of bottle containing a glass substrate without the polymer film was used as reference. Several spectra were first acquired under N2 conditions to verify that the bottle was properly sealed. We first used a large wavelength range (400–1400 nm) to capture all details, and then a shorter range (500–650 nm) to enable faster acquisition. Then, a hole was made in the parafilm to let air in. From that moment and for the following 15 minutes, we acquired a shorter-range spectrum every minute. Three additional spectra were acquired at 20 min, 30 min and 60 min after oxygen exposure.Polarization-modulation infrared reflection-absorption spectroscopy (PM-IRAS)
PEDOT:Cl samples were prepared onto gold-coated glass substrates (2 cm × 4 cm, 80 nm gold). After reduction according to the procedure described above, the films were rinsed in acetonitrile to remove residual salt. Next, the sample was mounted in a gas-tight measurement chamber that allows PM-IRAS experiments without exposure of the sample to the atmosphere. First, the samples were subjected to a N2 flow in order to remove any volatile compounds. Then, spectra were captured under the nitrogen atmosphere. Oxygen (from a bottle containing 100% O2) was then introduced into the chamber and spectra were recorded during the first 2 hours to study potential PEDOT:Cl oxidation. Finally, the samples were kept under ambient conditions for one week to follow oxidation and degradation of PEDOT:Cl. All spectra were acquired at 4 cm−1 resolution by averaging 200 scans, over a wavenumber range between 4000 and 800 cm−1. All spectra are baseline-corrected by identical rubberband corrections over the spectral range.The measurements were carried out by means of a grazing angle (86°) reflection setup in a Bruker PMA50 accessory with a LN2-cooled MCT detector connected to a Bruker VERTEX70 spectrometer. A photoelastic modulator (Hinds: ZnSe 50 kHz) was used to modulate the polarization of the light and demodulation of signals was accomplished with a lock-in amplifier (Stanford Research SR830).
X-ray photoemission spectroscopy (XPS)
PEDOT:Cl samples were prepared onto gold-coated glass substrates (1.5 cm × 1 cm, 80 nm gold). After reduction as described above, the films were rinsed in acetonitrile to remove the residual salt. Finally, the samples were placed on a holder and transferred to the spectrometer (Scienta ESCA 200) without exposure to oxygen or air.The samples were first left in the spectrometer in ultrahigh vacuum at a base pressure of 10−10 mbar to remove any volatile compounds and followed by acquisition of a spectrum. Next, the samples were exposed to air for 5 min followed by acquisition of another spectrum. The same procedure was repeated after 40 min, 400 min, 140 h and 2 weeks of exposure to air. In the following work only 40 min and 2 weeks are presented in comparison with N2.
All spectra were obtained using a monochromatic Al(K alpha) X-ray source providing photons with 1486.6 eV. The XPS experimental condition was set so that the full width at half maximum of the clean Au 4f7/2 line was 0.65 eV. All spectra were collected at a photoelectron takeoff angle of 0° (normal emission) at room temperature.
Below, the chemical compositions of the polymers are discussed through the S(2p), O(1s) and C(1s) core level spectra. Deconvolution of the complex spectra for the polymer samples were carried out on the basis of a priori knowledge of the chemical composition. During the deconvolution performed on the S(2p) spectra, the intensity ratio between the S(2p1/2) and S(2p3/2) spin–orbit components was kept fixed to 1![[thin space (1/6-em)]](https://www.rsc.org/images/entities/char_2009.gif) :2. To present the XPS spectra of the reduced polymer film (at −0.9 V) we used the O atom signal of the ether part of the polymer at 532.8 eV as internal references.19 The XPS spectra of all other samples were then aligned to this O-ether carbon atom contribution, which was set to 532.8 eV.
:2. To present the XPS spectra of the reduced polymer film (at −0.9 V) we used the O atom signal of the ether part of the polymer at 532.8 eV as internal references.19 The XPS spectra of all other samples were then aligned to this O-ether carbon atom contribution, which was set to 532.8 eV.
Results
Effect of ORR on PEDOT:Cl and on in situ resistometry
The increase in cathodic polarization of PEDOT:Cl electrode in oxygen-saturated aqueous electrolyte leads to increase of steady-state currents, obtained after 3 min of applied potential pulse (Fig. S3†), in comparison with deoxygenated media (Fig. 1a) illustrating the pure faradaic phenomena of ORR. The steady-state current density reached almost 0.5 mA cm−2 at −0.9 V, which is only three times lower than it is for a platinum electrode (in the same conditions), motivating the use of PEDOT:Cl as air electrode for ORR.14 | ||
| Fig. 1 (a) Comparing oxygen reduction reaction (ORR) in aqueous 0.1 M KCl in N2 and in O2 with Pt in O2. (b) In situ resistometry of a PEDOT:Cl film vs. applied potential in N2 (blue line) and in excess of O2 (light blue line). The curves presented refer to the average resistance of PEDOT:Cl, as this was calculated from the data of the three studied devices. The dashed lines aside the average curves show the fluctuation of the resistance in both N2 and O2 in the low negative potential (<−0.6 V). Nevertheless, the resistance is stable in the potential range −0.6 V to 0.6 V. | ||
Next, we investigate the in situ resistometry of the PEDOT:Cl electrode during ORR. The electrochemical measurements of in situ resistometry of PEDOT:Cl electrode during ORR (Fig. 1b and S4†) showed the influence of the faradaic process on the energy levels of the conducting polymer. We observe the clear transition between conducting (−0.4 V to −0.6 V) and semiconducting states (−0.6 V to −0.8 V) of PEDOT:Cl featured by high and low values of resistance, respectively. The high cathodic overpotentials lead to de-doping of PEDOT, resulting in a two orders of magnitude decrease of resistance. Nevertheless, the appearance of ORR electrocatalysis leads to a clear contribution to conductivity in comparison to N2 conditions in the lower negative potential region.
The comparison of ORR electrocatalysis and conductivity dependencies on applied potential allowed the resolving of two parallel phenomena: the ORR electrocatalysis on PEDOT:Cl takes place at the conducting region (−0.4 V to −0.6 V) of the polymer leading to a minor effect on conductivity, while the presence of oxygen as an oxidant leads to doping by faradaic process of PEDOT in the semiconducting state (−0.6 V to −0.8 V). Indeed, there is a clear influence of the ORR effect on PEDOT:Cl conductivity at low potentials. Importantly, PEDOT:Cl remains conductive at the ORR conditions, which is an advantage over other ORR metal-free catalysts.
These results show that PEDOT:Cl is affected by the oxygen-associated processes and this motivates a detailed investigation of oxygen–PEDOT:Cl interactions. During this investigation, we used PEDOT:Cl electrodes reduced at 0 V (no ORR activity), −0.5 V (intermediate ORR activity) and −0.9 V (high ORR activity). The samples were prepared under N2 conditions and the properties of the reduced PEDOT were followed by monitoring various properties upon exposure to oxygen. Hence, in the rest of the manuscript, we will deal with ex situ measurements.
Electrical resistance of PEDOT:Cl upon O2 exposure
Fig. 2 shows the decrease of film resistance for PEDOT:Cl dry films reduced at different polarization potentials (0 V, −0.5 V and −0.9 V) upon exposure to oxygen, giving the evidence of the interaction between oxygen and PEDOT:Cl. We note that the conductivity (resistance) of all films increases (decreases) upon O2 exposure. The changes are most significant for more reduced films. The sample reduced at −0.9 V exhibits 85% resistance decrease in 60 min (Fig. 2b). This is the first sign that the polymer gets oxidized and doped by O2 although ex situ. The time-resolved plot of film resistance (Fig. 2b) reveals three different kinetic processes. Short times of oxygen exposure (0.002–0.1 min) show a minor change of resistance probably due to the limitation by the diffusion of O2 in the chamber. Longer times (0.1–1 min) are featured with an abrupt decay of film resistance. Further increase of exposure time is characterized with deceleration in the resistance decay. In order to better understand the origins of these resistance changes, we turn to spectroscopic methods.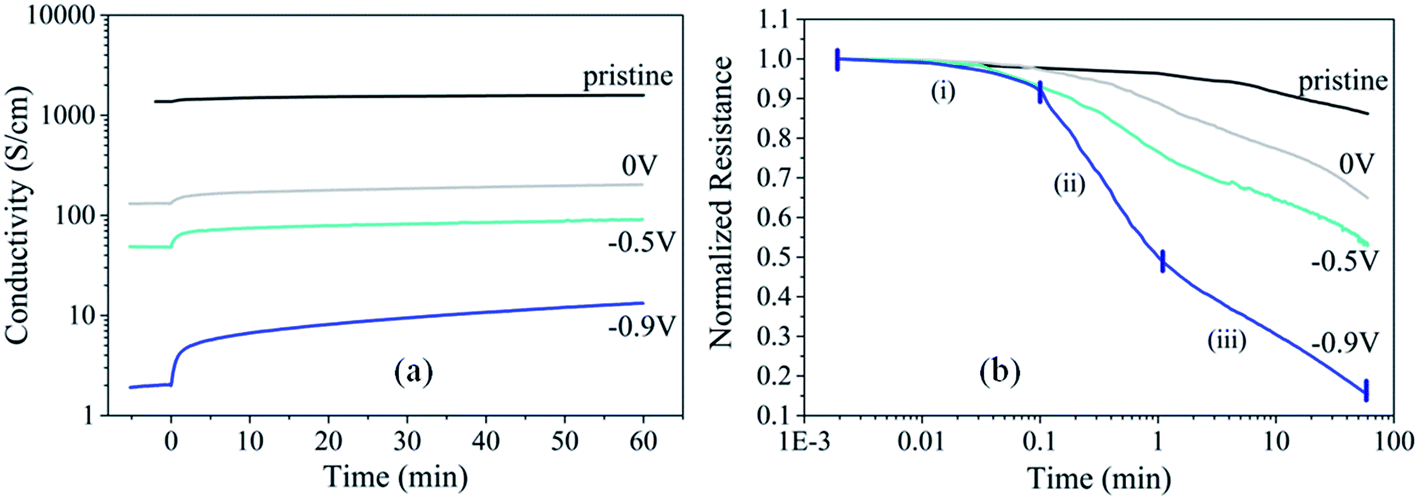 | ||
| Fig. 2 (a) Evolution of conductivity before and after exposure in air (40% RH) and (b) evolution of normalized resistance when O2 is let in the chamber for the pristine PEDOT:Cl film and the films reduced at 0 V, −0.5 V and −0.9 V. | ||
Optical properties of PEDOT:Cl upon O2 exposure
If the electrical resistance drop upon O2 exposure of PEDOT:Cl is due to an oxidation reaction, signatures of the electron transfer should be translated into changes in the optical properties of the polymer. Fig. 3a shows the optical absorbance spectra of PEDOT:Cl films reduced at 0 V, −0.5 V and −0.9 V, while the absorbance spectrum of a pristine PEDOT:Cl film is also included for comparison. The pristine film is a PEDOT:Cl film obtained by chemical polymerization, but without subsequent electrochemical reduction. The pristine film exhibits low absorption in the visible, and the absorbance increases in the near-infrared (NIR) region due to the presence free charge carriers located in (bi)polaron bands specific to semimetallic domains.20 Upon reducing the PEDOT:Cl films in a N2 environment, the absorbance in the NIR region is reduced significantly and two new peaks appear. The first absorption peak appears at 900 nm and it is attributed to polaronic species,21 while the second peak emerges at 582 nm and it originates from neutral PEDOT0 segments.17,22 At this point we also observe that, as expected, the absorption signal at 582 nm for the film reduced at −0.9 V is higher, corresponding to maximum number of neutral species and thus, a lower conductivity of this film.23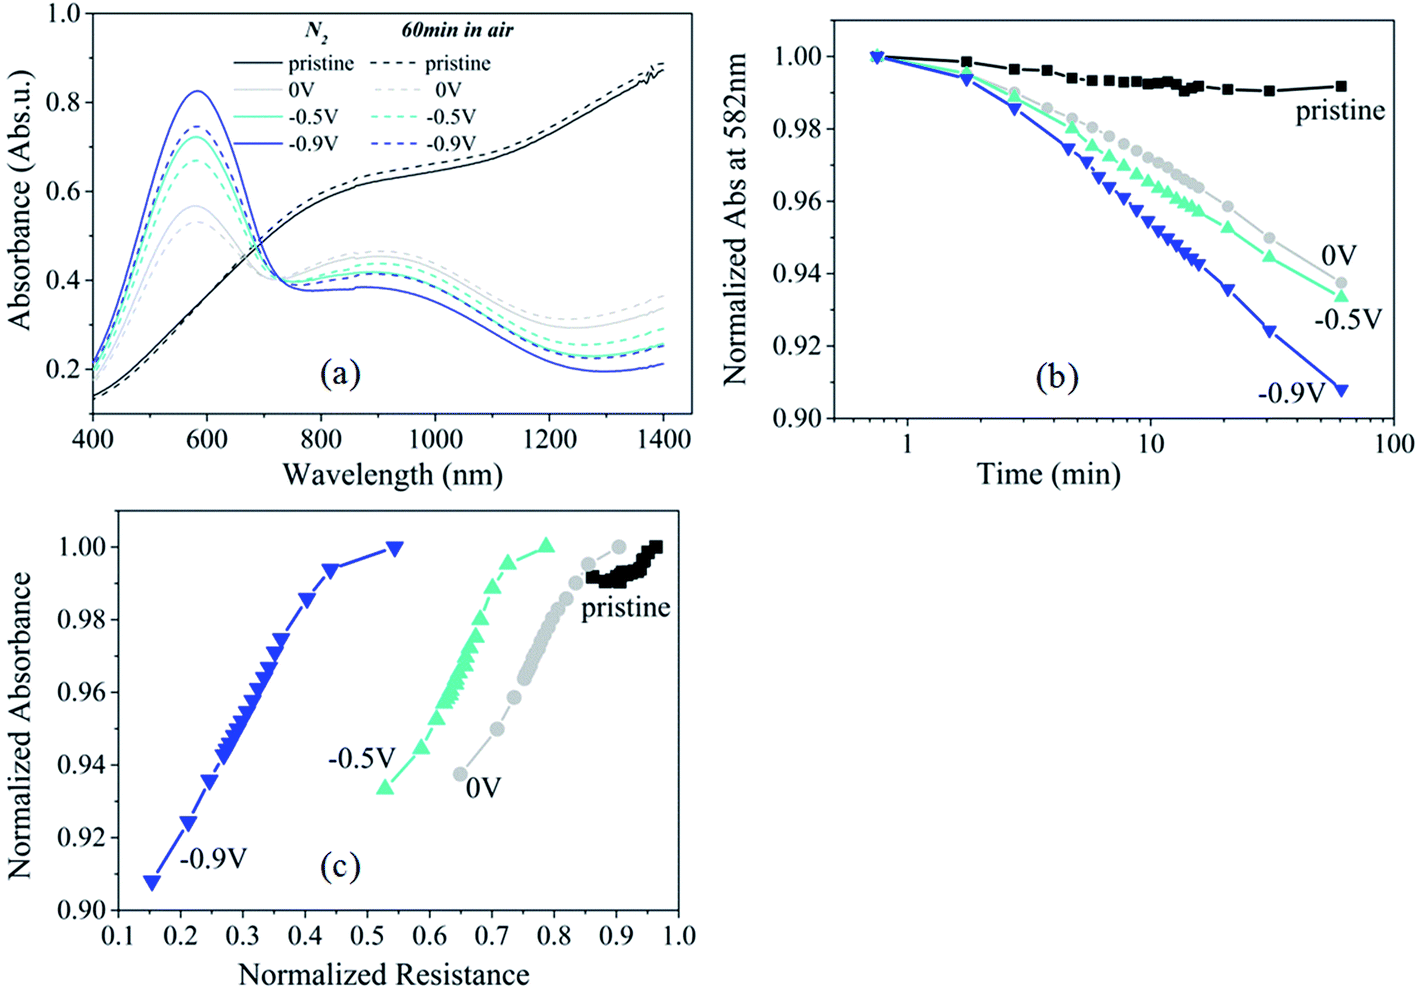 | ||
| Fig. 3 (a) Absorbance spectra for the pristine PEDOT:Cl sample and the samples reduced at 0 V, −0.5 V and −0.9 V, both in N2 environment and after 60 min exposure to air. (b) Evolution of absorbance at 582 nm versus exposure time in O2 for the pristine sample and for samples reduced at 0 V, −0.5 V and −0.9 V. (c) Normalized absorbance at 582 nm versus normalized resistance change for various exposure times to O2. | ||
Exposing the reduced PEDOT:Cl films to air induces an increase of the signal at 900 nm and a decrease in absorption in the visible range (peak at 582 nm), indicating the crucial role of O2 in the removal of electrons from the π-electronic system of the polymer chains. We evaluate the kinetics of this oxidation process by plotting the normalized absorption at 582 nm versus the logarithm of time exposed to air (Fig. 3b). The absorption values were normalized to the value at the time when O2 was allowed to enter. For all samples, the absorption drops approximately exponentially with time, as indicated by the linear evolution in Fig. 3b. The oxidation rate of PEDOT depends on the reduction level of the polymer. The slope [k] is highest for the sample reduced at −0.9 V ([k] = 0.057 min−1) compared to −0.5 V ([k] = 0.041 min−1). The latter has almost the same slope as the PEDOT film reduced at 0 V ([k] = 0.038 min−1). Interestingly, this observation can be correlated with the change in resistance in the film for the third regime (t > 1 min, note that the absorption measurements are restricted to the time scale of minute due to technical limitations). Indeed, the normalized absorbance at 582 nm versus the normalized resistance for films reduced at different potentials follow the same general time evolution (Fig. 3c) supporting that those individual observations correspond to the same phenomenon. In other words, the drop in resistance is associated to an oxidation of the π-electron system of the polymer chain.
Chemical modification in PEDOT:Cl induced by O2 exposure
To further understand the impact of the oxidation of PEDOT:Cl upon oxygen exposure, i.e. the removal of an electron from the π-system on the molecular structure, we performed Polarization-Modulation Infrared Reflection-Absorption Spectroscopy (PM-IRAS). Before investigating the impact of dioxygen on the films, we first describe the differences between the pristine PEDOT:Cl and samples reduced at different applied potentials under nitrogen atmosphere (Fig. 4a). The main vibrations are listed in Table 1. It is informative to monitor the changes in peak positions of the spectra, which are attributed to the transformation from quinoid (pristine) to benzoid (reduced) structure of PEDOT. The results show that the position of the asymmetric C![[double bond, length as m-dash]](https://www.rsc.org/images/entities/char_e001.gif) C band, associated with the quinoid structure22 shifts from 1528 cm−1 for the pristine sample to 1514 cm−1 for the most reduced sample. The intensity of this band also decreases under more negative potential, and a new CC band related to the benzoid structure appears at 1469 cm−1. Fig. 4b shows the quinoid–benzoid ratios obtained from the normalized intensity of the asymmetric CC bands in different samples. The broad absorption bands appearing at about 1320, 1190, 1100 and 975 cm−1 for the pristine sample can be attributed to vibronic intensity enhancement24 and coupling of the skeletal backbone vibration with the π-electron charge oscillation along the chain.25 As expected, the intensity of these bands gradually diminishes with increased reduction potential.
C band, associated with the quinoid structure22 shifts from 1528 cm−1 for the pristine sample to 1514 cm−1 for the most reduced sample. The intensity of this band also decreases under more negative potential, and a new CC band related to the benzoid structure appears at 1469 cm−1. Fig. 4b shows the quinoid–benzoid ratios obtained from the normalized intensity of the asymmetric CC bands in different samples. The broad absorption bands appearing at about 1320, 1190, 1100 and 975 cm−1 for the pristine sample can be attributed to vibronic intensity enhancement24 and coupling of the skeletal backbone vibration with the π-electron charge oscillation along the chain.25 As expected, the intensity of these bands gradually diminishes with increased reduction potential.
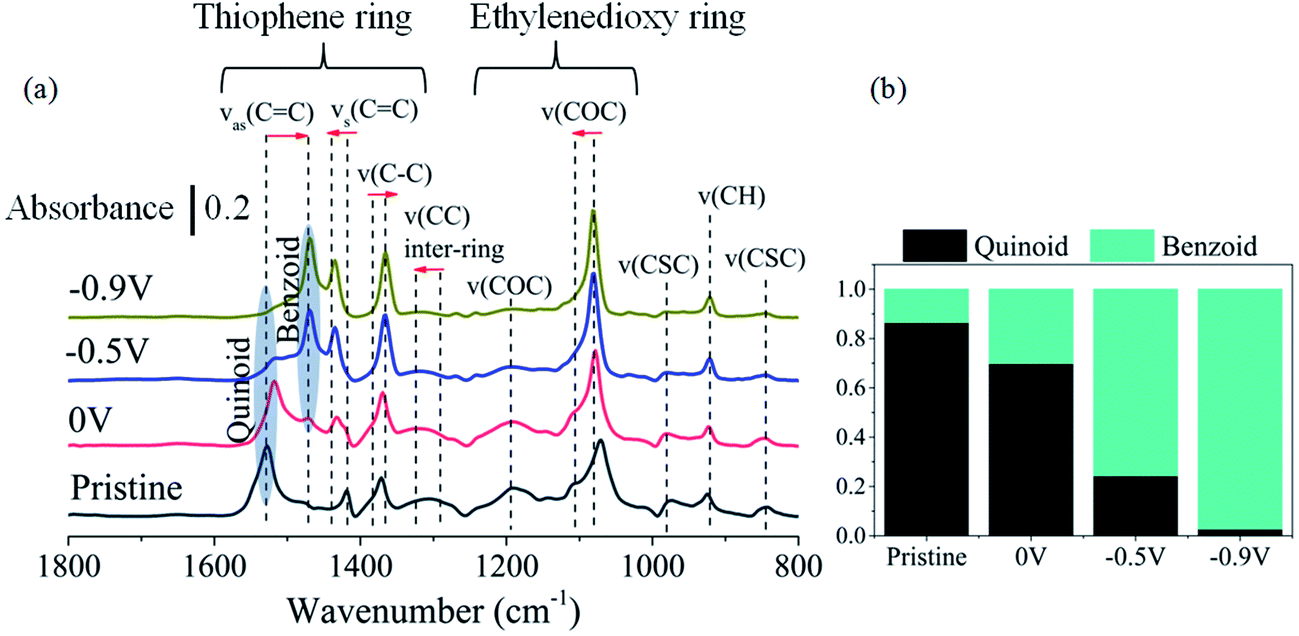 | ||
| Fig. 4 (a) Infrared spectra of pristine and reduced PEDOT:Cl samples under nitrogen atmosphere. The arrows indicate peak position changes from the quinoid (pristine) to the benzoid (reduced at −0.9 V) structures. Further details of the labeled bands can be found in Table 1. (b) Normalized ratio of quinoid and benzoid ring structures, based on normalized intensities of asymmetric CC vibration of quinoid (1528–1514 cm−1) and benzoid (1480–1469 cm−1) structures. | ||
| Assignment | Pristine (cm−1) | Reduced (cm−1) | Shift (cm−1) | References | ||
|---|---|---|---|---|---|---|
| “0.0 V” | “−0.5 V” | “−0.9 V” | ||||
|
ν
as(CC)Th (Q) |
1528 | 1518 | 1514 | 1514 | 14 | 22 and 26 |
|
ν
as(CC)Th (B) |
1482 | 1472 | 1469 | 1469 | 13 | 26 and 27 |
|
ν
s(CC)Th |
1419 | 1432 | 1435 | 1435 | 16 | 27 |
| ν(C–C)Th | 1375 | 1369 | 1366 | 1365 | 10 | 22 and 27 |
| ν(CC)inter-ring | 1306 | 1314 | 1319 | 1322 | 16 | 26 and 27 |
| ν(COC)ED | 1191 | 1190 | 1192 | 1190 | 2 | 22 and 27 |
| ν(COC)ED | 1071 | 1078 | 1083 | 1082 | 9 | 22, 26 and 27 |
| ν(CSC)Th | 978 | 980 | 980 | 981 | 3 | 22 and 28 |
| γ(CH)ED | 925 | 923 | 922 | 922 | 3 | 28 |
| ν(CSC)Th | 843 | 846 | 844 | 846 | 3 | 22 and 28 |
We now turn to the structural changes of the PEDOT:Cl samples induced by exposure to pure O2. As shown in Fig. 5a, the pristine sample and the sample reduced at 0 V do not show any major structural changes under oxygen atmosphere, as inferred from the very small changes in the spectra. In contrast, samples reduced at −0.5 V and −0.9 V show significant changes upon exposure to oxygen. The results are in agreement with polymer oxidation and corresponding changes of their chemical structures. The intensities of the bands related to benzoid structure at about 1469 and 1435 cm−1, decreased, while the intensity of the band related to quinoid structure at about 1528 cm−1 increased. This confirms the transformation from benzoid to quinoid structure during oxidation. Furthermore, the intensities of the bands at about 1320, 1190 and 975 cm−1 increase during oxidation. This can be attributed to the formation of conjugated π-bonds along the backbone chain, and coupling of the skeletal backbone vibrations with the π-electron charge oscillations.
 | ||
| Fig. 5 (a) Infrared spectra of pristine and reduced PEDOT:Cl samples, during the first 2 hours of exposure to oxygen. Green (red) boxes indicate the regions of increasing (decreasing) peak intensity by time, upon exposure to oxygen. (b) Infrared spectra of pristine and reduced PEDOT:Cl samples, followed over a week under exposure to normal atmosphere. | ||
Oxygen-induced degradation of PEDOT:Cl
We used both PM-IRAS and XPS to study the long-term oxidation mechanism and possible degradation of the PEDOT:Cl films. For PM-IRAS, the samples were kept under ambient conditions for one week, and spectra were captured at certain intervals during this time. Fig. 5b shows the PM-IRAS spectra of the samples versus time. The spectra for the pristine sample are almost unchanged under ambient conditions, while the other samples show different levels of oxidation under oxygen exposure. The spectra of the samples reduced under −0.5 V and −0.9 V display a new band about 1707 cm−1 due to CO stretching after the first day, and the intensity of this band increased during the week. This band can be attributed to degradation and ring opening along the PEDOT chain.22 In order to obtain further insights, we characterized the sample reduced at −0.9 V using XPS, first in N2 and then after 40 min and 2 weeks in air. We tracked the evolution of the core spectra of carbon (C 1s) near 285 eV, oxygen (O 1s) near 533 eV, and sulfur (S 2p) near 165 eV (Fig. 6).
 | ||
| Fig. 6 XPS C(1s), O(1s) and S(2p) spectra for the film reduced at −0.9 V in N2 environment ((a), (d) and (g)) and after 40 min of exposure in air ((b), (e) and (h)), and after 2 weeks ((c), (f), and (i)) respectively. | ||
The typical PEDOT XPS C(1s) spectrum contains peaks from three distinct types of carbon (Fig. 7a). These are (i) C–S in the α-position, (ii) CC–O in the β-position, and (iii) C–O–C bonding in the ethylene bridge. Hence, the C(1s) signal is composed with three different contributions corresponding to three non-equivalent carbon atoms: α (284.5 eV), β (285.7 eV), and Cether (286.3 eV). Before exposure to air (Fig. 6a), these three carbon components have approximately the same XPS intensity, which is in good agreement with previous reports.29 We also observe a small asymmetrical tail at higher binding energies that tentatively could be attributed to two other carbon components: CO (288.1 eV) and O–CO (290 eV). After exposure to air for 40 min (Fig. 6b) or two weeks (Fig. 6c), we see a decrease in the intensity of the β-carbon, or a shift to higher binding energy with simultaneous increase of the signal at 288.1 eV. This indicates a possible chemical change in the film due to the interaction with O2 and it can be attributed to CO bonds formation. The formation of the CO bond possibly takes place in α-position and breaks the π-conjugation of the thiophene ring. Similar degradation phenomena have been proposed for PEDOT upon over-oxidation30 or photo-oxidation in air.29
 | ||
| Fig. 7 Chemical structures of (a) EDOT, (b) pristine PEDOT (as prepared – oxidized form), (c) reduced PEDOT. | ||
Fig. 6d presents XPS O(1s) spectra for the reduced (−0.9 V) films in N2. The characteristic peak of the oxygen in the dioxy-ring appears at 532.8 eV.19 However, deconvolution of the curves results in two additional small contributions in the spectra. The first is at approximately 531.8 eV, corresponding to oxygen bonded with a double bond either to sulfur (sulfon groups) or carbon (CO or O–C![[O with combining low line]](https://www.rsc.org/images/entities/char_004f_0332.gif) ). The other peak appears at 533.7 eV and corresponds to C––CO. The contribution at 531.5 eV increases significantly upon exposure to air (Fig. 6e and f), supporting again the assumption of chemical changes that could be either CO formation and/or sulfon group formation.
). The other peak appears at 533.7 eV and corresponds to C––CO. The contribution at 531.5 eV increases significantly upon exposure to air (Fig. 6e and f), supporting again the assumption of chemical changes that could be either CO formation and/or sulfon group formation.
In order to investigate possible formation of sulfon groups, we also compare the S(2p) spectra of the reduced at −0.9 V film before and after exposure to air (Fig. 6g–i). The S(2p1/2,3/2) doublet, typical of the sulfur atom in the thiophene ring, is present at around 163.5 eV and 164.6 eV (Fig. 6g).29,30 Finally, upon exposure to air, a new signal at 167.3 eV appears for the reduced film (Fig. 6h and i). This new contribution is assigned to sulfon groups (SO2),29 which along with the increase of the signal at 531.8 eV confirms sulfon formation.
Discussion
The in situ resistometry measurements of PEDOT:Cl during ORR show that O2 dopes the conducting polymer at a given negative potential resulting in a higher conductivity than in N2 conditions, even at highly negative potentials. This means that the PEDOT:Cl is an electrochemically active polymer that can actively participate in the ORR, rather than being merely a passive catalyst substrate and electrode as for traditional metals like Pt. This higher conductivity in presence of O2 may be essential for the use of the conducting polymer as air electrode. These findings are corroborated by ex situ measurements of dry PEDOT:Cl films. Here, the exposure of reduced PEDOT:Cl to O2 is found to positively dope the neutral PEDOT segments in the polymer sample, resulting in an increase in the conductivity. The electron transfer from the neutral PEDOT to O2 occurs through the π-electron system, thus resulting in an oxidative doping. This is proven by the lowering of the absorbance in the visible, attributed to the transformation of neutral PEDOT into (bi)polaronic species. The latter is further supported by the transition from benzoic to quinoid character in the thiophene rings, as shown by PM-IRAS. Hence, the doping of the conducting polymer electrode when exposed to O2 is a phenomenon that likely maintains PEDOT:Cl as a good conducting electrode even at low electrochemical potential. The species formed from the electron transfer of PEDOT to O2 is not clearly identified in this study. Further work is needed to fully reveal such details. One can speculate that superoxide radical O2−˙ is formed and constitutes the intermediate counterions following the reaction: PEDOT + O2 → PEDOT+ + O2˙−. Finally, we also note that the fate of this reaction into degradation product or potential intermediate seems to include the creation of sulfone and possibly carbonyl group attached on the EDOT monomer.Conclusions
The conducting polymer PEDOT:Cl is an attractive material for low-cost electrodes for ORR owing to several features: (i) it is based on abundant atomic elements, a key advantage compared to noble metals such as Pt, (ii) PEDOT can be synthesized by wet chemistry at low temperature, thus ensuring a low-cost manufacturing process, a unique feature compared to carbon-conductors requiring high temperature synthesis, and finally, (iii) the rate of ORR using PEDOT:Cl is on the same order as Pt, with further potential for improvements in the future. In this work, we conduct in situ resistometry measurements which show the extension of conductivity region to lower negative potentials due to interaction with oxygen in course of ORR. The polymer electrode is reduced to a lesser extent if O2 is present, which, in turn, results in considering PEDOT:Cl a good electrode for ORR and for other applications.Detailed ex situ investigation of oxygen interaction with conducting films reduced at different potentials reveals that the neutral PEDOT segments are oxidized spontaneously upon O2 exposure in the dry state (without liquid electrolyte). This means that the Fermi level of the reduced PEDOT electrode is lower than the redox potential of O2.31 The first oxidation step is an electron transfer from PEDOT to O2, which results in an enhancement of the electrical conductivity of the PEDOT electrode. Hence, compared to a metal electrode reacting with oxygen and creating an insulating oxide, PEDOT does not form an insulating oxide, but is instead positively doped by oxygen. This is a unique feature of polymer electrodes and one of the reasons why they offer a possible alternative to Pt for ORR and other applications based on air electrodes. Our findings and improved insights will be of high importance for the development of the next generation of low-cost environmentally friendly air electrodes.
Acknowledgements
The authors acknowledge the European Research Council (ERC-starting-grant 307596), the Knut and Alice Wallenberg foundation (projects “Tail of the sun” and “Power Papers”), the Wenner-Gren Foundations, the Swedish Research Council, the Swedish Foundation for Strategic Research (0-3D), and the Swedish Government Strategic Research Area in Materials Science on Functional Materials at Linköping University (Faculty Grant SFO-Mat-LiU No 2009 00971).References
- A. D. Chowdhury, N. Agnihotri, P. Sen and A. De, Electrochim. Acta, 2014, 118, 81 CrossRef CAS.
- D. J. Ham, Y. K. Kim, S. H. Han and J. S. Lee, Catal. Today, 2008, 132, 117 CrossRef CAS.
- D. He, K. Cheng, H. Li, T. Peng, F. Xu, S. Mu and M. Pan, Langmuir, 2012, 28, 3979 CrossRef CAS PubMed.
- X. Yu and S. Ye, J. Power Sources, 2007, 172, 145 CrossRef CAS.
- Y. Bing, H. Liu, L. Zhang, D. Ghosh and J. Zhang, Chem. Soc. Rev., 2010, 39, 2184 RSC.
- B. Lim, M. Jiang, P. H. C. Camargo, E. C. Cho, J. Tao, X. Lu, Y. Zhu and Y. Xia, Science, 2009, 324, 1302 CrossRef CAS PubMed.
- Z.-Y. Zhou, N. Tian, J.-T. Li, I. Broadwell and S.-G. Sun, Chem. Soc. Rev., 2011, 40, 4167 RSC.
- Y. Li, W. Zhou, H. Wang, L. Xie, Y. Liang, F. Wei, J.-C. Idrobo, S. J. Pennycook and H. Dai, Nat. Nanotechnol., 2012, 7, 394 CrossRef CAS PubMed.
- L. Qu, Y. Liu, J. B. Baek and L. Dai, ACS Nano, 2010, 4, 1321 CrossRef CAS PubMed.
- V. G. Khomenko, V. Z. Barsukov and A. S. Katashinskii, Electrochim. Acta, 2005, 50, 1675 CrossRef CAS.
- B. Winther-Jensen, O. Winther-Jensen, M. Forsyth and D. R. Macfarlane, Science, 2008, 321, 671 CrossRef CAS PubMed.
- G. Wu, K. L. More, C. M. Johnston and P. Zelenay, Science, 2011, 332, 443 CrossRef CAS PubMed.
- M. Hilder, B. Winther-Jensen and N. B. Clark, J. Power Sources, 2009, 194, 1135 CrossRef CAS.
- P. P. Cottis, D. Evans, M. Fabretto, S. Pering, P. Murphy and P. Hojati-Talemi, RSC Adv., 2014, 4, 9819 RSC.
- V. G. Khomenko, K. V. Lykhnytskyi and V. Z. Barsukov, Electrochim. Acta, 2013, 104, 391 CrossRef CAS.
- M. Zhang, W. Yuan, B. Yao, C. Li and G. Shi, ACS Appl. Mater. Interfaces, 2014, 6, 3587 CAS.
- R. Kerr, C. Pozo-Gonzalo, M. Forsyth and B. Winther-Jensen, Electrochim. Acta, 2015, 154, 142 CrossRef CAS.
- B. Winther-Jensen, D. W. Breiby and K. West, Synth. Met., 2005, 152, 1 CrossRef CAS.
- S. K. Jönsson, J. Birgerson, X. Crispin, G. Greczynski, W. Osikowicz, A. W. Denier van der Gon, W. R. Salaneck and M. Fahlman, Synth. Met., 2003, 139, 1 CrossRef.
- O. Bubnova, Z. U. Khan, H. Wang, S. Braun, D. R. Evans, M. Fabretto, P. Hojati-Talemi, D. Dagnelund, J.-B. Arlin, Y. H. Geerts, S. Desbief, D. W. Breiby, J. W. Andreasen, R. Lazzaroni, W. M. Chen, I. Zozoulenko, M. Fahlman, P. J. Murphy, M. Berggren and X. Crispin, Nat. Mater., 2014, 13, 190 CrossRef CAS PubMed.
- W. Domagala, B. Pilawa and M. Lapkowski, Electrochim. Acta, 2008, 53, 4580 CrossRef CAS.
- Z. U. Khan, O. Bubnova, M. J. Jafari, R. Brooke, X. Liu, R. Gabrielsson, T. Ederth, D. R. Evans, J. W. Andreasen, M. Fahlman and X. Crispin, J. Mater. Chem. C, 2015, 3, 10616 RSC.
- T. Johansson, L. A. A. Pettersson and O. Inganäs, Synth. Met., 2002, 129, 269 CrossRef CAS.
- H. Neugebaur, G. Nauer, A. Neckel, G. Tourillon, F. Garnier and P. Lang, J. Phys. Chem., 1984, 88, 652 CrossRef.
- J. F. Rabolt, T. C. Clarke and G. B. Street, J. Chem. Phys., 1979, 71, 4614 CrossRef CAS.
- C. Kvarnström, H. Neugebauer, S. Blomquist, H. J. Ahonen, J. Kankare, A. Ivaska and N. S. Sariciftci, Electrochim. Acta, 1999, 44, 2739 CrossRef.
- P. Damlin, C. Kvarnström and A. Ivaska, J. Electroanal. Chem., 2004, 570, 113 CrossRef CAS.
- S. Garreau, G. Louarn, J. P. Buisson, G. Froyer and S. Lefrant, Macromolecules, 1999, 32, 6807 CrossRef CAS.
- S. Marciniak, X. Crispin, K. Uvdal, M. Trzcinski, J. Birgerson, L. Groenendaal, F. Louwet and W. R. Salaneck, Synth. Met., 2004, 141, 67 CrossRef CAS.
- P. Tehrani, A. Kanciurzewska, X. Crispin, N. Robinson, M. Fahlman and M. Berggren, Solid State Ionics, 2007, 177, 3521 CrossRef CAS.
- D. M. de Leeuw, M. M. J. Simenon, A. R. Brown and R. E. F. Einerhand, Synth. Met., 1997, 87, 53 CrossRef CAS.
Footnote |
| † Electronic supplementary information (ESI) available: XPS wide scan, electrochemical setups for chronoamperometric and in situ resistometry measurements, chronoamperometric measurements and raw data of in situ resistometry. See DOI: 10.1039/c6ta10521a |
| This journal is © The Royal Society of Chemistry 2017 |