
 Open Access Article
 This Open Access Article is licensed under a
 Creative Commons Attribution 3.0 Unported Licence
A sol–gel route to titanium nitride conductive coatings on battery materials and performance of TiN-coated LiFePO4†
Min
Zhang
,
Nuria
Garcia-Araez
*,
Andrew L.
Hector
 * and
John R.
Owen
* and
John R.
Owen
Chemistry, University of Southampton, Highfield, Southampton SO17 1BJ, UK. E-mail: N.Garcia-Araez@soton.ac.uk; A.L.Hector@soton.ac.uk
First published on 3rd January 2017
Abstract
New approaches to produce nanocrystalline TiN materials with high conductivity and their application as conductive coatings on battery materials have been developed. Sol–gel synthesis routes using tetrakis(dimethylamido)titanium(IV) and a propylamine or ammonia cross linking agent, followed by thermal treatment under NH3 or H2 + N2, were found to produce TiN powders of small crystallite size (<10 nm), with good conductivity in selected cases. The most promising synthesis conditions were used to produce even TiN coatings on LiFePO4 particles, and the resulting materials exhibited significantly improved electrochemical performance relative to uncoated LiFePO4, in terms of higher specific capacity, cycle stability and rate capability. The material with the optimum 10 wt% TiN content exhibited a discharge capacity of 159 mA h g−1, that is ∼93% of the theoretical capacity, when charge/discharge rates of 0.1C were applied. The results demonstrate the suitability of this new route to produce TiN coatings, which could also be applied to high voltage materials or for materials to be operated at high temperatures, where corrosion or degradation of other coating materials (e.g. carbon) would be problematic.
Introduction
Metal nitrides have been studied as electrode materials for batteries and supercapacitors in their own right for some years.1 However, they have also been combined with other electrode materials to form structured composites with improved conductivity and stability relative to the active electrode material itself.2–5 TiN is suitable for these purposes as it possesses good electrical conductivity, low cost, and good chemical and thermal stability.6,7 For example, Kim and co-workers reported good electrochemical performance in Si/TiN nanocomposites in which the electrochemically inactive TiN acts to maintain the stability of the nanocomposite during cycling as silicon undergoes volumetric change.4 Li4Ti5O12 suffers from poor electronic conductivity, but DeSisto et al. showed that atomic layer deposition of TiN coatings onto Li4Ti5O12 powder improved the electronic conductivity to deliver a higher capacity (162 mA h g−1) and cycling stability compared with that of uncoated Li4Ti5O12 (133 mA h g−1).5Many methods have been developed to synthesise metal nitrides, from elemental combination, including at high pressure,8 to ammonolysis of oxides and other binary compounds,9 vapour deposition of films,10 solid state metathesis and solvothermal reactions,11,12 reactions of molecular precursors and sol–gel processing.13,14 Sol–gel methods have been shown to be highly effective, low cost routes to nitride materials and are versatile in the preparation of high surface area materials or porous structures.15,16 Ammonia can be used to cross-link precursor molecules via transamination reactions to produce materials such as nanocrystalline TiN,17,18 but we have shown that to process films13 and for controlled morphologies such as polymer sphere templated inverse opals19,20 the use of a primary amine as the crosslinking agent can be particularly effective. The advantage for battery material coatings is that the use of a sol–gel route could be a scalable with efficient material usage compared with vapour phase coating methods.
The ordered olivine structured LiFePO4 has been intensively investigated as a cathode material in lithium-ion batteries due to its flat voltage profile, high theoretical capacity of 170 mA h g−1, safety, low cost and environment benignity.21–24 However, the low intrinsic electronic conductivity (∼10−8 to 10−10 S cm−1) and lithium-ion diffusivity (∼10−18 cm2 s−1) of LiFePO4 are major obstacles which originally limited its practical applications.25–27 Approaches to ameliorate these drawbacks have included cation doping,28–31 particle size reduction,32,33 carbon coating34–36 and non-carbon second phase modification.37,38 Carbon coating has become the standard method to enhance the electronic conductivity of LiFePO4 particles. However, carbon layers have low density (2.2 g cm−3) and this may reduce the tap density of LiFePO4 (3.6 g cm−3), leading to reduced volumetric energy density of the lithium ion battery electrodes.39,40 Other electrode materials such as LiMnPO4, LiCoPO4, LiNiPO4, LiMn2O4 and Li4Ti5O12 also suffer from poor electrical conductivity and can benefit from coating to enhance electron transport.41
New processes to produce conductive coatings could improve battery performance by providing alternatives to carbon. Whilst carbon-coated LiFePO4 is highly optimised and is in commercial use,42,43 other materials such as TiN could provide better stability with high voltage materials or in cells that are more stable at elevated temperature.1,44 TiN could provide more effective protection from chemical attack by HF produced by electrolyte decomposition and thus suppress the dissolution of Fe from LiFePO4 in LiPF6 based electrolytes.38,40 Since LiFePO4 is well understood but dependent on conductive coatings it provides an effective test bed for new coating materials. Hence in this work we have investigated possible sol–gel approaches to TiN coatings on battery materials, the feasibility of transferring these methods to LiFePO4 particles and the electrochemical performance of TiN coated LiFePO4.
Experimental
Synthesis
Titanium amides and the sol–gel intermediates were handled under nitrogen using glove box or Schlenk line methods. Two main methods were used to produce TiN based on literature routes using ammonia18 or propylamine20 cross-linking agents:(1) Ti(NMe2)4 (2.65 cm3, 11.2 mmol, Epichem) was dissolved in dry THF (20 cm3, distilled from sodium/benzophenone). Liquid NH3 (∼20 cm3) was distilled from a sodium/ammonia solution into the stirred amide solution cooled to −78 °C. A bright yellow precipitate appeared on first exposure of the solution to ammonia, which turned brown and then black as the ammonia was allowed to evaporate and the temperature approached ambient.
(2) Ti(NMe2)4 (2.65 cm3, 11.2 mmol) was dissolved in dry THF (7.5 cm3). nPrNH2 (1.84 cm3, 22.4 mmol, distilled from BaO) was slowly added. The solution gradually changed colour from yellow to red-orange.
Both sol types were stirred at room temperature overnight and then pumped off to form viscous gels. These were then heated under a flow of NH3 (dried with a column of molecular sieves) or 5% H2 in N2 at 3 °C min−1 to 650 °C and maintained for 6 h before cooling. The products were black powders, or a metallic red monolith from the propylamine crosslinked gel heated in ammonia. Both types were ground in a pestle and mortar before further characterisation.
LiFePO4 was prepared by a literature hydrothermal method.45 LiOH·H2O (6.29 g, 0.15 mol, 98% purity, Fisher Scientific) was dissolved in deionised water (45 cm3), and H3PO4 aqueous solution (3.77 cm3, 0.05 mol, 85.3 wt% assay, Fisher Scientific) was added. FeSO4·7H2O (13.90 g, 0.05 mol, >99% purity, ACROS Organics) was dissolved in water (45 cm3) and added slowly to the LiOH solution with constant stirring, during which time a light green suspension formed. The precursor solution was heated in a Parr 4748 Teflon-lined autoclave (125 cm3) at 180 °C for 6 h. The precipitate was then washed with deionized water and ethanol, and dried at 80 °C for 5 h under vacuum. The resulting material, which we have designated LFP(HT), was heated at 3 °C min−1 to 650 °C and maintained for 6 h under ammonia or 5% H2/N2 to crystallise LiFePO4.
TiN modified LiFePO4 powders were prepared using a variation of the propylamine cross-linking sol–gel method described above, with the sol prepared from 0.21 cm3 Ti(NMe2)4, 7.5 cm3 THF and 0.15 cm3 propylamine. 0.5 g dry LFP(HT) or fired LiFePO4 was added just before the propylamine. The suspension was stirred at room temperature for ∼16 h and dried in vacuo to form a sticky powder. This was heated under ammonia or 5% H2/N2 as described above for TiN samples.
Characterisation and electrochemistry
Powder X-ray diffraction used a Bruker D2 Phaser with CuKα radiation, and data was fitted using the GSAS package.46 Scanning electron microscopy was carried out with a Philips XL-30 ESEM (20 kV) and energy-dispersive X-ray (EDX) analysis with a Thermofisher Ultradry detector with Noran System 7 processing. Transmission electron microscopy used a FEI Tecnai T12 (120 kV). Combustion (C, H, N) analysis was outsourced to Medac Ltd. Electrochemical testing used a Biologics VMP-2 multichannel potentiostat.Conductivity measurements were carried out on TiN pellets made by manually mixing 0.2 g TiN powder with PTFE (0.02 g) in a pestle and mortar. The resulting solid lump was hand rolled (Durston Rolling Mill) into a film and cut into disks with diameter of 10 mm, and then the pellet was assembled into a Swagelok cell without any electrolyte. Cyclic voltammograms (CV) were collected at 20 mV s−1 over the range of −0.3 to +0.3 V (−0.1 to +0.1 V for more conductive samples) at room temperature.
Electrodes for use in lithium half cells were prepared by mixing the LiFePO4 or TiN coated LiFePO4 powder (80 wt%) with acetylene black (10 wt%) and poly(vinylidene fluoride) (10 wt%) dissolved in N-methyl-pyrrolidone. The slurry was cast onto Al foil (125 μm thick, temper annealed, 99.0% purity, Advent Research Materials) and dried at 120 °C in vacuo for 12 h. The foil was cut into circular discs with a diameter of 1 cm and pressed at 10 tons to obtain the cathode with a typical mass of ∼0.037 g. Swagelok cells were assembled in an argon-filled glove box with lithium foil (Rockwood Lithium GmbH) anodes and glass microfiber filter (Whatman, GF/F grade) separators soaked in 8 drops of 1 mol dm−3 LiPF6 in ethylene carbonate/dimethyl carbonate (EC![[thin space (1/6-em)]](https://www.rsc.org/images/entities/char_2009.gif) :DMC = 1:1 in volume) electrolyte (BASF, LP30). Galvanostatic testing was carried out (at least in duplicate) at 25 °C at various rates of charge/discharge (e.g. 0.1C is a current calculated for 0.1× the theoretical capacity per hour) within the voltage range of 2.5–4.5 V (vs. Li+/Li).
:DMC = 1:1 in volume) electrolyte (BASF, LP30). Galvanostatic testing was carried out (at least in duplicate) at 25 °C at various rates of charge/discharge (e.g. 0.1C is a current calculated for 0.1× the theoretical capacity per hour) within the voltage range of 2.5–4.5 V (vs. Li+/Li).
Results and discussion
Titanium nitride was initially made by two different sol–gel routes, then the route that led to the more conductive nanocrystalline material was used to coat LiFePO4 with a variety of processing conditions and thicknesses.Synthesis, microstructure and electrochemistry of TiN
The sol–gel routes to TiN employed Ti(NMe2)4 with either propylamine or ammonia as the cross-linking agent (Scheme 1). We have previously used these routes to produce TiN in nanocrystalline form and shown that it can be produced at a range of temperatures,13,18,47 but here we have fired samples under conditions relevant to the production of coated LiFePO4. The crystallisation temperature affects purity, crystallite/particle size distribution and discharge capacity of LiFePO4,51–53 but most successful studies produce LiFePO4 samples at 600–700 °C.39,54,55 In this study samples were fired at 650 °C. Heating in ammonia minimises the amount of carbon incorporated into the samples but may result in residual surface amide groups that could reduce the stability of the material and the conductivity. These may be removed by cooling in argon. LiFePO4 is typically made in a dilute hydrogen stream,48,49 but when used to fire TiN this is likely to result in more ligand pyrolysis and carbon incorporation either as carbonitride or a separate phase. All three approaches were used. The samples were characterized by X-ray diffraction, electrochemical measurements of the effective conductivity, TEM and elemental analysis, and the main results are summarized in Table 1.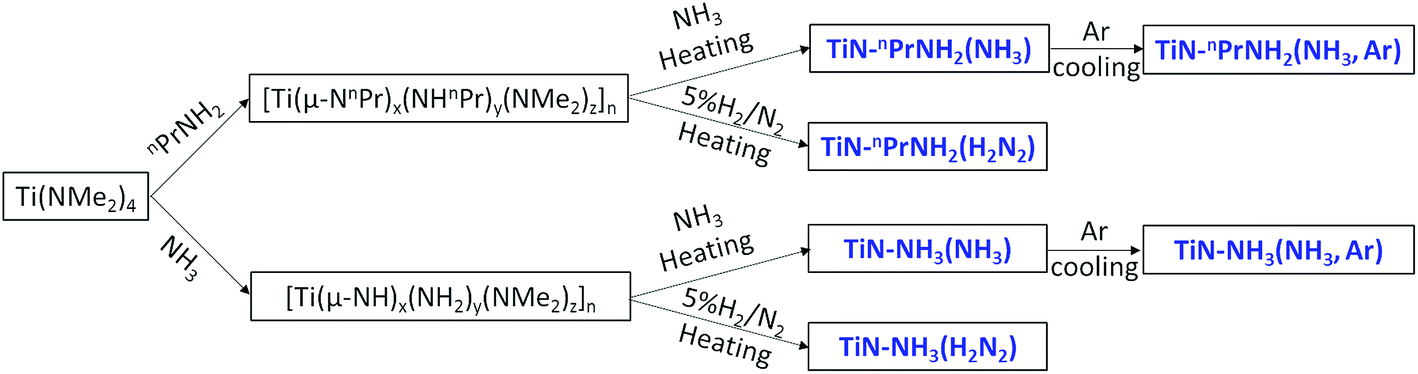 | ||
| Scheme 1 n PrNH2- or NH3-based sol–gel routes to TiN and sample labels. | ||
| Sample | a/Å | Crystallite size/nm | %C | %H | %N | Conductivity/S m−1 |
|---|---|---|---|---|---|---|
| TiN–nPrNH2(NH3) | 4.2349(2) | 9.57(6) | 1.55 | <0.10 | 21.26 | 5.5 |
| TiN–nPrNH2(NH3, Ar) | 4.2336(2) | 9.89(6) | 1.29 | <0.10 | 21.31 | 7.9 |
| TiN–nPrNH2(H2N2) | 4.2359(11) | 5.02(16) | 20.70 | 1.18 | 16.15 | 1.1 × 10⁻⁴ |
| TiN–NH3(NH3) | 4.2237(2) | 8.47(7) | 2.53 | 1.49 | 16.43 | 7.7 × 10⁻³ |
| TiN–NH3(NH3, Ar) | 4.2220(3) | 7.00(7) | 0.55 | 1.25 | 18.65 | 1.3 × 10⁻¹ |
| TiN–NH3(H2N2) | 4.2350(11) | 7.61(23) | 5.36 | 1.25 | 15.65 | 1.7 × 10⁻² |
All the X-ray diffraction peaks of the resulting TiN samples (Fig. 1) can be indexed to the standard cubic TiN structure (JCPDS card no. 65-0414). Table 1 shows the crystallographic data of TiN series samples. The Rietveld fits (Fig. S1†) to this XRD data resulted in similar lattice parameters (Table 1) to those in the literature for TiN.50 The peak broadening in the Rietveld fit indicated average TiN crystallite sizes of 5–10 nm. These were consistent with TEM images (Fig. S2†), which showed aggregates of particles within the same size range. These small sizes are important for coating of battery materials and are probably necessary to evenly coat particles that may only be tens or hundreds of nm in size.
 | ||
| Fig. 1 XRD patterns of TiN series samples prepared using the propylamine or NH3 based sol–gel routes and heated to 650 °C under different atmospheres (labels explained in Scheme 1). The black stick pattern denotes the literature TiN reflection positions and intensities. | ||
The propylamine-derived sample heated in 5% H2/N2 (TiN–nPrNH2(H2N2)) contained more carbon (20.7 wt%) than those heated in ammonia. This sample had the smallest crystallite size of 5.02(16) nm. The TEM image in Fig. S2† shows an amorphous layer on its surface which is likely to be carbon, but since no carbon diffraction peaks are observed the carbon must be amorphous. All samples heated in NH3 have C contents of 2.5% or less. Incorporation of carbon into the rocksalt lattice to make Ti(C,N) compositions occurs readily and where small amounts of carbon are in the sample it is likely to be in the lattice. The carbonitrides are also good conductors and this is unlikely to reduce functionality. TiN–nPrNH2(H2N2) and all the ammonia crosslinked samples also had high hydrogen contents. This suggests the presence of alkyl or amide/imide groups, which may reduce the conductivity of the materials.
In order to evaluate the conductivity that TiN samples would produce in a composite electrode, TiN samples were mixed with PTFE binder and calendared to produce self-standing TiN disks, which were dry contacted with two cylindrical pistons in a Swagelok cell and cyclic voltammograms measured to observe the current–voltage profile. The conductivity of TiN was calculated based on C = SA/l, where C (mA V−1) is the conductance of the pellet, S (S m−1) is the conductivity of the TiN, A (mm2) is the cross-sectional area of the TiN pellet, and l (mm) is the thickness of the TiN pellet. The measured conductivities in Table 1 were calculated from the current–potential plots shown in Fig. 2 and S3.† As expected the propylamine crosslinked samples heated in ammonia, where hydrogen contents were low, had significantly higher conductivities. Replacing the gas flow with Ar after heating improved the conductivity a little, but it was a small effect. High conductivities were only achieved with the propylamine crosslinker so coating of LiFePO4 was attempted using this system.
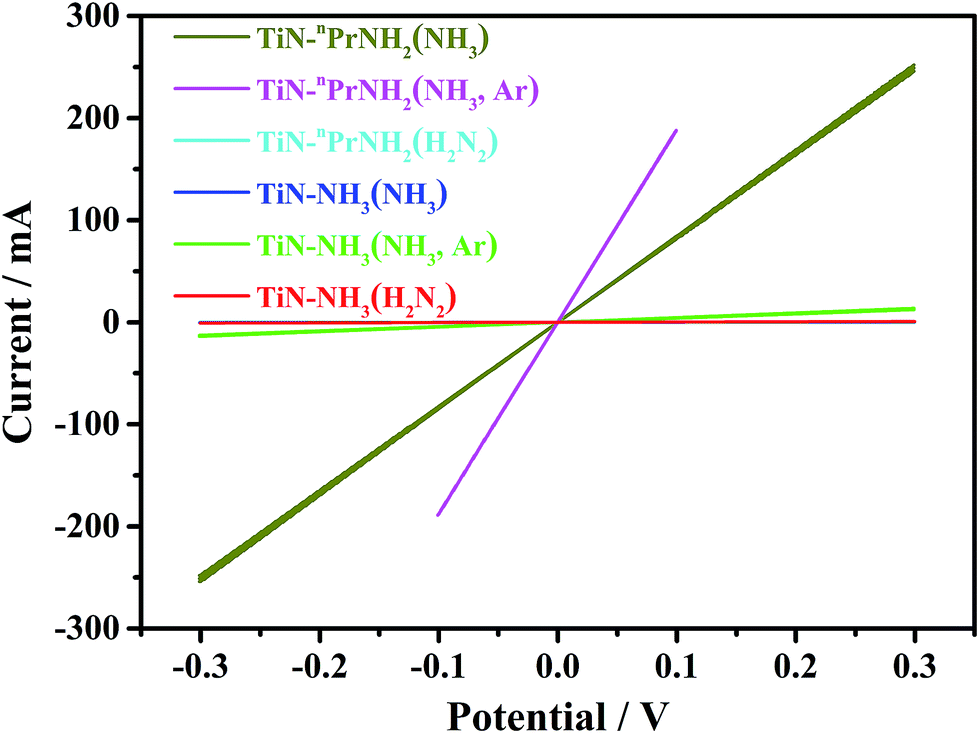 | ||
| Fig. 2 Current–potential plots (3 cycles each) for dry TiN samples at scanning rate of 20 mV s−1, showing the ohmic behaviour of the samples (labels explained in Scheme 1). Note that the cyan and blue lines are coincident with the red line. | ||
Effect of heating environment on LiFePO4
TiN from the chosen propylamine crosslinking route was found to be more conductive when fired in ammonia (Table 1). Uncoated LiFePO4 was produced with firing in ammonia or in the more typical dilute hydrogen,48,49 to check whether heating in ammonia caused a deterioration in the LiFePO4 properties. Scheme 2 shows the sample labels used for different sample types.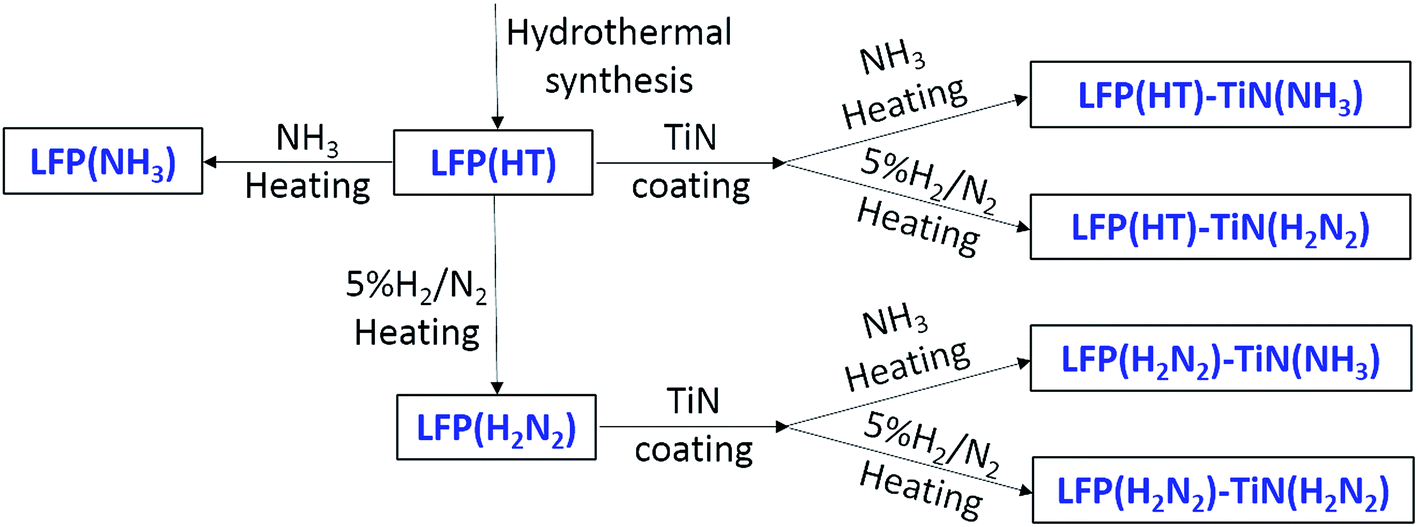 | ||
| Scheme 2 Preparation conditions and sample labels for TiN-coated LiFePO4 materials. | ||
All the X-ray diffraction peaks of LiFePO4 produced by heating the hydrothermal product (LFP(HT)) at 650 °C under 5% H2/N2 (Fig. 3) were consistent with the standard olivine LiFePO4 structure (JCPDS card no. 40-1499, space group Pnma) as expected. The lattice parameters obtained from Rietveld fitting (Fig. S4 and Table S1†) are very close to the literature value.56 LFP(HT) was also heated at temperatures between 450 and 750 °C under NH3 to investigate any effects on the microstructure of LiFePO4. The XRD patterns of these samples are shown in Fig. 3 and S5.† Very little change is observed, with no secondary phases and very little variation in the lattice parameters from the Rietveld fits (Table S1†). Hence heating in NH3 at temperatures up to 750 °C does not affect the crystal structure of LiFePO4.
 | ||
| Fig. 3 (a) XRD patterns of LiFePO4 samples heated under 5% H2/N2 and NH3, respectively, at 650 °C (labels explained in Scheme 2). The black stick pattern denotes the literature positions and intensities of LiFePO4 reflections. (b) The initial cycle voltage profile vs. specific capacity and (c) specific capacity vs. cycle number of the same materials in Li half cells, cycled between 2.5 and 4.5 V for 20 cycles at a current rate of 0.1C. | ||
The electrochemical performance of uncoated LiFePO4 is expected to be poor because of its low electronic conductivity.25,57 Cui et al.58 reported similar LiFePO4 samples to have a capacity of 96 mA h g−1 at 0.1C and that this capacity drops quickly with cycling, especially at high rates. Fig. 3 shows the initial charge/discharge curves at 0.1C and cycle stability of the samples produced at 650 °C. In addition to the expected plateau at ∼3.5 V an additional plateau at ∼4 V was observed in the initial charge curve of the material produced in 5% H2/N2. The amount of charge associated with the feature faded over subsequent cycles and may be due to the poor conductivity of the electrode or an initial incomplete dispersion of the electrolyte into the electrode.59,60 The initial discharge capacities of LFP(H2N2) and LFP(NH3) were 108.3 and 93.1 mA h g−1, respectively, suggesting that ammonia heating results in a poorer material. However, the capacity of LFP(NH3) increased slightly to 96.3 mA h g−1 over 20 cycles, whereas the capacity of LFP(H2N2) faded to 80.8 mA h g−1 over the same number of cycles. Overall this suggested that ammonia is a valid environment for the crystallisation of LiFePO4, but since the results were somewhat similar both heating environments were carried forward to the TiN-coated LiFePO4 samples.
Synthesis, microstructure and electrochemistry of TiN-coated LiFePO4
Two forms of LiFePO4 were selected for coating, the uncrystallised material directly after the hydrothermal synthesis, giving the possibility of just one heating step, and the material already crystallised under 5% H2/N2 (Scheme 2). These were coated using a propylamine-crosslinked sol and the solvent was removed in vacuo. The resulting samples were then fired at 650 °C for 6 h under 5% H2/N2 or ammonia, leading to black solids.The diffraction patterns of all of the LiFePO4 samples coated with 10% TiN (based on amount of Ti(NMe2)4 used in preparing the coating sol) were dominated by reflections due to LiFePO4 (Fig. S5†). Rietveld fits to these data (Fig. 4 and S6†) yielded typical LiFePO4 lattice parameters (Table S2†), suggesting that the TiN coating process did not cause any chemical change to the LiFePO4. The average LiFePO4 crystallite sizes were 123–175 nm. Broad reflections matching the expected peak positions for TiN could be observed by close inspection of the difference plots in Rietveld fits where only the LiFePO4 intensity was modelled (Fig. 4b, red line). However, these were only distinct enough to fit in the case of the sample produced from pre-fired LiFePO4 and then fired under ammonia after coating (Fig. 4). The two phase fit (including LiFePO4 and TiN) resulted in a flatter difference line and an improvement in the fit statistics, with Rwp reducing from 0.79% to 0.72% (Fig. 4b, blue line). The refined TiN lattice parameter was 4.217(5) Å, close to that of the TiN samples (Table 1). The TiN crystallite size was refined as 2.6(1) nm, significantly smaller than in the bulk TiN samples and potentially useful for producing an even coating on the small LiFePO4 particles. The refined TiN phase fraction was 9.7(6)%, close to the 10% TiN content expected from the Ti(NMe2)4 content of the sol.
 | ||
Fig. 4 (a) Rietveld fit (Rwp = 0.72% and Rp = 0.53%) to the XRD pattern of LFP(H2N2)–TiN(NH3) (sample labels explained in Scheme 2, 10% TiN). The data points and Rietveld fit are overlaid in black crosses and a red line, respectively. The difference plot is shown in blue. The pink and cyan tick marks represent the allowed reflection positions for LiFePO4 with space group Pnma and for TiN with space group Fm![[3 with combining macron]](https://www.rsc.org/images/entities/char_0033_0304.gif) m, respectively. (b) The difference lines in the 2-phase (LiFePO4 and TiN) and 1-phase (LiFePO4) Rietveld fits to the same XRD pattern. m, respectively. (b) The difference lines in the 2-phase (LiFePO4 and TiN) and 1-phase (LiFePO4) Rietveld fits to the same XRD pattern. | ||
The electrochemical performance of TiN-coated LiFePO4 samples was assessed by galvanostatic cycling of Li half cells. The initial cycle charge/discharge curves and the variations in discharge capacity over the first 20 cycles are shown in Fig. 5. LFP(HT)–TiN(H2N2) and LFP(H2N2)–TiN(NH3) had the largest initial discharge capacities of 145 and 150 mA h g−1, respectively. The TiN sample produced with nPrNH2 and fired in 5% H2/N2 contained 20.7 wt% carbon and the TiN-coated LiFePO4 samples produced under these conditions can be expected to contain some carbon, which may play the role of a conductive additive. The capacity of LFP(HT)–TiN(H2N2) drops to 133 mA h g−1 after 20 cycles whereas LFP(H2N2)–TiN(NH3) retains 145 mA h g−1 after 20 cycles. This material performed significantly better than the uncoated LiFePO4, suggesting that the TiN is providing the required improvement in the electronic conductivity of the composite powders.
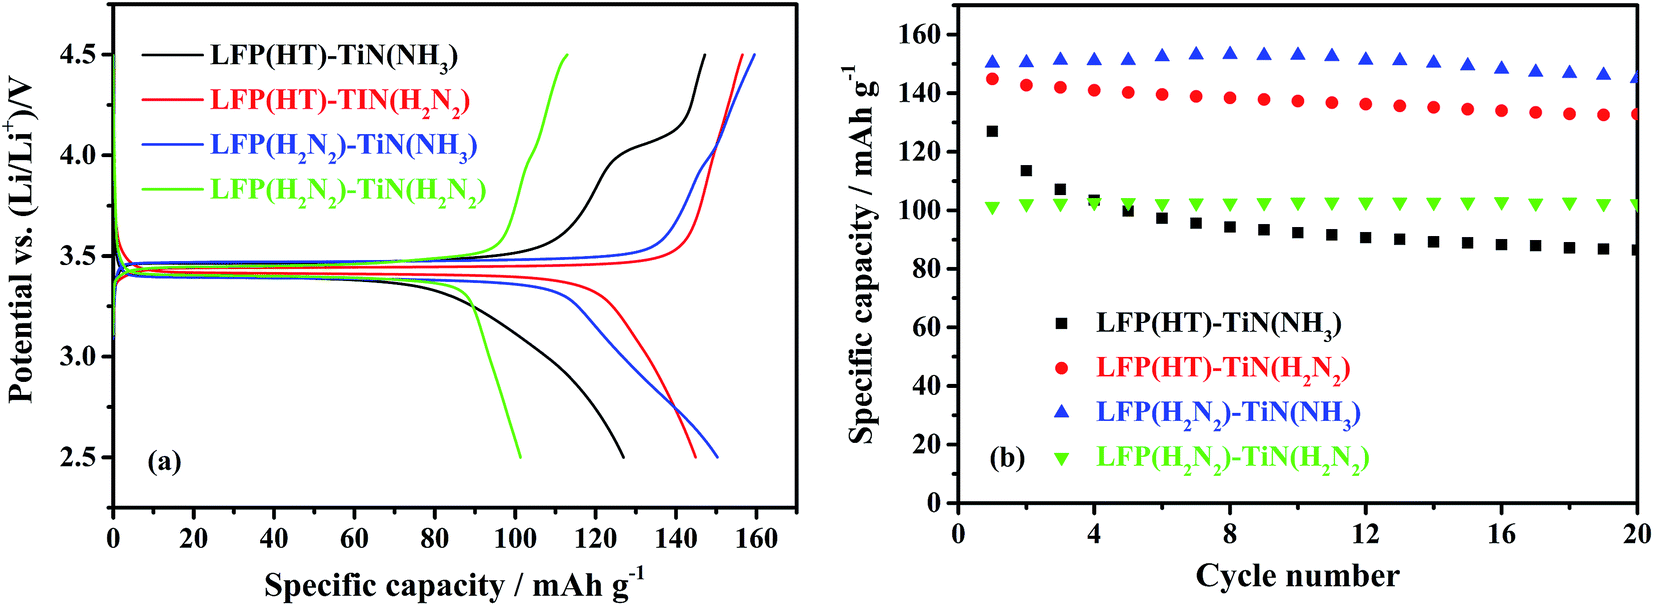 | ||
| Fig. 5 The initial cycle of voltage profile against specific capacity (a) and specific capacity versus cycle number (b) of TiN-coated LiFePO4/Li half cells, under galvanostatic cycling between 2.5 and 4.5 V at 0.1C (sample labels explained in Scheme 2, 10% TiN). | ||
TEM images of LFP(H2N2)–TiN(NH3) (Fig. 6) showed LiFePO4 particles with TiN nanoparticles distributed across the LiFePO4 surface. Where particles were aggregated the TiN particles acted to separate the LiFePO4 particles. The presence of the TiN on the surface provides a conducting network between the particles and this is also reflected in the electrochemical performance discussed above. Coatings are also important to prevent Fe2+ dissolution from LiFePO4, which limits degradation of the charge/discharge performance.38,40 Fig. S7† shows the EDS analysis of LFP(H2N2)–TiN(NH3), which confirms the presence of Ti on the LiFePO4, with a 9.5 wt% TiN content calculated from the Ti:Fe ratio. The combustion analysis of this sample showed it to contain 0.55% C, <0.10% H and 1.78% N. A sample containing 10% TiN would contain 2.26% N, a value that is close to the carbon and nitrogen content of this sample combined. Hence the coating is probably a carbonitride of approximate composition TiC0.25N0.75.
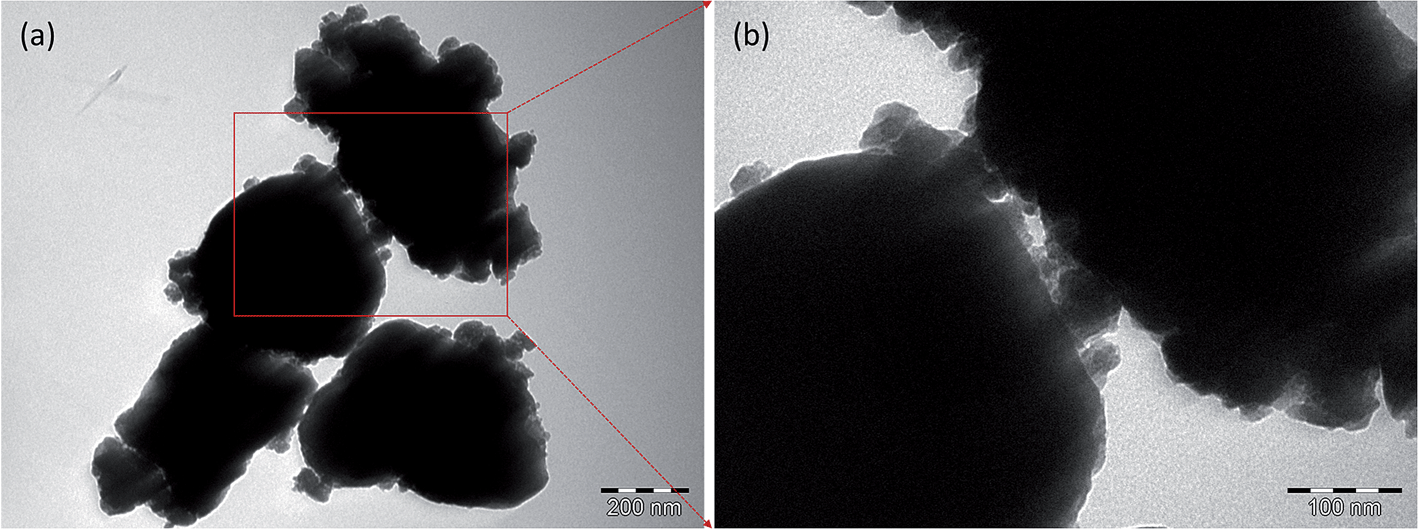 | ||
| Fig. 6 TEM images of LFP(H2N2)–TiN(NH3) ((a), scale bar = 200 nm, 10% TiN) and enlarged view of the region marked by the red box ((b), scale bar = 100 nm). Sample labels are explained in Scheme 2. | ||
The 10% TiN compositions described above were initially studied based on producing a coating of similar thickness to a typical carbon coating, which is typically 5–8% C, a lower content by mass because carbon is less dense.42,61 For LFP(H2N2)–TiN(NH3), which was the highest capacity material at 10% TiN, variations in the TiN content of the composites were examined. The initial charge/discharge curves of materials containing 0%, 2.5%, 5%, 7.5%, 10% and 12.5% TiN are shown in Fig. 7, with initial discharge capacities of 108, 112, 129, 132, 150 and 142 mA h g−1, respectively. These results support the original assumption that 10% TiN is optimal, probably because this amount is needed to make a fairly continuous conductive network. The drop in capacity at 12.5% suggests that the TiN may then be starting to hinder lithium diffusion.
 | ||
| Fig. 7 The initial cycle of voltage profile against specific capacity (a) and specific capacity versus cycle number (b) of TiN-coated LiFePO4/Li half cells under galvanostatic cycling between 2.5 and 4.5 V at 0.1C (sample labels explained in Scheme 2, with the percentage of TiN in the composite written after the hyphen). | ||
Fig. 7 also shows the variation in discharge capacity over 50 cycles of LFP(H2N2)–TiN(NH3) samples with various TiN contents. The discharge capacity of LFP(H2N2)–10TiN(NH3) decayed gradually with continuous cycling, retaining 123 mA h g−1 after 50 cycles, 82% of its initial capacity. The discharge capacity of the uncoated material faded to 68 mA h g−1 over 50 cycles, a 37% capacity loss. It is well-established that the dissolution of Fe from LiFePO4 in LiPF6 electrolyte causes capacity fade.25 The improvement in cycle performance of LFP(H2N2)–10TiN(NH3) relative to the uncoated material suggests that TiN modification on the surface of LiFePO4 is impeding erosion of the active material by the electrolyte.38,40Fig. 6 shows that the coatings are still not continuous, so it is possible that further refinement of the coating method could deliver further improvements.
Coating LiFePO4 was intended to improve its performance by improving conductivity and surface stability, but TiN itself can undergo conversion reactions at low potential1 so we checked whether it was contributing to the capacity. Hence TiN–nPrNH2(NH3) was treated as the active material to test this contribution. TiN electrodes were produced with acetylene black and a PVDF binder in exactly the same way as the TiN-coated LiFePO4 samples and assembled into lithium half-cells. The cyclic voltammetry over the potential range in which the TiN–LiFePO4 cells are operated (Fig. S8†) shows small currents and very little change over 100 cycles of CV testing. This result is confirmed by the voltage profile vs. specific capacity during galvanostatic cycling (Fig. S8†). This experiment was carried out at a current rate of 170 mA g−1 of TiN, 10× that used in the 90% LiFePO4/10% TiN electrodes, in order to keep the specific current relative to the TiN content the same. TiN–nPrNH2(NH3) had a very low initial specific capacity of 0.46 mA h g−1, and this remained lower than 0.5 mA h g−1 after 100 cycles. Hence the TiN was found to be electrochemically inert, confirming its action was mainly on the conductivity.
Fig. 8 shows the discharge capacity of selected samples at faster charge/discharge rates. The higher discharge capacities in the sample containing 10% TiN were maintained at these higher rates, with average capacities (over 5 cycles each) of 159, 149, 130, 109 and 89 mA h g−1 found at 0.1C, 0.2C, 0.5C, 1C and 2C, respectively. The capacity plot vs. inverse scan rate does not plateau, showing that at still lower scan rates further capacity would be available. According to Huang,62 the capacity is most affected by the supply of electrons at high rates and hence this is the regime in which a low charge transfer resistance is most critical. Hu et al. found that carbon coating on porous LiFePO4 works well for lithium insertion at low current rates but does not at high current rates because of the insufficient electronically conducting network.63 Using nanometer-sized RuO2 as an oxidic interconnect, the kinetics and rate capability of the composite were significantly improved. Lu et al. reported a simple approach to enhance the electrical conductivity of olivine-structured LiFePO4 thin films by uniformly dispersing small fractions of highly conductive silver throughout the LiFePO4 film.64 The as-obtained 200 nm-thick LiFePO4–Ag composite thin films provided a reversible discharge capacity of 46.3 μA h μm−1 cm−2 (>135 mA h g−1) at a current density of 8 μA cm−2 (ca. 0.7C). The observation that the capacity of LFP(H2N2)–10TiN(NH3) drops quite significantly at higher rates suggests that the TiN coatings are not yet fully optimised to provide the fastest kinetics, but it is promising that our capacities at similar rates (130 mA h g−1 at 0.5C; 109 mA h g−1 at 1C) are comparable.
 | ||
| Fig. 8 The discharge specific capacity vs. cycle number (left) and plot of the average capacity in those groups vs. inverse cycle number (right) of uncoated and TiN coated LiFePO4 in Li half cells, cycled at various sequential rates from 0.1C to 5C, between 2.5 and 4.5 V over 30 cycles (sample codes are described in Scheme 2, with the % TiN noted after the hyphen). | ||
Since the olivine LiFePO4 was reported by Goodenough and co-workers in 1997,65 many researchers have tried to improve the performance of LiFePO4 by coating with carbon, metals or metal oxides to improve electronic conductivity.34,35,37,38,63,64 Well optimised carbon coatings allow 90% of its theoretical capacity to be used with acceptable rate capabilities.22,66 The novel propylamine cross-linking based sol–gel method to produce TiN coatings on LiFePO4 described herein already delivers a significant fraction of the electrochemical performance that is currently achieved with carbon after several years of intense activity. It appears to both increase the electronic conductivity of the LiFePO4 to deliver higher capacities than the uncoated material, and to reduce corrosion due to iron dissolution and hence retain a larger fraction of the initial capacity during continuous cycling. We note that our sol–gel process transfers close to 100% (mechanical losses only) of the titanium precursor to the TiN/LiFePO4 composite so has a lower precursor cost than more wasteful CVD or ALD approaches. However, TiN will always be a more costly coating material than carbon and would not be expected to replace it in standard applications. It may have advantages for battery materials run under non-standard conditions where carbon coatings may be unstable, e.g. with high voltage electrode materials or for cells that need to be able to operate at high temperature. Now that the system has been benchmarked with LiFePO4, future work will examine these areas.
Conclusions
Sol–gel approaches to the coating of battery materials with titanium nitride have been explored. A propylamine cross-linking method gave higher electronic conductivity materials than ammonia cross-linking, and hence was used to produce the coatings. Firing in ammonia also resulted in lower carbon contents, so LiFePO4 was examined after firing in ammonia and found to be comparable with the material fired more conventionally in a dilute hydrogen mix. TiN-coated LiFePO4 performed well as an electrode material in lithium half cells, with capacities, cycling performance and rate capabilities in the best cases that were competitive with other coating materials. LiFePO4 modified with 10 wt% TiN from the propylamine cross-linking method and fired in ammonia exhibits a maximum discharge capacity of 159 mA h g−1, that is 93% of the theoretical capacity (170 mA h g−1), at the rate of 0.1C. There is room to further improve the performance of these coating materials, and they may provide good options for batteries used in non-standard conditions.Acknowledgements
MZ thanks the China Scholarship Council (CSC) and the University of Southampton for support. NGA thanks the EPSRC for an early career fellowship (EP/N024303/1).Notes and references
- M.-S. Balogun, W. Qiu, W. Wang, P. Fang, X. Lu and Y. Tong, J. Mater. Chem. A, 2015, 3, 1364–1387 CAS.
- I.-S. Kim, P. N. Kumta and G. E. Blomgren, in Materials for Electrochemical Energy Conversion and Storage, The American Ceramic Society, 2006, pp. 249–258, DOI:10.1002/9781118370858.ch25.
- S. Dong, X. Chen, L. Gu, X. Zhou, L. Li, Z. Liu, P. Han, H. Xu, J. Yao, H. Wang, X. Zhang, C. Shang, G. Cui and L. Chen, Energy Environ. Sci., 2011, 4, 3502–3508 CAS.
- I.-S. Kim, P. N. Kumta and G. E. Blomgren, Electrochem. Solid-State Lett., 2000, 3, 493–496 CrossRef CAS.
- M. Q. Snyder, S. A. Trebukhova, B. Ravdel, M. C. Wheeler, J. DiCarlo, C. P. Tripp and W. J. DeSisto, J. Power Sources, 2007, 165, 379–385 CrossRef CAS.
- J. H. Bang and K. S. Suslick, Adv. Mater., 2009, 21, 3186–3190 CrossRef CAS.
- E. L. Memarzadeh, W. P. Kalisvaart, A. Kohandehghan, B. Zahiri, C. M. B. Holt and D. Mitlin, J. Mater. Chem., 2012, 22, 6655–6668 RSC.
- A. Salamat, A. L. Hector, P. Kroll and P. F. McMillan, Coord. Chem. Rev., 2013, 257, 2063–2072 CrossRef CAS.
- S. Dong, X. Chen, X. Zhang and G. Cui, Coord. Chem. Rev., 2013, 257, 1946–1956 CrossRef CAS.
- A. Kafizas, C. J. Carmalt and I. P. Parkin, Coord. Chem. Rev., 2013, 257, 2073–2119 CrossRef CAS.
- E. G. Gillan and R. B. Kaner, J. Mater. Chem., 2001, 11, 1951–1956 RSC.
- B. Mazumder, P. Chirico and A. L. Hector, Inorg. Chem., 2008, 47, 9684–9690 CrossRef CAS PubMed.
- A. W. Jackson and A. L. Hector, J. Mater. Chem., 2007, 17, 1016–1022 RSC.
- F. Cheng, S. M. Kelly, S. Clark, N. A. Young, S. J. Archibald, J. S. Bradley and F. Lefebvre, Chem. Mater., 2005, 17, 5594–5602 CrossRef CAS.
- A. L. Hector, Chem. Soc. Rev., 2007, 36, 1745–1753 RSC.
- A. L. Hector, Coord. Chem. Rev., 2016, 323, 120–137 CrossRef CAS.
- D. Choi and P. N. Kumta, J. Electrochem. Soc., 2006, 153, A2298–A2303 CrossRef CAS.
- A. W. Jackson, O. Shebanova, A. L. Hector and P. F. McMillan, J. Solid State Chem., 2006, 179, 1383–1393 CrossRef CAS.
- C. F. Mallinson, B. M. Gray, A. L. Hector, M. A. McLachlan and J. R. Owen, Inorg. Chem., 2013, 52, 9994–9999 CrossRef CAS PubMed.
- B. M. Gray, S. Hassan, A. L. Hector, A. Kalaji and B. Mazumder, Chem. Mater., 2009, 21, 4210–4215 CrossRef CAS.
- R. Dominko, M. Bele, J.-M. Goupil, M. Gaberscek, D. Hanzel, I. Arcon and J. Jamnik, Chem. Mater., 2007, 19, 2960–2969 CrossRef CAS.
- Y. Wang, Y. Wang, E. Hosono, K. Wang and H. Zhou, Angew. Chem., Int. Ed., 2008, 47, 7461–7465 CrossRef CAS PubMed.
- F. Yu, L. Zhang, L. Lai, M. Zhu, Y. Guo, L. Xia, P. Qi, G. Wang and B. Dai, Electrochim. Acta, 2015, 151, 240–248 CrossRef CAS.
- Q. Fan, L. Lei, Y. Chen and Y. Sun, J. Power Sources, 2013, 244, 702–706 CrossRef CAS.
- H.-H. Chang, H.-C. Wu and N.-L. Wu, Electrochem. Commun., 2008, 10, 1823–1826 CrossRef CAS.
- S. Deng, H. Wang, H. Liu, J. Liu and H. Yan, Nano-Micro Lett., 2014, 6, 209–226 CrossRef.
- C. Gong, Z. Xue, S. Wen, Y. Ye and X. Xie, J. Power Sources, 2016, 318, 93–112 CrossRef CAS.
- M. R. Roberts, G. Vitins, G. Denuault and J. R. Owen, J. Electrochem. Soc., 2010, 157, A381–A386 CrossRef CAS.
- M. R. Roberts, G. Vitins and J. R. Owen, J. Power Sources, 2008, 179, 754–762 CrossRef CAS.
- I. D. Johnson, E. Blagovidova, P. A. Dingwall, D. J. L. Brett, P. R. Shearing and J. A. Darr, J. Power Sources, 2016, 326, 476–481 CrossRef CAS.
- H. Yuan, X. Wang, Q. Wu, H. Shu and X. Yang, J. Alloys Compd., 2016, 675, 187–194 CrossRef CAS.
- Y. Zhang, L. Wu, J. Zhao and W. Yu, J. Electroanal. Chem., 2014, 719, 1–6 CrossRef CAS.
- K. Vediappan, A. Guerfi, V. Gariépy, G. P. Demopoulos, P. Hovington, J. Trottier, A. Mauger, C. M. Julien and K. Zaghib, J. Power Sources, 2014, 266, 99–106 CrossRef CAS.
- P. P. Prosini, D. Zane and M. Pasquali, Electrochim. Acta, 2001, 46, 3517–3523 CrossRef CAS.
- S. W. Oh, S. T. Myung, S. M. Oh, K. H. Oh, K. Amine, B. Scrosati and Y. K. Sun, Adv. Mater., 2010, 22, 4842–4845 CrossRef CAS PubMed.
- Y. Liu, M. Zhang, Y. Li, Y. Hu, M. Zhu, H. Jin and W. Li, Electrochim. Acta, 2015, 176, 689–693 CrossRef CAS.
- Y. Jin, C. Yang, X. Rui, T. Cheng and C. Chen, J. Power Sources, 2011, 196, 5623–5630 CrossRef CAS.
- Y. Lin, Y. Lin, T. Zhou, G. Zhao, Y. Huang and Z. Huang, J. Power Sources, 2013, 226, 20–26 CrossRef CAS.
- W.-J. Zhang, J. Power Sources, 2011, 196, 2962–2970 CrossRef CAS.
- J. Cao, Y. Qu and R. Guo, Electrochim. Acta, 2012, 67, 152–158 CrossRef CAS.
- J. Chen, Materials, 2013, 6, 156–183 CrossRef.
- J. Wang and X. Sun, Energy Environ. Sci., 2012, 5, 5163–5185 CAS.
- T. Yi, X. Li, H. Liu, J. Shu, Y. Zhu and R. Zhu, Ionics, 2012, 18, 529–539 CrossRef CAS.
- X. Lu, G. Wang, T. Zhai, M. Yu, S. Xie, Y. Ling, C. Liang, Y. Tong and Y. Li, Nano Lett., 2012, 12, 5376–5381 CrossRef CAS PubMed.
- Y. Xu and J. Mao, J. Mater. Sci., 2016, 51, 10026–10034 CrossRef CAS.
- A. Larson, R. Von Dreele, L. Finger, M. Kroeker and B. Toby, J. Appl. Crystallogr., 2001, 34, 210–213 CrossRef.
- E. Bailey, N. M. Ray, A. L. Hector, P. Crozier, W. T. Petuskey and P. F. McMillan, Materials, 2011, 4, 1747–1762 CrossRef CAS.
- L.-X. Yuan, Z.-H. Wang, W.-X. Zhang, X.-L. Hu, J.-T. Chen, Y.-H. Huang and J. B. Goodenough, Energy Environ. Sci., 2011, 4, 269–284 CAS.
- Y. Zhang, Q.-Y. Huo, P.-P. Du, L.-Z. Wang, A.-Q. Zhang, Y.-H. Song, Y. Lv and G.-Y. Li, Synth. Met., 2012, 162, 1315–1326 CrossRef CAS.
- W. Hofmann and A. Schrader, Arch. Eisenhuettenwes., 1936, 10, 65–66 CAS.
- Y. Zhang, Q. Huo, P. Du, L. Wang, A. Zhang, Y. Song, Y. Lv and G. Li, Synth. Met., 2012, 162, 1315–1326 CrossRef CAS.
- A. D. Spong, G. Vitins and J. R. Owen, J. Electrochem. Soc., 2005, 152, A2376–A2382 CrossRef CAS.
- Y. Gu, C. Zeng, H. Wu, H. Cui, X. Huang, X. Liu, C. Wang, Z. Yang and H. Liu, Mater. Lett., 2007, 61, 4700–4702 CrossRef CAS.
- K. Wang, R. Cai, T. Yuan, X. Yu, R. Ran and Z. Shao, Electrochim. Acta, 2009, 54, 2861–2868 CrossRef CAS.
- M. Konarova and I. Taniguchi, J. Power Sources, 2009, 194, 1029–1035 CrossRef CAS.
- M. Bianchini, J.-B. Leriche, J.-L. Laborier, L. Gendrin, E. Suard, L. Croguennec and C. Masquelier, J. Electrochem. Soc., 2013, 160, A2176–A2183 CrossRef CAS.
- Y. Wang, P. He and H. Zhou, Energy Environ. Sci., 2011, 4, 805–817 CAS.
- Y. Cui, X. Zhao and R. Guo, Electrochim. Acta, 2010, 55, 922–926 CrossRef CAS.
- Y. Cui, X. Zhao and R. Guo, Mater. Res. Bull., 2010, 45, 844–849 CrossRef CAS.
- H. Liu, G. X. Wang, D. Wexler, J. Z. Wang and H. K. Liu, Electrochem. Commun., 2008, 10, 165–169 CrossRef CAS.
- C.-Z. Lu, G. T.-K. Fey and H.-M. Kao, J. Power Sources, 2009, 189, 155–162 CrossRef CAS.
- X. Huang, X. Li, H. Wang, Z. Pan, M. Qu and Z. Yu, Electrochim. Acta, 2010, 55, 7362–7366 CrossRef CAS.
- Y. S. Hu, Y. G. Guo, R. Dominko, M. Gaberscek, J. Jamnik and J. Maier, Adv. Mater., 2007, 19, 1963–1966 CrossRef CAS.
- Z. G. Lu, H. Cheng, M. F. Lo and C. Y. Chung, Adv. Funct. Mater., 2007, 17, 3885–3896 CrossRef CAS.
- A. K. Padhi, K. Nanjundaswamy and J. Goodenough, J. Electrochem. Soc., 1997, 144, 1188–1194 CrossRef CAS.
- Y. J. Lee, H. Yi, W.-J. Kim, K. Kang, D. S. Yun, M. S. Strano, G. Ceder and A. M. Belcher, Science, 2009, 324, 1051–1055 CAS.
Footnote |
| † Electronic supplementary information (ESI) available. See DOI: 10.1039/c6ta09572k |
| This journal is © The Royal Society of Chemistry 2017 |