
 Open Access Article
 This Open Access Article is licensed under a
 Creative Commons Attribution 3.0 Unported Licence
Hollow carbon spheres and a hollow carbon sphere/polyvinylpyrrolidone composite as ammonia sensors†
Bridget K.
Mutuma
a,
Rafael
Rodrigues
b,
Kamalakannan
Ranganathan
a,
Boitumelo
Matsoso
a,
Daniel
Wamwangi
c,
Ivo A.
Hümmelgen
*b and
Neil J.
Coville
*a
aDST-NRF Centre of Excellence in Strong Materials and the Molecular Sciences Institute, School of Chemistry, University of the Witwatersrand, WITS 2050, Johannesburg, South Africa. E-mail: neil.coville@wits.ac.za; Fax: +27 11717 6749
bDepartamento de Física, Universidade Federal do Paraná, Caixa Postal 19044, 81531-980 Curitiba, PR, Brazil. E-mail: iah@fisica.ufpr.br; Fax: +55-41-3361-3645
cDST-NRF Centre of Excellence in Strong Materials, Materials Physics Research Institute, School of Physics, University of the Witwatersrand, WITS 2050, Johannesburg, South Africa
First published on 24th November 2016
Abstract
This study reports on the ammonia vapour sensing behaviour of hollow carbon spheres (HCSs), a hollow carbon sphere–polyvinylpyrrolidone (HCS/PVP) composite and annealed hollow carbon spheres (in a humid environment). For device fabrication, a surfactant assisted method was used to homogeneously disperse the hollow carbon spheres onto an interdigitated electrode. Conductance measurements (sensor response and recovery time) were performed at 20 °C and 40 °C. The sensor response was investigated by varying both ammonia concentration and relative humidity. The presence of amorphous domains and oxygenated groups on the pristine hollow carbon spheres resulted in a high relative humidity response. However, the detection of ammonia at high relative humidity using the pristine hollow carbon spheres was found to be negligible due to the inhibition of ammonia adsorption sites by the high concentration of water molecules. In contrast, a decline in conductivity at high relative humidity was recorded in the HCS/PVP sensors due to polymer swelling and plasticization. Annealing of the hollow carbon spheres resulted in a decrease in the amorphous domains in the carbon structure and a subsequent increase in the surface area. The topology of the response was determined as a function of these two variables (NH3 and H2O concentration) and analysed by applying a generalized tristimulus analysis to allow the ammonia concentration to be determined independently of the relative humidity. The pristine HCS, HCS/PVP and annealed HCS sensor responses to 74 ppm NH3 at ambient humidity were 6%, 86% and 196%, respectively. The ammonia sensitivity values (% per ppm) of the pristine HCSs, HCS/PVP and annealed HCSs were 0.08, 4 and 1.6, respectively. The annealed HCSs exhibited a good ammonia sensitivity to NH3 concentration (74–295 ppm) over a broad range of relative humidity (10–97%); indeed the values measured were higher than those reported for other nanomaterial based sensors. This study demonstrates the critical role played by humidity and surface chemistry in the ammonia sensing properties of hollow carbon spheres.
1. Introduction
The real-time monitoring of toxic compounds such as ammonia, nitrogen dioxide and volatile organic compounds is essential to human health and environmental safety. In particular, high ammonia concentrations in the environment are hazardous to human health and vegetation.1,2 These high ammonia concentrations may result from the use of nitrogen containing fertilizers in agricultural crops that increase soil acidification and the consolidation of ammonium compounds to form fine particles.3,4 Therefore, the detection of ammonia under ambient conditions is vital for environmental pollution monitoring. Also, ammonia sensing can be applied in disease diagnosis and monitoring kidney failure patients.5 Thus, ammonia sensors find a broad range of applications in the biomedical6 and agricultural industries.7,8 However, research on ammonia detection and sensing is mostly carried out in a gas testing chamber, limiting their applicability in a day to day situation.Under ambient conditions, environmental factors such as temperature and humidity affect the performance of chemical sensors. For instance, Al2O3 ceramic sensors are readily susceptible to contamination by water vapour, hence requiring regular maintenance.9 Also, the presence of water vapour on p-type semiconducting materials has been reported to cause a reduction in conductance and a delay in the sensor recovery time.10–13 In essence, the monitoring of humidity levels is also of great importance to the application of sensors in the automotive and the food packaging industry.14,15 This results from the role of humidity in affecting the surface reactions of sensing materials. Thus, the study of the ammonia response of different sensing materials under ambient conditions is relevant for their applicability in a humid environment.16,17 In recent years, several researchers have investigated the effects of surface functionalities on ammonia adsorption on activated carbon,18 single walled carbon nanotubes19,20 and multiwalled carbon nanotubes21,22 using theoretical and experimental techniques. Surface functionalities such as oxygen containing groups are influenced by humidity, which can then impact on the adsorption and desorption of ammonia. For instance, Sangaletti and co-workers reported on the use of highly sensitive ammonia gas sensors based on single walled carbon nanotubes (SWCNTs) under ambient conditions.23 Their SWCNT-based sensors showed an increase in resistance with relative humidity in studies involving human breath as a water source in humidity tests. Narayanaswamy’s group reported on the simultaneous determination of ammonia (5–27 ppm) and relative humidity (30–70%) of a Nafion-crystal violet composite in air through reflectance measurements using an optical fibre sensor.24
Recently, solid carbon sphere–polymer composites have been applied in electronic devices such as hydrostatic pressure sensors,25,26 relative humidity sensors27 and write-once-read-many-times memory devices.28,29 The application of these carbon nanospheres as chemical sensors is a simple, inexpensive method that provides high sensitivity with short response and recovery times. Despite their hydrophobic behaviour they can be dispersed in water with the assistance of a surfactant, such as hexadecyltrimethylammonium bromide (CTAB), at a temperature below the Kraft temperature.27,30 In addition, a polymer containing a polar group such as polyvinylalcohol (PVA) or polyvinylpyrrolidone (PVP) can aid the dispersion of these carbon materials.31 In addition, the use of polymer PVP as an insulating matrix within a conductive material such as graphene has been reported to create percolation pathways that aid electrical conductivity.32 Thus, carbon based nanomaterials, being cheap and easily processable and with a high surface to volume ratio and tunable electrical properties, are advantageously applicable for use as resistive or capacitive chemical sensors.17,33,34
Extensive research has been carried out on the synthesis and application of solid carbon spheres. However, the same cannot be said for their hollow carbon sphere (HCS) counterparts.35,36 HCSs are commonly synthesized by hydrothermal,16 pyrolysis37 or templating techniques,38,39 among others. The templating method offers the advantages of manipulating the pore structure, the shell thickness and the internal diameter of HCSs.40 The porosity and tunable surface area of HCSs make them potential candidates for application as ammonia sensors. This is because ammonia adsorption on nanoporous carbons is favoured by large surface areas, strong surface interactions and pore filling within the carbon matrix.41,42 In addition, HCSs are lightweight and cheap and their void centre presents numerous strategies for filling with metals or chemicals to further modify their properties.43–46 Therefore, HCSs with their size-dependent properties have become attractive nanomaterials with versatile applications in catalysis,43–46 fuel cells,47 supercapacitors48 and lithium ion batteries.49
In this study, we have examined the response of three different sensors based on HCSs (as-synthesized, annealed, and in a PVP composite) to ammonia vapours while varying the relative humidity (RH). The effect of low temperature annealing of the hollow carbon spheres was investigated by comparing the relative humidity response of the pristine and annealed HCSs. The surfactant assisted dispersion of the pristine HCSs, annealed HCSs and a hollow carbon sphere/polyvinylpyrrolidone (HCS/PVP) composite was used to prepare the active layer in the sensor by casting. Controlled RH conditions were created using saturated saline solutions. We have also investigated the simultaneous response to ammonia and relative humidity of the HCSs and HCS/PVP composite using a tristimulus analysis as a pattern recognition technique. This allowed us to map the clusters of ammonia responses and relative humidity levels in a readable output format.
2. Experimental
2.1 Starting materials
Tetraethyl orthosilicate, TEOS (98%, Aldrich), ammonium hydroxide, NH4OH (25%, Fluka), ethanol (Merck, 96%) and deionized H2O (resistivity > 18.2 MΩ cm−1) were used as reagents for the synthesis of the silica spheres. Hydrofluoric acid (HF; 40%, Associated Chemical) was used for silica removal, and toluene (Aldrich) was used as a carbon source. Hexadecyltrimethylammonium bromide (CTAB; 98%, Aldrich) and polyvinylpyrrolidone, PVP (Mw 40![[thin space (1/6-em)]](https://www.rsc.org/images/entities/char_2009.gif) 000, Aldrich) were used for the preparation of the surfactant solutions and to make the HCS/PVP composite, respectively. The saturated saline salts were prepared from potassium hydroxide (KOH, 99.99%), magnesium chloride hexahydrate (MgCl2·6H2O, 99%), sodium bromide (NaBr, 99%), sodium chloride (NaCl, 99%) and potassium sulphate (K2SO4, 99%) supplied by NEON chemicals.
000, Aldrich) were used for the preparation of the surfactant solutions and to make the HCS/PVP composite, respectively. The saturated saline salts were prepared from potassium hydroxide (KOH, 99.99%), magnesium chloride hexahydrate (MgCl2·6H2O, 99%), sodium bromide (NaBr, 99%), sodium chloride (NaCl, 99%) and potassium sulphate (K2SO4, 99%) supplied by NEON chemicals.
2.2 Synthesis of the SiO2 spheres and the HCSs
The SiO2 spheres and the HCSs were synthesized based on a procedure described elsewhere.50 The preparation of the HCSs and HCS/PVP solutions using a surfactant dispersion method is described in the ESI† section.2.3 Device fabrication
Interdigitated electrodes composed of 18 pairs of 7.9 mm long ENIG (Electroless Nickel Immersion Gold) with a width of 0.1 mm and a gap of 0.1 mm between electrode strips mounted on a FR4 epoxy resin/fiber glass board were sequentially cleaned in acetone, deionized water and isopropyl alcohol by ultrasonication for 20 min in each step. The substrates were dried in an oven at 100 °C for 30 min. A 20 μL solution was drop-cast separately for each solution of interest on the active area of the interdigitated electrode and the sensor device was dried at 120 °C for 1 h. The thickness of the films was measured using a Bruker Dektak XT profilometer and their morphology was ascertained by optical microscopy (Wild M20).Conductance measurements were carried out using a Agilent 4284A LCR meter at the input signal with an amplitude of 500 mV and a frequency of 1 kHz. Ammonia solutions of varying volumes (1 μL to 4 μL that corresponds to 74 ppm to 295 ppm of ammonia in the gas phase) were dropped into a sealed 2.4 L glass chamber using a micropipette and measurements were taken after a 10 min saturation time. The chamber contained a fan to homogenize the volatiles. The change in the conductance was monitored at 20 °C and 40 °C by switching the sensor response between the inside of the chamber (ammonia vapour) and the outside of the chamber (ambient air) using a rotating cap system (Fig. 1), previously described elsewhere.51 The response time (tresp) was determined as the time taken for the sensors to achieve 90% of the saturation value. The recovery time (trecov) refers to the time taken to recover 90% of the sensor response. The 40 °C measurements were obtained by keeping the chamber in an oil bath. At 20 °C, the sensor saturation and the recovery time for 74 ppm of ammonia were approximately 2700–3100 s and 200 s, respectively. In contrast, at 40 °C, the sensor saturation and the recovery time for 74 ppm of ammonia were approximately 150–400 s and 100 s, respectively. Relative humidity measurements were carried out using saturated saline solutions of KOH, MgCl2, NaBr, NaCl or K2SO4 as described by Greenspan et al.52 to obtain 10%, 33%, 59%, 75% or 97% RH, respectively. To confirm the relative humidity during the measurement, a hygrometer (Minipa MT-241) was kept inside the chamber. The measurements were carried out at 20 °C and 40 °C.
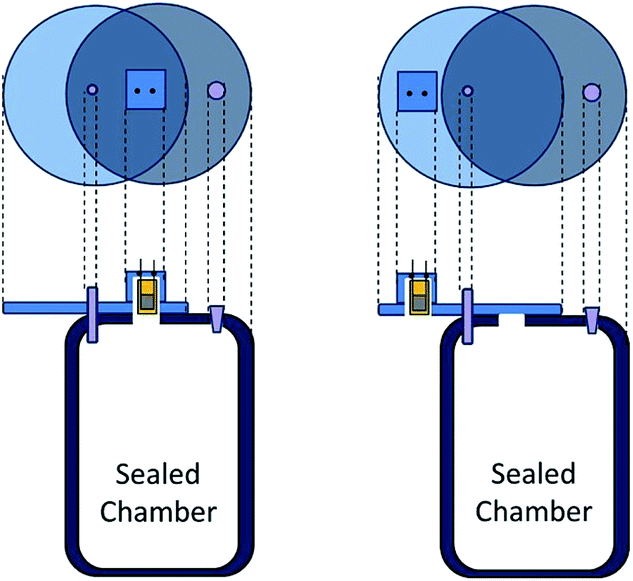 | ||
| Fig. 1 A diagram showing the sensor inside and outside of the chamber used for the transient measurements. | ||
3. Results and discussion
3.1 Characterization of the HCSs
TEM micrographs show that the pristine hollow carbon spheres obtained after 1 h carbonization and silica removal were complete (not broken) with a mean inner diameter of 211 ± 18 nm (Fig. 2a). As expected, the sphere sizes were slightly smaller than those of the SiO2 templates used (Fig. S1†).50 The shell diameter in the pristine HCSs was approximately 18 ± 4 nm due to the use of a short (1 h) carbonization time. The TG-DTG curve of the HCSs shows a small derivative peak between 290 °C and 400 °C (Fig. 2b). This can be attributed to the decomposition of the organic residues and OH groups that were not completely removed during the SiO2 etching process.53 To understand the surface properties of the HCSs, their surface areas were measured using the BET (Brunaeur–Emmet–Teller54) method, and their pore size distributions were determined using the BJH (Barrett–Joyner–Halenda55) method. Fig. 2c shows that the HCSs exhibited a type (III) isotherm with a H3 hysteresis loop at a relative pressure of p/po = 0.8–1.0 indicating an assemblage of slit shaped pores or plate-like particles.56 The BET surface area was calculated to be 88 m2 g−1. The Raman spectra show a D band peak at 1346 cm−1 due to the breathing mode of sp3 carbon atoms and defects in the carbon structure (Fig. 2d).57,58 In addition, a G peak was observed at 1581 cm−1; characteristic of the bond stretching of sp2 atoms.58 The ID/IG ratio of the pristine HCSs was 0.92 indicating the presence of defects and a moderate degree of graphitization. | ||
| Fig. 2 The characteristics of the pristine HCSs. (a) TEM image; (b) TG-DTG curves; (c) N2 adsorption and desorption isotherms and (d) Raman spectrum, respectively. | ||
Upon annealing, the HCS inner diameter and shell thickness were found to be 200 ± 15 nm and 17 ± 5 nm, respectively (Fig. S2a†). This shows that annealing did not affect the shell thickness. Fig. S2b† shows the absence of a peak between 290 °C and 400 °C in the TG-DTG curve. This can be attributed to the removal of OH and COOH groups after annealing. The annealed HCSs exhibited a type (III) isotherm with a H3 hysteresis loop similar to that of the pristine HCSs (Fig. S2c†). However, the BET surface area increased to 328 m2 g−1. This can be ascribed to the increased exposure of the carbon surface after the removal of amorphous domains and an increase in the pore volume within the carbon matrix due to the annealing process.59 The decrease in amorphous defects was confirmed by a lower ID/IG ratio of 0.71 observed in the Raman spectra of the annealed HCSs (Fig. S2d†).
3.2 Characterization of the ammonia sensors
The morphology of the pristine and annealed HCSs dispersed in CTAB was investigated using optical microscopy. Indeed, the spheres were homogeneously dispersed in CTAB with the HCSs forming percolation pathways as shown by the optical micrographs of the pristine and annealed HCSs (Fig. S3†). The average film thickness of the CTAB dispersed carbon solutions was obtained by profilometry and found to be 378 nm and 325 nm for the pristine HCSs and the annealed HCSs, respectively. However, the HCS/PVP composite formed a thicker film with an average thickness of 457 nm due to the presence of the polymer. To determine the best working frequency, the sensors were exposed to 74 ppm of ammonia vapour and conductivity measurements were carried out at varying frequency sweeps (Fig. S4†). At low frequency, the HCS/PVP composite and the annealed HCSs exhibited a high signal to noise ratio. At 1 kHz, the signal to noise ratio was low and the sensor response was higher than that at higher frequencies (Fig. S4†). Therefore, 1 kHz was chosen as the operation frequency for the measurements and was used in all further experiments.3.3 Sensor response and recovery time
Fig. 3a, c and e show that long saturation times (>3000 s) and response times (>2000 s) are required to obtain a reading for the pristine HCS, HCS/PVP and annealed HCS based sensors after exposure to 74 ppm of ammonia at room temperature (20 °C). The pristine HCSs show a two stage adsorption of ammonia characterized by a fast adsorption in the first 200 s followed by a slower adsorption up to the saturation time of 3000 s (Fig. 3a). This can be attributed to the presence of defects resulting in a varying affinity for ammonia adsorption by the carbon surface leading to a stepwise saturation. However, the HCS/PVP composite and annealed HCSs exhibited a slow adsorption process with saturation occurring in a single coverage process (Fig. 3c and e). This can be attributed to the presence of the PVP polymer in the HCS/PVP composite and the removal of amorphous domains in the annealed HCSs. At 40 °C, the response and the recovery time of all the sensors were significantly reduced (Fig. 3b, d and f). At 40 °C, the recovery time of the pristine HCS and HCS/PVP sensors was less than 300 s while for the annealed HCSs the time was reduced to 504 s. This can be attributed to the slight increase in temperature that significantly enhanced the ammonia adsorption and desorption rates on the carbon surface.60 The pristine HCSs showed shorter response and recovery times with a higher signal to noise ratio than the HCS/PVP composite as shown in Table 1. However, longer response and recovery times were exhibited by the HCS/PVP composite at 20 °C and 40 °C. This can be attributed to the PVP polymer functional groups hindering ammonia transport in the sensor active layer. The ammonia adsorption rate of the annealed HCS surface was lower than that observed for the pristine HCSs resulting in longer response times at 20 °C and 40 °C. This indicated a stronger ammonia vapour interaction with the annealed carbon surface.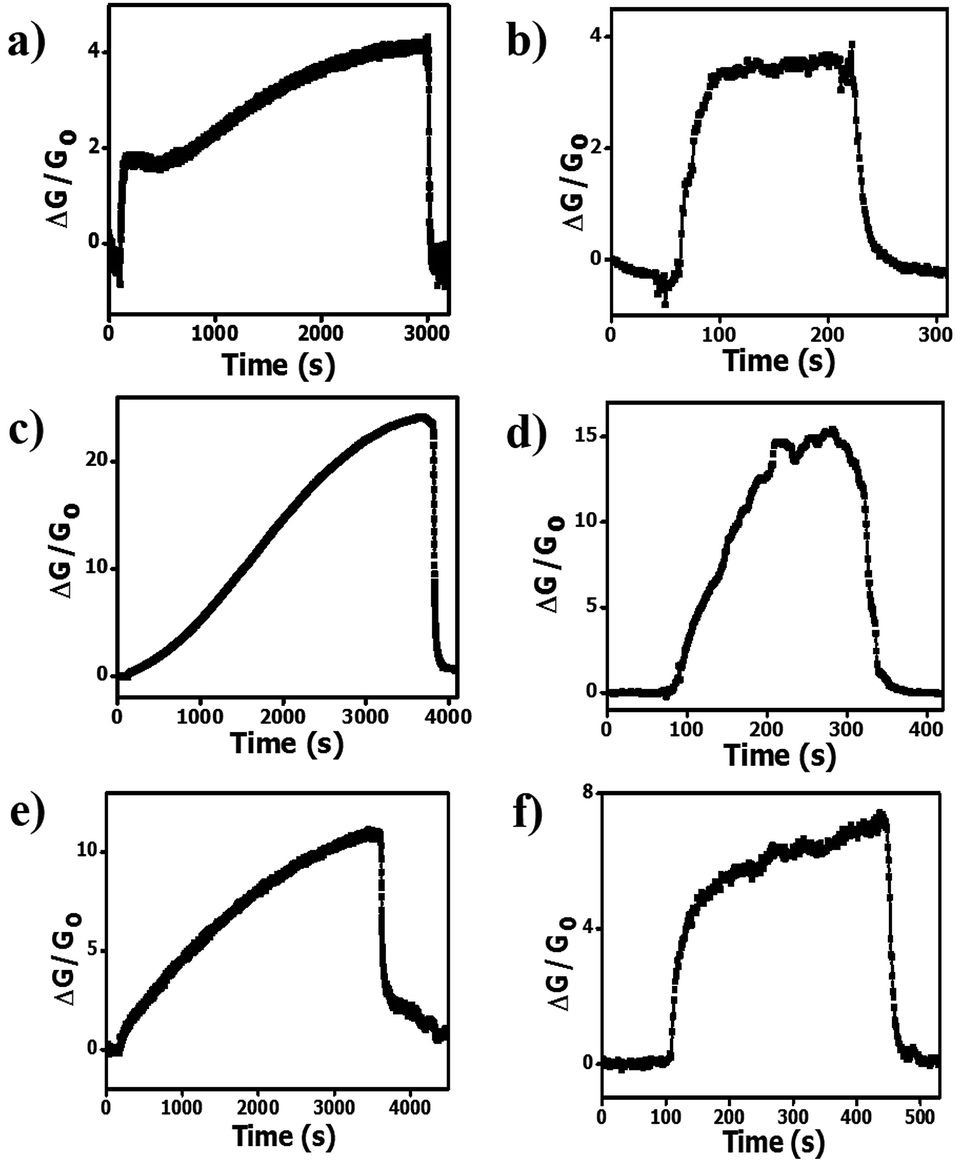 | ||
| Fig. 3 Transient response curves of (a and b) pristine HCSs, (c and d) HCS/PVP and (e and f) annealed HCSs at 20 °C and at 40 °C, respectively. Ammonia concentration: 74 ppm; RH: 50%. | ||
| Material | t resp at 20 °C (s) | t recov at 20 °C (s) | t resp at 40 °C (s) | t recov at 40 °C (s) |
|---|---|---|---|---|
| a Ammonia concentration: 74 ppm; RH: 50%. | ||||
| Pristine HCSs | 2542 | 104 | 49 | 50 |
| HCS/PVP | 3146 | 259 | 125 | 82 |
| Annealed HCSs | 3078 | 504 | 149 | 32 |
3.4 Ammonia sensitivity
Electrical measurements of the HCS based materials for ammonia sensing as a function of NH3 concentration at 40 °C are shown in Fig. 4. In the literature, the response (Res) is typically defined as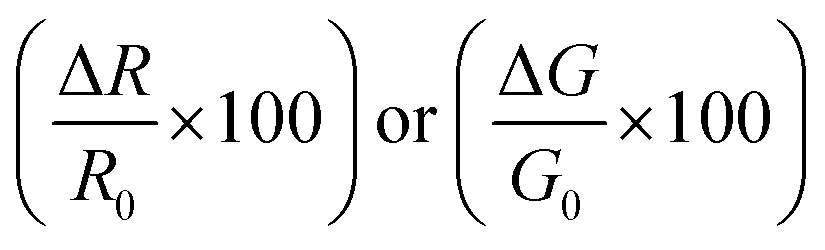
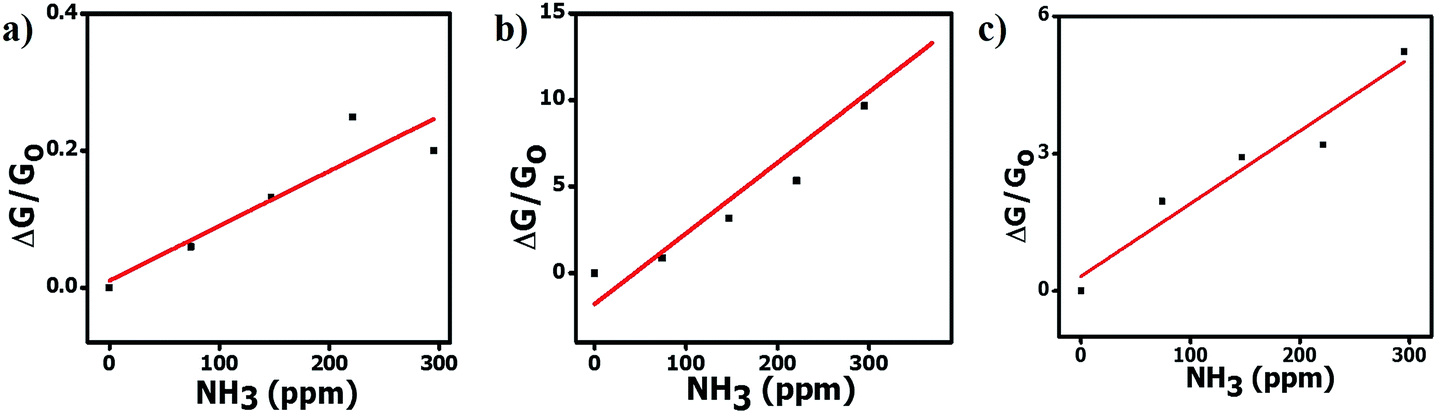 | ||
| Fig. 4 Sensitivity of the carbon materials to varying ammonia concentrations at 40 °C. (a) Pristine HCSs; (b) HCS/PVP; and (c) annealed HCSs. Ammonia concentration: 74 ppm; RH: 50% (line drawn to aid the eye). | ||
Data of various carbon based (and other) sensors using this equation is given in Table 2. The sensitivity (S) of the sensors can be determined from
 | (1) |
 | (2) |
| Materials | Temperaturea (°C) | NH3 concentration (ppm) | Response (%) | Ref. | |
|---|---|---|---|---|---|
a RTP = room temperature and pressure.
b
 .
c .
c
 ; where R is the resistance. ; where R is the resistance.
|
|||||
| Pristine HCSs | 40 | 74 | 6b | 5.2c | This work |
| HCS/PVP | 40 | 74 | 86b | 46c | This work |
| Annealed HCSs | 40 | 74 | 196b | 66c | This work |
| NiO | — | 50 | 30b | 62 | |
| Polypyrrole | RTP | 75 | 22.8b | 63 | |
| Polypyrrole/Co-phthalocyanine | RTP | 75 | 7.3b | 64 | |
| Graphene | RTP | 80 | 3.7b | 65 | |
| Activated carbon | RTP | 100 | 15.7c | 41 | |
| Oxidized activated carbon | RTP | 100 | 14.2c | 41 | |
| Pure MWCNTs | RTP | 75 | 5c | 16 | |
| Ag NC-MWCNTs | RTP | 10000 |
9c | 34 | |
| RGO | 25 | 50 | 5.2c | 74 | |
| RGO-PANI | 25 | 50 | 59.2c | 74 | |
| RGO hydrogel | 38 | 1000 | 0.25c | 73 | |
| In2O3/SnO2 nanofibers | RTP | 10 | 28c | 75 | |
| Polypyrrole | RTP | 25 | 16c | 76 | |
| CuO nanowires | 200 | 100 | 3.1c | 77 | |
The sensor response values of the pristine HCSs, HCS/PVP and annealed HCSs, for example, to a 74 ppm NH3 concentration were 6%, 86% and 196%, respectively. To explore the HCS and the HCS/PVP sensor response as a function of NH3 concentration, their sensitivity values were calculated (as a %) using eqn (1). The observed NH3 sensitivity values (% per ppm) were 0.08, 4 and 1.6 for the pristine HCSs, HCS/PVP and annealed HCSs, respectively. The HCSs hence showed an expected increase in the response with the ammonia concentration. The increase in the sensor response and sensitivity of the HCS/PVP composite is due to the presence of PVP, which enhances the homogeneous dispersion of the carbons in the electrode matrix. The annealed HCSs exhibited a higher sensitivity value than the pristine HCSs (Fig. 4c). This value can be attributed to the presence of fewer amorphous defects which results in increased ammonia physisorption. In addition, a stronger surface to ammonia molecule interaction due to the increase in the surface area and pore volume during the low temperature annealing process is likely to result in a higher ammonia sensitivity.61
The observed ammonia sensor response values (%) of the annealed HCSs and HCS/PVP were much higher than those reported in the literature (Table 2). For example, the ammonia sensor responses reported for conductance measurements of nickel oxide, polypyrrole, graphene and polypyrrole/cobalt-phthalocyanine hybrid materials were lower than those obtained from the annealed HCS and HCS/PVP sensors.62–65 Similarly, when the sensor responses based on resistance change at 74 ppm of NH3 were calculated, the obtained values of the annealed HCSs were higher than those reported in the literature (Table 2). For instance, despite the low surface area of our annealed HCSs, they exhibited a higher ammonia response than activated carbons with higher surface areas. Travlou et al.41 reported a 15.7% response towards 100 ppm ammonia concentration at room temperature for commercial wood activated carbon (surface area; 1549 m2 g−1). Similarly, oxidized wood activated carbon with a surface area of 1408 m2 g−1 led to a slight decrease in the ammonia response to 14.2%.41 Other researchers have reported the ammonia response of other carbon nanomaterials such as MWCNTs to be 5% at 75 ppm NH3 concentration.16 It is to be noted that graphene and carbon nanotubes possess a high degree of graphitization due to their distinct sp2 hybridized carbons that make them chemically stable.66–69 Thus, their electronic properties differ significantly from those of HCSs. Typically, the sensor response of carbon-based nanomaterials can be enhanced by coating them with metal nanoparticles or by mixing them with polymers. Cui et al.34 reported on a fast response of silver nanocrystal decorated MWCNTs towards 1% NH3 (10000 ppm) with an ammonia sensitivity greater than 5%. Furthermore, carbons such as chemically reduced graphene oxide possess a high number of oxygenated groups70,71 that can enhance ammonia adsorption and sensing properties. For instance, Ghosh et al. obtained a 5% response for reduced graphene oxide for 400 ppm of ammonia at room temperature.72 Also, a change in the dimensional framework to 3-D or the incorporation of a conducting polymer within a RGO matrix can enhance the ammonia response.73,74 In addition, the ammonia response of the HCS/PVP composite and annealed HCSs was higher than that recorded for polypyrrole, CuO and In2O3/SnO2 nanocomposites75–77 (Table 2).
3.5 Relative humidity response
To explore the effect of the relative humidity on the ammonia response of the carbon materials, the sensors were exposed to different relative humidity environments (closed environments at equilibrium with saline solutions) and their response was determined in a humid environment. The relative humidity response was initially determined in the absence of ammonia vapors. Fig. 5a shows that the conductivity of the pristine HCSs increased with increasing RH. These values were found to be approximately 40 and 300 times higher than that of the HCS/PVP composite and the annealed HCSs, respectively. This can be attributed to the presence of surface hydroxyl groups on the HCS surface as confirmed by the TGA and Raman data (Fig. 2b and d). Also, the amorphous domains within the carbon matrix introduce impurity states near the Fermi level that enhance the affinity of the HCS for H2O, thus making these domains energetically favourable adsorption sites.78 A similar effect on the role of defects in the humidity response has been reported for carbon nanosheets and carbon quantum dots obtained via physical vapor deposition and electrochemical ablation methods, respectively.79,80 | ||
| Fig. 5 The conductivity of (a) pristine HCS; (b) HCS/PVP; and (c) annealed HCS based sensors at different relative humidity values (40 °C). | ||
In contrast, the HCS/PVP sensors exhibited the lowest conductivity at 10% RH and the highest conductivity at 59% RH (Fig. 5b). This effect is ascribed to the plasticization of the PVP polymer that is known to commence at 55% humidity.81 The reduced conductivity at 97% RH in HCS/PVP is related to the increased resistance resulting from PVP swelling and plasticization.81 This led to the large decrease in electrical response observed above 60% RH (Table 3). The annealed HCS sensors showed an increase in the conductivity with increased RH. However, the annealed HCS conductivity values were 250 times lower than that of the pristine HCSs (Fig. 5c). This can readily be attributed to a significant reduction in the number of defects (amorphous domains) that were removed by the annealing process resulting in graphitic domains that restricted water adsorption. The Raman spectra confirmed that the annealed HCSs exhibited an ID/IG ratio of 0.71 (Fig. S2d†); indicating a decrease in the number of defects in the HCSs. This consequently led to an increase in the hydrophobic character of the HCSs which led to a smaller response to the RH. The OH and COOH groups were also removed by annealing as ascertained by the absence of a peak between 290 °C and 400 °C in the TG-DTG curve (Fig. S2b†).
| Response | (G33 − G10)/G10 | (G59 − G10)/G10 | (G75 − G10)/G10 | (G97 − G10)/G10 |
|---|---|---|---|---|
| a The subscript of G corresponds to the RH value, i.e., (G33 − G10)/G10 is the response at 33% RH relative to 10% RH etc. | ||||
| Pristine HCSs | 1760 | 1400 | 17700 |
199000 |
| HCS/PVP | 1980 | 2380 | 1740 | 24 |
| Annealed HCSs | 6 | 80 | 300 | 460 |
Our reported RH response of the pristine HCSs is higher than those reported for other carbon based nanomaterials79,82–88 as highlighted in Table 4. Most of the work reported in the literature has focused on the humidity sensing properties of graphene oxide (GO) and reduced graphene oxide (RGO) that are more hydrophilic89 than the HCSs. Despite this, the response of our pristine HCSs is higher (Table 4). This can be attributed to the unique properties exhibited by the hollow structure of the HCSs.
| Sensing material | Parameter | RH range (%) | Response | Ref. |
|---|---|---|---|---|
| a Values indicate a change in capacitance (pF). | ||||
| RGO/SnO2 | Capacitance | 11–97 | 138020a |
82 |
| GO | Resistance | 25–88 | 1200 | 83 |
| GO | Capacitance | 15–95 | 37800 |
84 |
| MWCNTs | Capacitance | 11–97 | 2.8a | 85 |
| Carbon nanosheets | Resistance | 11–95 | 225 | 79 |
| RGO/urchin-like CuO | Impedance | 11–98 | 22700 |
86 |
| SWCNT/CuO | Conductance | 33–70 | ≈1.5 | 88 |
| Polyaniline | Conductance | 0–100 | ≈5.5 | 87 |
| Pristine HCSs | Conductance | 10–97 | 199000 |
This work |
3.6 Ammonia sensitivity at varying RH
Fig. 6 shows the conductivity and ammonia sensitivity values of the pristine HCSs, HCS/PVP and annealed HCSs at 10% RH. The conductivity increased with the ammonia concentration in both types of HCSs and the HCS/PVP composite. However, the conductivity values of the pristine and annealed HCSs were one order of magnitude lower than that of the HCS/PVP composite (Fig. 6a, c and e). This can be attributed to the polymer composite reorganization that enhanced the conductivity.90 Simultaneous sensing of ammonia and relative humidity has been reported for a conducting polymer polystyrene doped poly(3,4-ethylenedioxythiophene) at 7–55% RH at 1% NH3.91 An increase in electrical resistance with humidity and ammonia was observed due to the acid–base chemistry of the two polymers.91 In contrast, ZnO and SnO2 nanostructures show a decrease in the ammonia response with RH (35–90% RH) when exposed to 800 ppm of ammonia at 300 °C.92 This shows the difference between the ammonia sensing behaviour of conducting polymers and metal oxide nanostructures and our HCSs and HCS/PVP composite.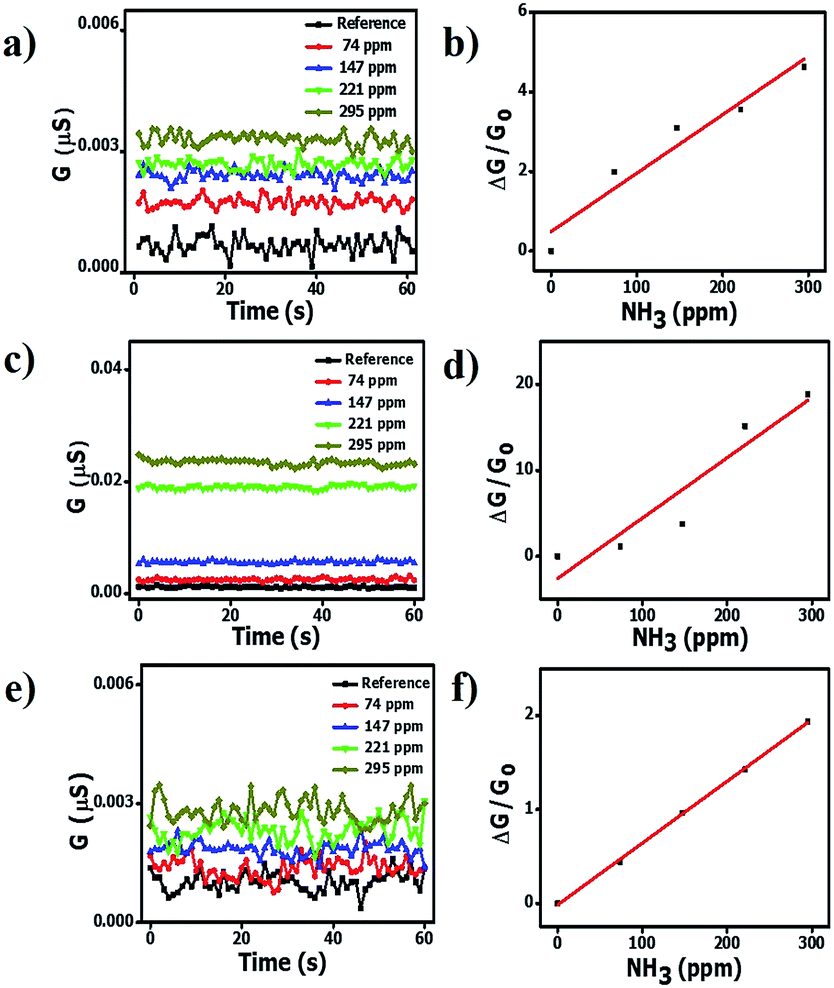 | ||
| Fig. 6 Conductance and sensitivity of the HCS (a and b); HCS/PVP (c and d); and annealed HCS (e and f) based sensors at 10% RH and different ammonia concentrations; 40 °C (line drawn to aid the eye). | ||
Furthermore, the ammonia sensitivity was 0.0150/ppm, 0.0707/ppm and 0.0070/ppm in the pristine HCSs, HCS/PVP and annealed HCSs at 10% RH (Fig. 6b, d and f). The ammonia sensitivity curves of the three carbon based sensors at 33%, 59%, 75% and 97% RH are shown in Fig. S5–S7.† A summary of the ammonia sensitivity data shows that the pristine HCSs and HCS/PVP exhibited the highest sensitivity at 10% RH while that of the annealed HCSs was at 33% RH (Table 5). However, the overall ammonia sensitivity of the annealed HCSs was higher than that of the pristine HCSs; this can be attributed to the presence of fewer defects and a higher surface area in the former sensor. In addition, the annealed HCS sensor worked efficiently from 10% to 97% RH unlike their pristine HCS and HCS/PVP counterparts. Nevertheless, the RH range of the annealed HCS sensor is broader than that reported for the guar gum/Au nanocomposite (22–75% RH)93 and polyaniline/tetrasulfonated phthalocyanine hybrid material (10–70% RH).94
The ammonia sensitivity of the pristine HCSs at 97% RH was zero. This behaviour could result from coverage of the HCS surface by water vapor molecules that inhibited ammonia adsorption. In contrast, the ammonia sensitivity of the HCS/PVP composites at 97% RH slightly increased due to the dispersion of the carbon–polymer composite on the surface. However, the PVP polymer played a role in decreasing the overall conductivity at higher RH due to swelling of the PVP. A similar behaviour has been reported in polymeric materials such as Nafion, in which the presence of water vapour molecules slows down the reaction rate and reduces the ammonia sensitivity.24 Interestingly, the ammonia sensitivity of annealed HCSs was lowest at 10% and 97% RH. This can be attributed to the removal of surface and structural defects which reduced the dependency of the ammonia response on the relative humidity upon annealing of the HCSs. Indeed, the presence of functional groups and defects affects ammonia adsorption on the HCSs. As seen from Table 3 the overall ammonia sensitivity was highest in the annealed HCSs under almost all the conditions used. This further highlights the role of the degree of graphitization of HCSs in improving the conductivity response in the presence of ammonia vapour.
A mechanism for understanding the RH and ammonia sensing process could be explained based on the pore filling effect.61 The conductivity of ammonia and water molecules that fill the HCS surface pores is higher than that of air. Upon exposure to water vapour (RH), the water vapor infiltrates the interparticle voids and the surface pores. The lone pair of electrons on the water molecule can interact with the carbon surface inducing a dipole charge. The dipole charge is then transferred from carbon atom to carbon atom enhancing the conductivity (Fig. 7a). In addition, since the water molecules are physically adsorbed on the surface, the high dipole moment of the H2O allows for charge transport through proton hopping, hence increasing the conductance on the HCS surface.
 | ||
| Fig. 7 A schematic representation of the sensing mechanism of the HCSs (a) at low and high RH (b) for ammonia. | ||
Likewise, the ammonia molecules can physisorb onto the carbon surface and interact through the lone pair of electrons that creates a dipole charge in the spheres leading to an increase in the ammonia conductivity (Fig. 7b). Consequently, the infiltration of the ammonia in the carbon pores further enhances the ammonia response in the carbon materials. The response of the HCSs towards ammonia is highly dependent on the presence of surface hydroxyl groups and amorphous defects. However, the sensing mechanism of the HCS/PVP composite is different from that of the HCSs. Thus, the polymer is also expected to influence the response. A decrease in surface hydroxyl groups and amorphous domains increases the ammonia interaction with the annealed HCSs and hence the conductivity. Also, the BET surface area and pore volume of the annealed HCSs were higher than those of the pristine HCSs enhancing the HCS surface interactions with ammonia. Thus, the ammonia and the RH response of the HCSs can be varied by changing the surface chemistry.
However, in the presence of both ammonia and water vapour, ammonia can take a proton from water to form an ammonium ion:
| NH3(aq) + H2O(l) ↔ NH4+(aq) + OH−(aq) | (3) |
Both the ammonium and hydrogen ion can permeate through the carbon matrix resulting in an increase in the conductivity. Thus, an ion facilitated conductivity change is likely to affect the ammonia sensing properties of HCSs in a humid environment.
3.7 Application of the tristimulus methodology
To elaborate the influence of both ammonia and RH on the HCS sensors, a simple pattern recognition technique method based on a previously reported generalized tristimulus analysis (that accepts positive or negative sensitivities without loss of information) was applied.95 Briefly, this approach takes the responses of three different sensors of the used array that were assumed to have a linear response with respect to the concentration of the analyte, as three components of the tristimulus vector![[r with combining right harpoon above (vector)]](https://www.rsc.org/images/entities/i_char_0072_20d1.gif) = α[A]
= α[A]![[x with combining circumflex]](https://www.rsc.org/images/entities/i_char_0078_0302.gif) + β[A]ŷ + γ[A]ẑ. The responses, Ii, of the three sensors can be written as I1 = α[A], I2 = β[A] and I3 = γ[A], where α, β and γ are the respective sensitivities and [A] denotes the ammonia concentration. This tristimulus vector has no dependence on the concentration of the analyte. In the generalized tristimulus approach, we analyze the coordinates of the point where the tristimulus vector crosses a unitary radius spherical shell given by
+ β[A]ŷ + γ[A]ẑ. The responses, Ii, of the three sensors can be written as I1 = α[A], I2 = β[A] and I3 = γ[A], where α, β and γ are the respective sensitivities and [A] denotes the ammonia concentration. This tristimulus vector has no dependence on the concentration of the analyte. In the generalized tristimulus approach, we analyze the coordinates of the point where the tristimulus vector crosses a unitary radius spherical shell given by  , as shown in Fig. 8.
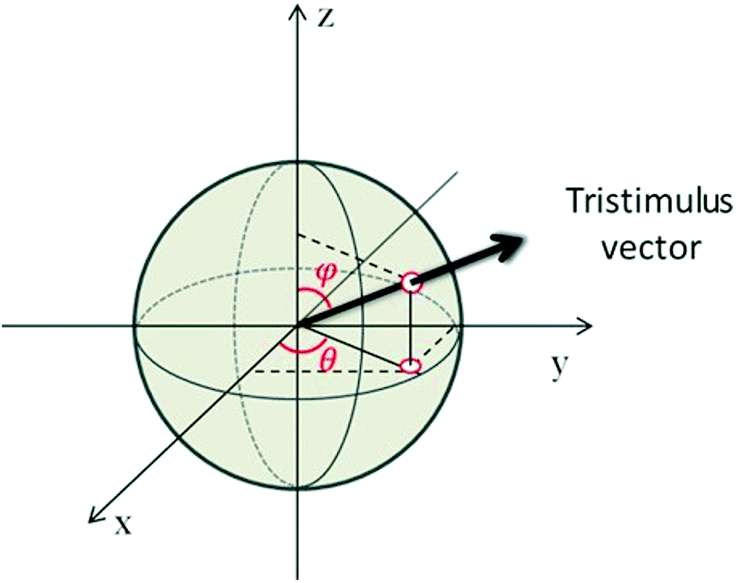 | ||
| Fig. 8 Geometrical representation of the tristimulus vector crossing a unitary radius spherical shell showing the angles ϕ and θ. | ||
The coordinates of the point are given by eqn (4).
 | (4) |
The angular coordinates ϕ and θ at the point where the vector crosses the unitary radius spherical shell can be written as
 | (5) |
The angle θ is plotted using the function atan2, which analyzes the input argument (α and β) signals returning the correct quadrant of the angle, in a range of −π ≤ θ < π. These angles ϕ and θ constitute a signature of the analyte, confining the coordinates to the intervals 0 ≤ ϕ < π and −π ≤ θ < π. Note that if the concentration of ammonia is increased or decreased, the coordinates of the point, and consequently the angles of the vector, will not change (assuming the constancy of α, β and γ). Only the magnitude of the vector will change (Fig. 8). If the humidity changes, a number of water molecules will interact with the active layer and change the response (and consequently the sensitivity), and this will relocate the tristimulus vector to other regions of the graph. Each region will give a cluster of points that correspond to a different humidity level. Fig. 9 shows the presence of four different cluster regions for 10%, 33%, 59–75% and 97% RH.
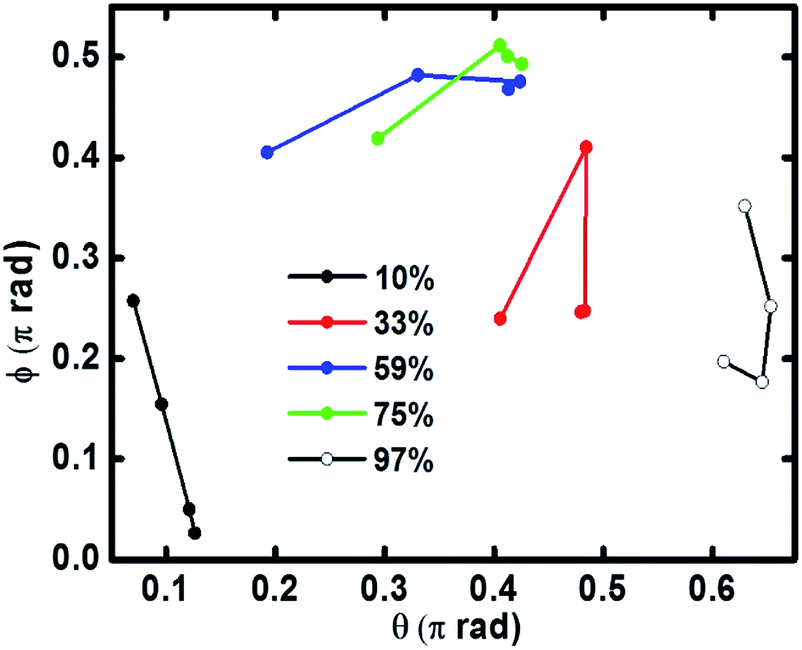 | ||
| Fig. 9 Angular coordinates ϕ and θ of the tristimulus vector of the sensor's array based on the pristine HCSs, the HCS/PVP composite and the annealed HCSs for the ammonia response at different RH levels. | ||
For each humidity cluster, the points corresponding to different ammonia concentrations do not overlap and this indicates that the different sensor responses to RH are not independent of each other, i.e., the variation of the ammonia concentration produces variations in the sensitivity to water (relative humidity), as evidenced by the spread of the points in each cluster (Fig. 9). In the case of ideally independent sensitivities, this spread should be very small and only due to electronic noise. An undesirable characteristic of the set of sensors shown in Fig. 9 is that it is not able to allow a distinction of RH values of 59% and 75%.
In practice, the sensor set response should give the humidity information. To obtain further information, a second analysis using a 3-D map can be used to evaluate the correct ammonia concentration in the ambient (see Fig. S8†). This second analysis complements the tristimulus one and makes possible a real time monitoring of ammonia at different RH levels. Thus, if the humidity cannot be determined from the tristimulus analysis (for example in the 59 and 75% RH cases), these two values can be determined from the 3D maps of the three sensors. Only the value that is obtained in the three maps is retained to give the correct ammonia concentration. The value of humidity that leads repeatedly to the same ammonia concentration information is then the correct humidity value. The procedure described above allows for the concomitant determination of ammonia concentration and relative humidity using a set of three sensors.
Further investigation is still necessary to find a set of sensors in which the clusters of points that correspond to different humidity levels do not overlap, resulting in a more precise estimation of the humidity. The ideal set would allow ammonia and RH determination to be established from only a tristimulus analysis.
4. Conclusions
This study reports on the response of hollow carbon spheres to ammonia and relative humidity. The conductivity of the pristine HCSs and HCS/PVP was dependent on the relative humidity with the best ammonia response at 10% RH. The best ammonia response of the annealed HCS materials was at 33% RH. The presence of surface hydroxyl groups and defect sites plays a critical role in varying the humidity response of the HCSs. The polymer enhanced the dispersion of the HCSs in the interdigitated electrode resulting in an increased conductivity at low RH. Annealing the HCSs decreased the RH dependency and increased the surface area and as a result, an overall increase in ammonia conductivity was observed. Importantly, the ammonia response and sensitivity of the annealed HCSs were found to be higher than those reported in the literature. The data provided insight into the sensor behaviour of carbon nanostructures towards ammonia and RH as a function of surface chemistry. We have shown that using a simple pattern recognition technique based on a generalized tristimulus analysis it is possible to simultaneously identify the RH of the ambient and the ammonia concentration.Acknowledgements
We thank the NRF, the University of Witwatersrand and the DST-NRF Centre of Excellence in Strong Materials for financial support. We also thank the CNPq and the Federal University of Parana for funding.References
- A. Beusen, A. Bouwman, P. Heuberger, G. Van Drecht and K. Van Der Hoek, Atmos. Environ., 2008, 42, 6067–6077 CrossRef CAS.
- B. Timmer, W. Olthuis and A. v. d. Berg, Sens. Actuators, B, 2005, 107, 666–677 CrossRef CAS.
- T. D. Durbin, R. D. Wilson, J. M. Norbeck, J. W. Miller, T. Huai and S. H. Rhee, Atmos. Environ., 2002, 36, 1475–1482 CrossRef CAS.
- S. Krupa, Environ. Pollut., 2003, 124, 179–221 CrossRef CAS PubMed.
- W. Chen, S. Laiho, O. Vaittinen, L. Halonen, F. Ortiz, C. Forsblom, P. Groop, M. Lehto and M. Metsälä, J. Breath Res., 2016, 10, 036011 CrossRef CAS PubMed.
- T. Hibbard, K. Crowley, F. Kelly, F. Ward, J. Holian, A. Watson and A. J. Killard, Anal. Chem., 2013, 85, 12158–12165 CrossRef CAS PubMed.
- P. K. Sekhar, E. L. Brosha, R. Mukundan, W. Li, M. A. Nelson, P. Palanisamy and F. H. Garzon, Sens. Actuators, B, 2010, 144, 112–119 CrossRef CAS.
- S. Baruah and J. Dutta, Environ. Chem. Lett., 2009, 7, 191–204 CrossRef CAS.
- Z. M. Rittersma, Sens. Actuators, A, 2002, 96, 196–210 CrossRef CAS.
- C. L. Cao, C. G. Hu, L. Fang, S. X. Wang, Y. S. Tian and C. Y. Pan, J. Nanomater., 2011, 2011, 5 Search PubMed.
- H. Yu, T. Cao, L. Zhou, E. Gu, D. Yu and D. Jiang, Sens. Actuators, B, 2006, 119, 512–515 CrossRef CAS.
- T. Fei, K. Jiang, F. Jiang, R. Mu and T. Zhang, J. Appl. Polym. Sci., 2014, 131, 39726 Search PubMed.
- R. Pati, Y. Zhang, S. K. Nayak and P. M. Ajayan, Appl. Phys. Lett., 2002, 81, 2638 CrossRef CAS.
- B. Patissier, Sens. Actuators, B, 1999, 59, 231–234 CrossRef CAS.
- T. V. Duncan, J. Colloid Interface Sci., 2011, 363, 1–24 CrossRef CAS PubMed.
- L. He, Y. Jia, F. Meng, M. Li and J. Liu, Mater. Sci. Eng., B, 2009, 163, 76–81 CrossRef CAS.
- R. Ghosh, A. Midya, S. Santra, S. K. Ray and P. K. Guha, ACS Appl. Mater. Interfaces, 2013, 5, 7599–7603 CAS.
- N. A. Travlou, M. Seredych, E. Rodriguez-Castellon and T. J. Bandosz, J. Mater. Chem. A, 2015, 3, 3821–3831 CAS.
- X. Feng, S. Irle, H. Witek, K. Morokuma, R. Vidic and E. Borguet, J. Am. Chem. Soc., 2005, 127, 10533–10538 CrossRef CAS PubMed.
- J. A. Robinson, E. S. Snow, Ş. C. Bǎdescu, T. L. Reinecke and F. K. Perkins, Nano Lett., 2006, 6, 1747–1751 CrossRef CAS PubMed.
- P. C. Watts, N. Mureau, Z. Tang, Y. Miyajima, J. D. Carey and S. R. P. Silva, Nanotechnology, 2007, 18, 175701 CrossRef.
- P.-G. Su and J.-F. Tsai, Sens. Actuators, B, 2009, 135, 506–511 CrossRef CAS.
- F. Rigoni, G. Drera, S. Pagliara, A. Goldoni and L. Sangaletti, Carbon, 2014, 80, 356–363 CrossRef CAS.
- I. M. Raimundo and R. Narayanaswamy, Sens. Actuators, B, 2001, 74, 60–68 CrossRef CAS.
- W. S. Machado, P. L. Athayde, M. A. Mamo, W. A. L. van Otterlo, N. J. Coville and I. A. Hümmelgen, Org. Electron., 2010, 11, 1736–1739 CrossRef CAS.
- M. A. Mamo, W. S. Machado, N. J. Coville and I. A. Hümmelgen, J. Mater. Sci.: Mater. Electron., 2012, 23, 1332–1337 CrossRef CAS.
- B. B. Cunha, M. W. Greenshields, M. A. Mamo, N. J. Coville and I. A. Hümmelgen, J. Mater. Sci.: Mater. Electron., 2015, 26, 4198–4201 CrossRef CAS.
- M. A. Mamo, W. S. Machado, W. A. van Otterlo, N. J. Coville and I. A. Hümmelgen, Org. Electron., 2010, 11, 1858–1863 CrossRef CAS.
- I. A. Hümmelgen, N. J. Coville, I. Cruz-Cruz and R. Rodrigues, J. Mater. Chem. C, 2014, 2, 7708–7714 RSC.
- S. Dölle, B.-D. Lechner, J. H. Park, S. Schymura, J. P. F. Lagerwall and G. Scalia, Angew. Chem., Int. Ed., 2012, 51, 3254–3257 CrossRef PubMed.
- F. J. Torres-Canas, C. Blanc, C. Zamora-Ledezma, P. Silva and E. Anglaret, J. Phys. Chem. C, 2015, 119, 703–709 CAS.
- S. Santra, G. Hu, R. Howe, A. De Luca, S. Ali, F. Udrea, J. Gardner, S. Ray, P. Guha and T. Hasan, Sci. Rep., 2015, 5, 17374 CrossRef CAS PubMed.
- P. Majzlíková, J. Sedláček, J. Prášek, J. Pekárek, V. Svatoš, A. G. Bannov, O. Jašek, P. Synek, M. Eliáš and L. Zajíčková, Sensors, 2015, 15, 2644–2661 CrossRef PubMed.
- S. Cui, H. Pu, G. Lu, Z. Wen, E. C. Mattson, C. Hirschmugl, M. Gajdardziska-Josifovska, M. Weinert and J. Chen, ACS Appl. Mater. Interfaces, 2012, 4, 4898–4904 CAS.
- Y. Z. Jin, C. Gao, W. K. Hsu, Y. Zhu, A. Huczko, M. Bystrzejewski, M. Roe, C. Y. Lee, S. Acquah, H. Kroto and D. R. M. Walton, Carbon, 2005, 43, 1944–1953 CrossRef CAS.
- A. A. Deshmukh, S. D. Mhlanga and N. J. Coville, Mater. Sci. Eng., R, 2010, 70, 1–28 CrossRef.
- B. Jang, K. Yang, B. Quan and Y. Piao, Mater. Lett., 2013, 104, 68–71 CrossRef CAS.
- J. B. Joo, P. Kim, W. Kim, J. Kim, N. D. Kim and J. Yi, Curr. Appl. Phys., 2008, 8, 814–817 CrossRef.
- P.-j. Cai and L. Feng, Mater. Chem. Phys., 2008, 108, 1–3 CrossRef CAS.
- M. Sasidharan, D. Liu, N. Gunawardhana, M. Yoshio and K. Nakashima, J. Mater. Chem., 2011, 21, 13881–13888 RSC.
- N. A. Travlou, M. Seredych, E. Rodríguez-Castellón and T. J. Bandosz, J. Mater. Chem. A, 2015, 3, 3821–3831 CAS.
- N. A. Travlou, M. Seredych, E. Rodríguez-Castellón and T. J. Bandosz, Carbon, 2016, 96, 1014–1021 CrossRef CAS.
- T. N. Phaahlamohlaka, D. O. Kumi, M. W. Dlamini, L. L. Jewell and N. J. Coville, Catal. Today, 2016, 275, 76–83 CrossRef CAS.
- S. Li, A. Pasc, V. Fierro and A. Celzard, J. Mater. Chem. A, 2016, 4, 12686–12713 CAS.
- I. Nongwe, V. Ravat, R. Meijboom and N. J. Coville, Appl. Catal., A, 2013, 466, 1–8 CrossRef CAS.
- I. Nongwe, G. Bepete, A. Shaikjee, V. Ravat, B. Terfassa, R. Meijboom and N. J. Coville, Catal. Commun., 2014, 53, 77–82 CrossRef CAS.
- Z. Wen, Q. Wang, Q. Zhang and J. Li, Electrochem. Commun., 2007, 9, 1867–1872 CrossRef CAS.
- Y. Chen, P. Xu, M. Wu, Q. Meng, H. Chen, Z. Shu, J. Wang, L. Zhang, Y. Li and J. Shi, Adv. Mater., 2014, 26, 4294–4301 CrossRef CAS PubMed.
- K. Tang, L. Fu, R. J. White, L. Yu, M. M. Titirici, M. Antonietti and J. Maier, Adv. Energy Mater., 2012, 2, 873–877 CrossRef CAS.
- B. K. Mutuma, B. Matsoso, K. Ranganathan, D. Wamwangi and N. J. Coville, RSC Adv., 2016, 6, 20399–20408 RSC.
- M. W. Greenshields, I. A. Hümmelgen, M. A. Mamo, A. Shaikjee, S. D. Mhlanga, W. A. Van Otterlo and N. J. Coville, J. Nanosci. Nanotechnol., 2011, 11, 10211–10218 CrossRef CAS PubMed.
- L. Greenspan, J. Res. Natl. Bur. Stand., 1977, 81, 89–96 CrossRef.
- K. Wilgosz, X. Chen, K. Kierzek, J. Machnikowski, R. J. Kalenczuk and E. Mijowska, Nanoscale Res. Lett., 2012, 7, 1–5 CrossRef PubMed.
- S. Brunauer, P. H. Emmett and E. Teller, J. Am. Chem. Soc., 1938, 60, 309–319 CrossRef CAS.
- E. P. Barrett, L. G. Joyner and P. P. Halenda, J. Am. Chem. Soc., 1951, 73, 373–380 CrossRef CAS.
- M. Thommes, Chem. Ing. Tech., 2010, 82, 1059–1073 CrossRef CAS.
- A. C. Ferrari, Solid State Commun., 2007, 143, 47–57 CrossRef CAS.
- M. A. Pimenta, G. Dresselhaus, M. S. Dresselhaus, L. G. Cancado, A. Jorio and R. Saito, Phys. Chem. Chem. Phys., 2007, 9, 1276–1290 RSC.
- C. Petit, K. Kante and T. J. Bandosz, Carbon, 2010, 48, 654–667 CrossRef CAS.
- M. Gautam and A. H. Jayatissa, Solid-State Electron., 2012, 78, 159–165 CrossRef CAS.
- K. Singh, N. A. Travlou, S. Bashkova, E. Rodríguez-Castellón and T. J. Bandosz, Carbon, 2014, 80, 183–192 CrossRef CAS.
- J. Wang, P. Yang, X. Wei and Z. Zhou, Nanoscale Res. Lett., 2015, 10, 119 CrossRef PubMed.
- T. Patois, J.-B. Sanchez, F. Berger, J.-Y. Rauch, P. Fievet and B. Lakard, Sens. Actuators, B, 2012, 171–172, 431–439 CrossRef CAS.
- T. Patois, J.-B. Sanchez, F. Berger, P. Fievet, O. Segut, V. Moutarlier, M. Bouvet and B. Lakard, Talanta, 2013, 117, 45–54 CrossRef CAS PubMed.
- S. M. M. Zanjani, M. M. Sadeghi, M. Holt, S. F. Chowdhury, L. Tao and D. Akinwande, Appl. Phys. Lett., 2016, 108, 033106 CrossRef.
- A. K. Geim and K. S. Novoselov, Nat. Mater., 2007, 6, 183–191 CrossRef CAS PubMed.
- K. S. Novoselov, A. K. Geim, S. V. Morozov, D. Jiang, Y. Zhang, S. V. Dubonos, I. V. Grigorieva and A. A. Firsov, Science, 2004, 306, 666–669 CrossRef CAS PubMed.
- S. Iijima, Nature, 1991, 354, 56–58 CrossRef CAS.
- S. Iijima and T. Ichihashi, Nature, 1993, 363, 603–605 CrossRef CAS.
- A. Lerf, H. He, M. Forster and J. Klinowski, J. Phys. Chem. B, 1998, 102, 4477–4482 CrossRef CAS.
- D. R. Dreyer, S. Park, C. W. Bielawski and R. S. Ruoff, Chem. Soc. Rev., 2010, 39, 228–240 RSC.
- R. Ghosh, A. Singh, S. Santra, S. K. Ray, A. Chandra and P. K. Guha, Sens. Actuators, B, 2014, 205, 67–73 CrossRef CAS.
- J. Wu, K. Tao, J. Miao and L. K. Norford, ACS Appl. Mater. Interfaces, 2015, 7, 27502–27510 CAS.
- X. Huang, N. Hu, R. Gao, Y. Yu, Y. Wang, Z. Yang, E. Siu-Wai Kong, H. Wei and Y. Zhang, J. Mater. Chem., 2012, 22, 22488–22495 RSC.
- Q. Liang, D. Li, S. Gao, D. Jiang, J. Zhao, J. Qin and J. Hou, Chin. Sci. Bull., 2014, 59, 447–451 CrossRef CAS.
- A. Joshi, S. A. Gangal and S. K. Gupta, Sens. Actuators, B, 2011, 156, 938–942 CrossRef CAS.
- F. Shao, F. Hernández-Ramírez, J. D. Prades, C. Fàbrega, T. Andreu and J. R. Morante, Appl. Surf. Sci., 2014, 311, 177–181 CrossRef CAS.
- Y. Zhou, B. Wang, X. Song, E. Li, G. Li, S. Zhao and H. Yan, Appl. Surf. Sci., 2006, 253, 2690–2694 CrossRef CAS.
- J. Chu, X. Peng, P. Feng, Y. Sheng and J. Zhang, Sens. Actuators, B, 2013, 178, 508–513 CrossRef CAS.
- X. Zhang, H. Ming, R. Liu, X. Han, Z. Kang, Y. Liu and Y. Zhang, Mater. Res. Bull., 2013, 48, 790–794 CrossRef CAS.
- S. Bhattacharya, D. K. Sharma, S. Saurabh, S. De, A. Sain, A. Nandi and A. Chowdhury, J. Phys. Chem. B, 2013, 117, 7771–7782 CrossRef CAS PubMed.
- D. Zhang, H. Chang, P. Li, R. Liu and Q. Xue, Sens. Actuators, B, 2016, 225, 233–240 CrossRef CAS.
- S. Ghosh, R. Ghosh, P. K. Guha and T. K. Bhattacharyya, IEEE Trans. Nanotechnol., 2015, 14, 931–937 CrossRef CAS.
- H. Bi, K. Yin, X. Xie, J. Ji, S. Wan, L. Sun, M. Terrones and M. S. Dresselhaus, Sci. Rep., 2013, 3, 2714 Search PubMed.
- W.-P. Chen, Z.-G. Zhao, X.-W. Liu, Z.-X. Zhang and C.-G. Suo, Sensors, 2009, 9, 7431–7444 CrossRef CAS PubMed.
- Z. Wang, Y. Xiao, X. Cui, P. Cheng, B. Wang, Y. Gao, X. Li, T. Yang, T. Zhang and G. Lu, ACS Appl. Mater. Interfaces, 2014, 6, 3888–3895 CAS.
- T.-F. Wu and J.-D. Hong, RSC Adv., 2016, 6, 96935–96941 RSC.
- G. Peng, S. Wu, J. E. Ellis, X. Xu, G. Xu, C. Yu and A. Star, J. Mater. Chem. C, 2016, 4, 6575–6580 RSC.
- S. Some, Y. Xu, Y. Kim, Y. Yoon, H. Qin, A. Kulkarni, T. Kim and H. Lee, Sci. Rep., 2013, 3, 1868 Search PubMed.
- I. Fratoddi, A. Bearzotti, I. Venditti, C. Cametti and M. V. Russo, Sens. Actuators, B, 2016, 225, 96–108 CrossRef CAS.
- P. Pacher, A. Lex, S. Eder, G. Trimmel, C. Slugovc, E. J. List and E. Zojer, Sens. Actuators, B, 2010, 145, 181–184 CrossRef CAS.
- C. S. Rout, M. Hegde, A. Govindaraj and C. Rao, Nanotechnology, 2007, 18, 205504 CrossRef.
- S. Pandey and K. K. Nanda, ACS Sens., 2016, 1, 55–62 CrossRef CAS.
- P. Gaudillat, F. Jurin, B. Lakard, C. Buron, J.-M. Suisse and M. Bouvet, Sensors, 2014, 14, 13476–13495 CrossRef CAS PubMed.
- R. Rodrigues and I. A. Hümmelgen, J. Solid State Electrochem., 2016, 20, 1295–1301 CrossRef CAS.
Footnote |
| † Electronic supplementary information (ESI) available. See DOI: 10.1039/c6ta09424d |
| This journal is © The Royal Society of Chemistry 2017 |