 Open Access Article
Creative Commons Attribution 3.0 Unported Licence
Stress relaxation in viscous soft spheres
Julia
Boschan
 *a,
Siddarth A.
Vasudevan
b,
Pouyan E.
Boukany
 b,
Ellák
Somfai
 c and
Brian P.
Tighe
 a
a
aDelft University of Technology, Process & Energy Laboratory, Leeghwaterstraat 39, 2628 CB Delft, The Netherlands. E-mail: J.Boschan-1@tudelft.nl
bDelft University of Technology, Department of Chemical Engineering, Van der Maasweg 9, 2629 HZ Delft, The Netherlands
cWigner Research Centre for Physics, Institute for Solid State Physics and Optics, Hungarian Academy of Sciences, Konkoly-Thege Miklós u. 29-33, 1121 Budapest, Hungary
First published on 22nd September 2017
Abstract
We report the results of molecular dynamics simulations of stress relaxation tests in athermal viscous soft sphere packings close to their unjamming transition. By systematically and simultaneously varying both the amplitude of the applied strain step and the pressure of the initial condition, we access both linear and nonlinear response regimes and control the distance to jamming. Stress relaxation in viscoelastic solids is characterized by a relaxation time τ* that separates short time scales, where viscous loss is substantial, from long time scales, where elastic storage dominates and the response is essentially quasistatic. We identify two distinct plateaus in the strain dependence of the relaxation time, one each in the linear and nonlinear regimes. The height of both plateaus scales as an inverse power law with the distance to jamming. By probing the time evolution of particle velocities during relaxation, we further identify a correlation between mechanical relaxation in the bulk and the degree of non-affinity in the particle velocities on the micro scale.
Viscoelasticity is associated with one or more time scales that reflect the changing balance between viscous loss and elastic storage as a material's response to mechanical perturbations evolves in time.1,2 Here we implement a standard rheometric test of viscoelasticity, namely stress relaxation in response to an instantaneous step strain, and apply it to a minimal numerical model for foams, emulsions, and soft colloidal suspensions.3
Our focus is on athermal systems close to the nonequilibrium (un)jamming transition, where the material develops rigidity under compression.4–6 Because the shear modulus vanishes continuously at the jamming point, weakly jammed states near the transition can be arbitrarily soft.5 Intuition then suggests that their linear response window should also be narrow – small changes in strain amplitude should suffice to drive weakly jammed materials from linear to nonlinear response. Numerics confirm this expectation; under quasistatic shear, for example, the strain scales where the first contact change occurs and where bulk softening sets in both vanish as power laws with the pressure.7–9 While there has recently been considerable interest in the nonlinear response near jamming,7–21 the form of the relaxation time for large strain steps remains an important open question. Here we demonstrate for the first time that, as the system passes from linear to nonlinear response, relaxation times depend not only on the material constitution, but also on the amplitude of a shear perturbation.
A diverging relaxation time is an important mechanical property of soft amorphous matter near jamming.22–24 In the jammed phase, the stress relaxation time τ* describes the time needed to reach a new mechanical equilibrium after a sudden shear strain.9 In the linear response, the divergence of τ* as the confining pressure p is sent to zero signals the loss of rigidity.23 The unjammed phase displays a similarly growing time scale, which marks a crossover from the power law to exponential stress relaxation.25 Both linear and nonlinear stress relaxation can be characterized with the relaxation modulus Gr(t,γ0), which describes the time evolution of the shear stress σ(t,γ0) after a step strain with amplitude γ0,
 | (1) |
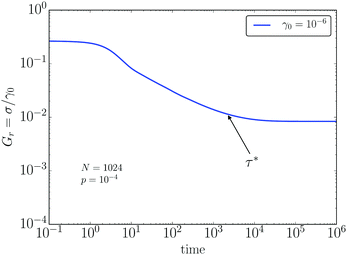
Existing theoretical23 and numerical9 studies of Gr near jamming are valid only in the linear response regime. Its typical form is illustrated in Fig. 1. After a brief plateau at short times, Gr undergoes a power law decay before reaching a quasistatic plateau. The relaxation time is the time needed to reach the quasistatic plateau. In linear response it diverges as an inverse power law with p.9,23,26,27
Numerical studies of nonlinear response near jamming typically neglect rate-dependent effects by focusing on quasistatic shear.7–9,15,19 They have identified two important linear-to-nonlinear crossover strain scales. The first corresponds to the breakdown of linear response on the scale of individual particle trajectories, which is driven by changes to the contact network.7–10,12,14 The contact change strain scales as γcc ∼ p1/2/N.7–9 The second characteristic strain corresponds to softening, i.e. the loss of linearity in the average stress–strain curve. It scales as γ† ∼ p.9,15,19 Note that these two strains scale differently with p; we will revisit this observation below.
In the present work we study the linear and nonlinear relaxation times of weakly jammed solids over a wide range in pressure and strain amplitude γ0 connecting linear and nonlinear response. Our central finding is that the relaxation time as a function of γ0 displays two plateaus: one in the linear regime, and a second, higher plateau at larger strains. The pressure dependence of these two plateaus is identical, i.e. they diverge as power laws with the same exponent. This is a surprising result, as there is no a priori reason for their exponents to be the same. We further relate the form of τ* to the time evolution of floppy-like, non-affine particle motions during relaxation.
1 Methods and model
Foams are modeled with the Durian bubble model3 in two dimensions. Bubbles are represented as disks that repel elastically when they overlap, with an additional dissipative force proportional to their relative velocity. The elastic force between particles i and j is proportional to their overlap δij = (Ri + Rj) − rij, where Ri and Rj denote the radii and rij is the length of the vector![[r with combining right harpoon above (vector)]](https://www.rsc.org/images/entities/i_char_0072_20d1.gif) ij, pointing from the center of particle i to the center of particle j,
ij, pointing from the center of particle i to the center of particle j, | (2) |
 | (3) |
The stress tensor is
 | (4) |
Initial conditions are created by randomly populating the simulation box and then using an energy minimization protocol to quench instantaneously to a local minimum of the elastic potential energy at a fixed volume. The box is then allowed to undergo small changes in size and shape to achieve a target pressure p and zero shear stress – these are called “shear-stabilized” packings in the nomenclature of Dagois-Bohy et al.28 The pressure provides a convenient measure of proximity to the (un)jamming point at p = 0. Packings are bidisperse to avoid crystallization; we use the standard5,29 50–50 mixture of small and large particles and a radius ratio of 1![[thin space (1/6-em)]](https://www.rsc.org/images/entities/char_2009.gif) :
:![[thin space (1/6-em)]](https://www.rsc.org/images/entities/char_2009.gif) 1.4. Once the initial state is prepared, we use molecular dynamics simulations to apply shear, which allows us to resolve the time evolution of the system. Newton's laws are integrated using a velocity Verlet algorithm.
1.4. Once the initial state is prepared, we use molecular dynamics simulations to apply shear, which allows us to resolve the time evolution of the system. Newton's laws are integrated using a velocity Verlet algorithm.
2 Stress relaxation at finite strain
In order to describe the mechanical relaxation of soft sphere packings, we investigate the system's shear stress in response to an instantaneous step strain of amplitude γ0 applied at time t = 0. The strain is imposed using Lees-Edwards periodic boundary conditions while displacing the particles' coordinates (xi, yi) affinely according to (xi, yi) → (xi + γ0y, yi). In order to stay clear of any spurious periodic signatures in our results, we restrict applied strains to γ0 < 0.01; this is still large enough to observe the softening crossover for the highest pressure we simulate, as discussed below. For times t > 0 after the instantaneous shear, the periodic boundaries are kept fixed in their strained position and the particles are allowed to relax to a new mechanical equilibrium. The resulting stress relaxation is illustrated in Fig. 1, which shows the relaxation modulus Gr(t,γ0) as a function of time t for a single strain amplitude and pressure.The relaxation modulus displays several noteworthy features. There is an initial plateau at times shorter than the damping time τ0 ≡ 1, which occurs because viscous forces inhibit the system from relaxing at a rate faster than 1/τ0. On longer time scales, the shear modulus decreases as a power law 1/tθ with an exponent θ = 1/2.9,23 This relaxation continues until the stress reaches a second, long time plateau. The height of the plateau defines a quasistatic modulus G(γ0), which approaches the linear elastic shear modulus G0 = G(0) in the limit of vanishing strain amplitude. The crossover between power law relaxation and the quasistatic plateau defines the relaxation time τ*(γ0).
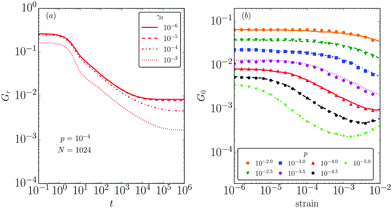
Fig. 2a illustrates the evolution of the relaxation modulus with increasing strain amplitude at a pressure p = 10−4, which is representative of the entire range of pressures simulated here. All curves show qualitatively similar time evolution. However, there is a crossover with increasing γ0. For the small values γ0 = 10−6 and 10−5 (solid and dashed curves), the relaxation modulus collapses, which is indicative of linear response. For higher strain amplitudes, beginning here around γ0 = 10−4, the entire curve shifts downward. This is strain softening. Softening is also evident in the quasistatic modulus G(γ0), estimated from Gr(t = 106,γ0), which we plot in Fig. 2b for varying pressures (symbols). At low strains the modulus remains constant, consistent with linear response. Softening corresponds to a subsequent decrease in G(γ0) with increasing γ0. This general trend is evident at all pressures.
Strain softening has been explored previously in ref. 9, where it was found that the onset of softening occurs at a strain scale proportional to p, after a finite fraction of the particles have undergone contact changes. There shear was built up incrementally using a quasistatic protocol, so that the final amplitude γ0 was reached via a large number of small steps Δγ. Once the linear response has broken down and the system has begun to soften, however, there is no fundamental reason that the result of an incremental quasistatic protocol should correspond to the long time limit of viscoelastic relaxation after a single large step strain. It is therefore surprising that when we overplot the results for incremental strain from ref. 9 (lines), we find near perfect agreement between the two data sets. This suggests that, on average, the two protocols reach the same minimum in the energy landscape of the sheared system.
3 Relaxation time and strain dependence
We now investigate the time τ*(γ0) needed to reach the quasistatic plateau after a strain of amplitude γ0. While linear response can be accessed with careful numerical experiments,9,23 one would prefer to have a complete characterization of the dependence of the relaxation time, not just on p, but also on the amplitude γ0 of the strain step. Our main result is the observation of a plateau in τ* at large γ0, with pressure dependence comparable to the relaxation time in linear response.We identify τ* as the time when the relaxation modulus reaches a value 1 + Δ times its value in the long time plateau. In the following we set Δ = 1/e; we have verified that our results are representative of a range of values for Δ. We simulate relaxation time measurements for stress relaxation over three decades in pressure, p = 10−2⋯10−5, and four decades in strain amplitude, γ0 = 10−6⋯10−2. Results are averaged over at least 500 realizations per condition. In MD simulations the total simulated time is limited by the available computational resources; especially for the lowest pressures and largest strain amplitudes, one can ask if the system might relax yet more at longer times. To exclude this possibility, we have also performed quasistatic simulations using the FIRE algorithm30 to determine the long time limit of the shear modulus. We then recalculate the relaxation time using the quasistatic plateau value, in combination with the time evolution of the MD simulation. These results are in good agreement with the relaxation times calculated directly from MD. Hence we are confident that our results are representative of fully relaxed packings.
The evolution of the relaxation time, plotted in Fig. 3, can be separated into three stages. At low strains, the response is linear and the plot of τ* versus γ0 plateaus, with the height of the plateau determined by the pressure. Next there is a second, intermediate regime, where linear response breaks down and the relaxation time begins to grow with increasing strain amplitude. The crossover causes the relaxation time to increase by approximately one order of magnitude. Finally, there is a regime at comparably high strains where τ* develops a second plateau. This trend continues throughout the studied pressure range, with the crossover shifting to higher strains with increasing pressure. As a result, the linear response window is at the edge of the sampled strain range for the lowest pressures, while the nonlinear plateau is only beginning to develop for the highest pressure.
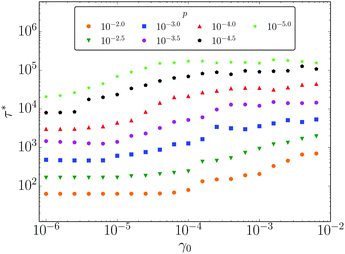 | ||
| Fig. 3 The relaxation time τ* as a function of strain γ0 for system size N = 2048 and varying pressures, p = 10−5⋯10−2 (see legend). | ||
In order to highlight pressure dependence, we seek to collapse the relaxation time data by plotting τ*/pλversus γ0/pν. We select λ = 0.85, which is the relaxation time exponent identified numerically in our prior study of strictly linear response,9 and close to the theoretically predicted value of 1.23 For the strain axis rescaling we select ν = 0.5, which is characteristic of the contact change strain scale γcc discussed above.7–9 This choice is motivated by comparing Fig. 2b and 3, where one observes that the upturn in τ* for increasing γ0 always occurs at a strain where the quasistatic shear modulus is still approximately flat, i.e. before the onset of softening. The rescaled data, plotted in Fig. 4, show good collapse over the entire range of strains and pressures. There is a small departure for the lowest pressure (i.e. closest to jamming) at the highest strain amplitudes, which may be associated with finite size effects.
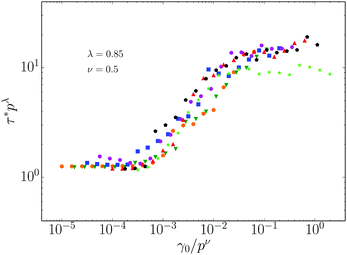 | ||
| Fig. 4 Data collapse of the relaxation time. Data are identical to Fig. 3. | ||
The data collapse in Fig. 4 indicates one of our central results, namely that the relaxation time plateaus at low and high strains diverge as inverse power laws with p, with the same characteristic exponent λ. We consider this result surprising, as there is no fundamental reason that the divergence of the relaxation times at finite strains should comply with the form for infinitesimal strain. The rescaling of the strain axis with p0.5, and the position of the crossover at a value γ0/p0.5 ∼ ![[scr O, script letter O]](https://www.rsc.org/images/entities/char_e52e.gif) (1/N), strongly suggest that the increase in relaxation time is associated with the onset of contact changes, and therefore the breakdown of linearity in the particles' trajectories. We have verified that a plot with γ0/p on the x-axis produces a significantly worse collapse, and also that reducing the system size shifts the crossover to higher strains.
(1/N), strongly suggest that the increase in relaxation time is associated with the onset of contact changes, and therefore the breakdown of linearity in the particles' trajectories. We have verified that a plot with γ0/p on the x-axis produces a significantly worse collapse, and also that reducing the system size shifts the crossover to higher strains.
4 Relaxation and non-affine particle motion
When jammed solids are sheared, particles primarily slide past their contacting neighbors, rather than interpenetrating.11,23,26,31 This “floppy-like” motion is a precursor of true floppy modes, or zero frequency, non-rigid body eigenmodes, that appear below the jamming transition. Floppy-like motion is the physical origin of non-affine fluctuations. During floppy-like motion, relative displacements are predominantly perpendicular to the bond vector![[r with combining circumflex]](https://www.rsc.org/images/entities/b_char_0072_0302.gif) ij pointing from the center of particle i to the center of particle j, not parallel to it. Floppy and non-affine motion is well understood in linear elastic response.22,31 However, little is known about how these displacements evolve in time, and/or in nonlinear response. Here we study the time evolution of the relative velocity of contacting particles during linear and nonlinear stress relaxation.
ij pointing from the center of particle i to the center of particle j, not parallel to it. Floppy and non-affine motion is well understood in linear elastic response.22,31 However, little is known about how these displacements evolve in time, and/or in nonlinear response. Here we study the time evolution of the relative velocity of contacting particles during linear and nonlinear stress relaxation.
In order to analyze particle motions during relaxation, it is convenient to decompose each relative velocity vij into longitudinal and transverse parts according to
vij = v‖,ij![[r with combining circumflex]](https://www.rsc.org/images/entities/b_char_0072_0302.gif) ij + v⊥,ij ij + v⊥,ij![[t with combining circumflex]](https://www.rsc.org/images/entities/b_char_0074_0302.gif) ij, ij, | (5) |
![[r with combining circumflex]](https://www.rsc.org/images/entities/b_char_0072_0302.gif) ij direction, and the transverse velocity v⊥ is along
ij direction, and the transverse velocity v⊥ is along ![[t with combining circumflex]](https://www.rsc.org/images/entities/b_char_0074_0302.gif) ij =
ij = ![[r with combining circumflex]](https://www.rsc.org/images/entities/b_char_0072_0302.gif) ij × ẑ, defined with respect to the unit vector ẑ pointing out of the plane. By construction the particles have zero velocity at t = 0, and they approach a new static state at long times. During the relaxation process we follow the full statistics of the longitudinal and transverse velocities.
ij × ẑ, defined with respect to the unit vector ẑ pointing out of the plane. By construction the particles have zero velocity at t = 0, and they approach a new static state at long times. During the relaxation process we follow the full statistics of the longitudinal and transverse velocities.
Fig. 5 shows the probability distribution functions (PDF's) of |v‖| and |v⊥| for one pressure p = 10−3 and several times, presented in units of the relaxation time τ* (see legend). For both longitudinal and transverse velocities, the distribution grows as PDF ∼ v for small v. The tails at large v are approximately exponential for short times t/τ* ≪ 1. At longer times the distributions decay slower than an exponential and faster than a power law. Attempts to fit a stretched exponential do not yield a good fit. Rescaling velocities by their average value 〈v‖,⊥〉 at each time provides an approximate collapse for times t > τ*, although some scatter remains. Due to this rough collapse, in the remainder we focus on average quantities, namely on the root mean squared (rms) velocities vrms‖ ≡ 〈v‖2〉1/2 and vrms⊥ ≡ 〈v⊥2〉1/2.
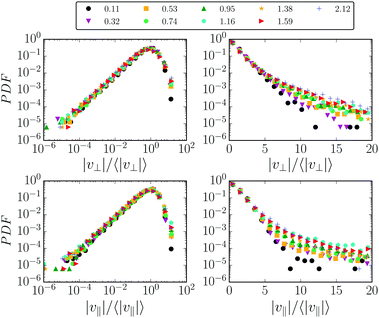 | ||
| Fig. 5 PDF's of longitudinal and transverse relative velocities at different times t/τ* (see legend) in log–log and semi-log representations at p = 10−3 and γ0 = 10−4. | ||
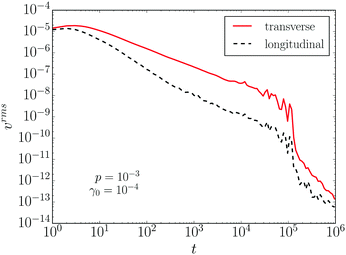
A representative example of the time evolution of the rms velocities is plotted in Fig. 6 for pressure p = 10−3 and strain γ0 = 10−4, averaged over an ensemble of 100 packings. Note that v⊥ is substantially larger than v‖ at all times, indicating that transverse motion is always dominant. After reaching their peak value at a time on the order of τ0, the velocities steadily decrease as the packing relaxes, until eventually they drop sharply and simultaneously due to a fraction of the packings that fully arrest. This drop occurs long after the relaxation time, which is of the order τ* ∼ ![[scr O, script letter O]](https://www.rsc.org/images/entities/char_e52e.gif) (103) for this value of p and γ0. Our interest here is primarily in the relaxation time τ*, so in the remainder we focus on data at times prior to the drop.
(103) for this value of p and γ0. Our interest here is primarily in the relaxation time τ*, so in the remainder we focus on data at times prior to the drop.
To further assess the character of the particle motions at finite time, we introduce the ratio of rms velocities
 | (6) |
Fig. 7 depicts 1/Γ for three values of the pressure and three values of the shear strain, for time intervals 10−3 ≤ t/τ* ≤ 10. In all cases 1/Γ decays, indicating that non-affinity increases with time. For further comparison, we overplot the corresponding Gr in each panel (dashed lines). There is an evident similarity in their decay profiles; this strongly suggests a correlation between the mechanical relaxation time τ* and the relaxation of floppy-like, non-affine fluctuations.
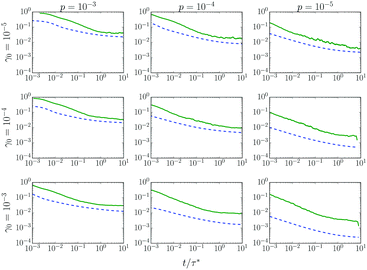 | ||
| Fig. 7 A comparison of the shear relaxation modulus Gr (dashed curves) with 1/Γ (solid curves) at three distinct pressures and strain amplitudes (see row and column labels). | ||
In order to further probe the correlation between stress relaxation and non-affine fluctuations, we investigate the time evolution of 1/Γ for three pressures and two values of the strain amplitude, as shown in Fig. 8. The first strain amplitude, γ0 = 10−6, is in the linear regime for all values of p, while the second, γ0 = 4 × 10⁻³, is in the second plateau of τ* in Fig. 4. For both low and high strain amplitudes, we find good data collapse when time is rescaled by τ* and Γ is rescaled with 1/p0.4. While the exponent 0.4 is determined empirically, it is in reasonable agreement with scaling arguments based on known relations in quasistatic linear response,27 which give Γ ∼ 1/p1/2.
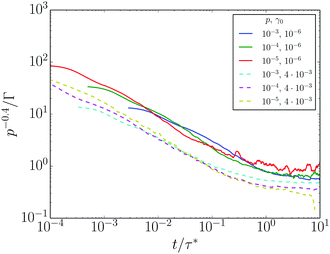 | ||
| Fig. 8 p −0.4/Γ plotted as a function of the rescaled time coordinate t/τ*. Solid and dashed curves are for (γ0,p) pairs corresponding respectively to the linear and nonlinear plateaus of τ* in Fig. 4. | ||
The data collapse in Fig. 8 is further evidence that the same physics governs the relaxation of non-affine fluctuations and stress, in both the linear and nonlinear regimes. The data of Fig. 7 and 8 together indicate a strong correlation between non-affinity at the micro scale, and stress response on the macro scale. They establish a microscopic interpretation of the relaxation time: it is the time scale beyond which floppy-like sliding motion (and hence non-affinity) fully dominates particle motion.
5 Conclusion
We have used stress relaxation tests to determine the relaxation time of jammed solids as a function of strain and pressure. For sufficiently low strains, the linear response is valid and the relaxation time approaches a plateau determined solely by the pressure. Close to jamming, the strains needed to access linear response are extremely small, and many experimental protocols are likely to probe nonlinear response even if care is taken to apply a small strain. Beyond linear response, contact changes accumulate leading to softening, and the relaxation time grows. We find a second plateau in which τ* is approximately independent of strain. To within the precision of our numerical measurement, this second plateau diverges at jamming with the same exponent that characterizes linear response. The crossover is associated with the onset of contact changes, and hence the post-crossover plateau should be accessible experimentally. Rheometry and simultaneous particle tracking in bubble rafts32–34 could also access measures of non-affinity.In order to relate τ* to the microscopic properties of the system, we have studied the statistics of floppy-like, non-affine motion, characterized by the time-dependent ratio Γ of the rms longitudinal and transverse velocities between particles in contact. We observe a strong correlation between Γ and the relaxation of shear stress in time. We infer that τ* can be understood as the time needed to observe a fully-developed non-affine response; once non-affinity has reached its maximum, the system's subsequent response is quasistatic.
There are several likely directions for future work. A natural question is whether the observed behavior of the relaxation time persists in D = 3 spatial dimensions. D = 2 is the upper critical dimension for the jamming transition,35,36 so we do not anticipate qualitative differences. One can also ask how the relaxation time develops for larger strains, up to and including the yielding crossover to steady plastic flow, which occurs for strains on the order of 10%.9 We speculate that there exists some strain scale beyond which the instantaneously applied step strain is tantamount to thermalization of the system, hence it may be possible to make connections to the late stages of relaxation after a temperature quench.37 Finally, it is also interesting to ask if there is any relationship between the relaxation time studied here and the duration of rearrangement events in steady plastic flow.38,39
Conflicts of interest
There are no conflicts to declare.Acknowledgements
JB and BPT received financial support from the Nederlandse Organisatie voor Wetenschappelijk Onderzoek (Netherlands Organization for Scientific Research, NWO). This work was also sponsored by NWO Exacte Wetenschappen (Physical Sciences) through the use of supercomputer facilities. ES was supported by the Hungarian National Research, Development and Innovation Office NKFIH under grant OTKA K 116036. SAV and PEB were supported by the European Research Council (ERC) under the European Union's Seventh Framework Programme (FP/2007-2013)/ERC Grant, agreement no. 337820.References
-
A. C. Pipkin, Lectures on Viscoelasticity Theory, Springer Science & Business Media, 2012, vol. 7 Search PubMed
.
-
H. A. Barnes and J. F. Hutton, An Introduction to Rheology, Elsevier, 1989 Search PubMed
.
- D. J. Durian, Phys. Rev. Lett., 1995, 75, 4780–4783 CrossRef CAS PubMed
.
- F. Bolton and D. Weaire, Phys. Rev. Lett., 1990, 65, 3449–3451 CrossRef CAS PubMed
.
- C. S. O'Hern, L. E. Silbert, A. J. Liu and S. R. Nagel, Phys. Rev. E: Stat., Nonlinear, Soft Matter Phys., 2003, 68, 011306 CrossRef PubMed
.
- M. van Hecke, J. Phys.: Condens. Matter, 2010, 22, 033101 CrossRef CAS PubMed
.
- M. S. van Deen, J. Simon, Z. Zeravcic, S. Dagois-Bohy, B. P. Tighe and M. van Hecke, Phys. Rev. E: Stat., Nonlinear, Soft Matter Phys., 2014, 90, 020202 CrossRef PubMed
.
- M. S. van Deen, B. P. Tighe and M. van Hecke, Phys. Rev. E, 2016, 94, 062905 CrossRef PubMed
.
- J. Boschan, D. Vågberg, E. Somfai and B. P. Tighe, Soft Matter, 2016, 12, 5450–5460 RSC
.
- G. Combe and J.-N. Roux, Phys. Rev. Lett., 2000, 85, 3628 CrossRef CAS PubMed
.
- M. Wyart, H. Liang, A. Kabla and L. Mahadevan, Phys. Rev. Lett., 2008, 101, 215501 CrossRef CAS PubMed
.
- C. F. Schreck, T. Bertrand, C. S. O'Hern and M. Shattuck, Phys. Rev. Lett., 2011, 107, 078301 CrossRef PubMed
.
- L. R. Gómez, A. M. Turner, M. van Hecke and V. Vitelli, Phys. Rev. Lett., 2012, 108, 058001 CrossRef PubMed
.
- E. Lerner, G. Düring and M. Wyart, Soft Matter, 2013, 9, 8252–8263 RSC
.
- M. Otsuki and H. Hayakawa, Phys. Rev. E: Stat., Nonlinear, Soft Matter Phys., 2014, 90, 042202 CrossRef PubMed
.
- C. Coulais, A. Seguin and O. Dauchot, Phys. Rev. Lett., 2014, 113, 198001 CrossRef CAS PubMed
.
- B. P. Tighe, Granular Matter, 2014, 16, 203–208 CrossRef CAS
.
- S. Farhadi, A. Z. Zhu and R. P. Behringer, Phys. Rev. Lett., 2015, 115, 188001 CrossRef PubMed
.
- D. Nakayama, H. Yoshino and F. Zamponi, J. Stat. Mech.: Theory Exp., 2016, 2016, 104001 CrossRef
.
- L. Gartner and E. Lerner, Phys. Rev. E, 2016, 93, 011001 CrossRef PubMed
.
- I. Srivastava and T. S. Fisher, Soft Matter, 2017, 13, 3411–3421 RSC
.
- M. Wyart, S. R. Nagel and T. A. Witten, Europhys. Lett., 2005, 72, 486 CrossRef CAS
.
- B. P. Tighe, Phys. Rev. Lett., 2011, 107, 158303 CrossRef PubMed
.
- K. Khakalo, K. Baumgarten, B. P. Tighe and A. Puisto, arXiv:1706.03932, 2017.
- T. Hatano, Phys. Rev. E: Stat., Nonlinear, Soft Matter Phys., 2009, 79, 050301 CrossRef PubMed
.
- B. P. Tighe, Phys. Rev. Lett., 2012, 109, 168303 CrossRef PubMed
.
- K. Baumgarten and B. P. Tighe, arXiv:1708.05241, 2017.
- S. Dagois-Bohy, B. P. Tighe, J. Simon, S. Henkes and M. van Hecke, Phys. Rev. Lett., 2012, 109, 095703 CrossRef PubMed
.
- D. J. Koeze, D. Vågberg, B. B. Tjoa and B. P. Tighe, EPL, 2016, 113, 54001 CrossRef
.
- E. Bitzek, P. Koskinen, F. Gähler, M. Moseler and P. Gumbsch, Phys. Rev. Lett., 2006, 97, 170201 CrossRef PubMed
.
- W. G. Ellenbroek, E. Somfai, M. van Hecke and W. van Saarloos, Phys. Rev. Lett., 2006, 97, 258001 CrossRef PubMed
.
- J. Lauridsen, M. Twardos and M. Dennin, Phys. Rev. Lett., 2002, 89, 098303 CrossRef PubMed
.
- G. Katgert, M. E. Möbius and M. van Hecke, Phys. Rev. Lett., 2008, 101, 058301 CrossRef PubMed
.
- M. E. Möbius, G. Katgert and M. van Hecke, EPL, 2010, 90, 44003 CrossRef
.
- C. P. Goodrich, A. J. Liu and S. R. Nagel, Phys. Rev. Lett., 2012, 109, 095704 CrossRef PubMed
.
- C. P. Goodrich, S. Dagois-Bohy, B. P. Tighe, M. van Hecke, A. J. Liu and S. R. Nagel, Phys. Rev. E: Stat., Nonlinear, Soft Matter Phys., 2014, 90, 022138 CrossRef PubMed
.
- D. A. Head, Phys. Rev. Lett., 2009, 102, 138001 CrossRef PubMed
.
- S. Tewari, D. Schiemann, D. J. Durian, C. M. Knobler, S. A. Langer and A. J. Liu, Phys. Rev. E: Stat. Phys., Plasmas, Fluids, Relat. Interdiscip. Top., 1999, 60, 4385 CrossRef CAS
.
- I. K. Ono, S. Tewari, S. A. Langer and A. J. Liu, Phys. Rev. E: Stat., Nonlinear, Soft Matter Phys., 2003, 67, 061503 CrossRef PubMed
.
| This journal is © The Royal Society of Chemistry 2017 |

