
 Open Access Article
 This Open Access Article is licensed under a
 Creative Commons Attribution 3.0 Unported Licence
Free energy calculations for rings and chains formed by dipolar hard spheres
Michela
Ronti
 *a,
Lorenzo
Rovigatti
bc,
José M.
Tavares
de,
Alexey O.
Ivanov
fg,
Sofia S.
Kantorovich
af and
Francesco
Sciortino
c
*a,
Lorenzo
Rovigatti
bc,
José M.
Tavares
de,
Alexey O.
Ivanov
fg,
Sofia S.
Kantorovich
af and
Francesco
Sciortino
c
aUniversity of Vienna, Sensengasse 8, 1090 Vienna, Austria. E-mail: michela.ronti@univie.ac.at
bCNR-ISC, Uos Sapienza, Piazzale A. Moro 2, 00185 Roma, Italy
cUniversity of Rome La Sapienza, Piazzale Aldo Moro 2, I-00185, Rome, Italy
dCentro de Física Teórica e Computacional da Universidade de Lisboa, Faculdade de Ciências, Campo Grande, 1749-016 Lisbon, Portugal
eInstituto Superior de Engenharia de Lisboa-ISEL, Rua Conselheiro Emídio Navarro 1, 1950-062 Lisbon, Portugal
fUral Federal University, Lenin av. 51, 620000 Ekaterinburg, Russian Federation
gM.N. Mikheev Institute of Metal Physics UB RAS, S. Kovalevskaya Str. 18, Ekaterinburg, Russian Federation
First published on 4th October 2017
Abstract
We employ a method based on Monte Carlo grand-canonical simulations to precisely calculate partition functions of non-interacting chains and rings formed by dipolar hard spheres (DHS) at low temperature. The extended low temperature region offered by such cluster calculations, compared to what had been previously achieved with standard simulations, opens up the possibility of exploring a part of the DHS phase diagram which was inaccessible before. The reported results offer the unique opportunity of verifying well-established theoretical models based on the ideal gas of cluster approximation in order to clarify their range of validity. They also provide the basis for future studies in which cluster–cluster interactions will be included.
1 Introduction
Since their synthesis,1 stable suspensions of magnetic nanoparticles, such as ferrofluids,2 have gained a lot of attention due to their broad potential in industrial3–5 and medical applications.6–12Nowadays it is possible to functionalise the nanoparticle surfaces,13,14 tune their shape15–21 and control their internal crystalline structure.22–24
Single-domain magnetic nanoparticles, having an intrinsic magnetic moment, effectively behave like nanomagnets. With sizes ranging from 10 to 50 nm, these magnetic nanocolloids, once in solution, experience brownian motion. In addition, provided the magnetic crystallographic anisotropy of a nanoparticle is energetically strong enough, the rotation of its magnetic moment is coupled to the rotation of the particle as a rigid body.25
The main interaction between the dipoles is a long-range anisotropic dipolar interaction. This interaction determines a preferred head-to-tail orientation of dipole moments. Thus, when thermal fluctuations are weaker than the magnetic attraction, magnetic nanocolloids exhibit directional self-assembly in linear flexible chains.26–31
However, the self-assembly scenario is not limited to linear chains: magnetic particles can also form ring structures32,33 and networks.34,35 Experimentally, all these clusters have been observed in solution using cryogenic electron microscopy36 and atomic force microscopy of assemblies at cross-linkable oil–water interfaces.37
Various simulation studies described self-assembly in magnetic nanocolloids by using simple models of dipolar hard- or soft-spheres.34,38,39 Despite the apparent simplicity of these models, the low-temperature portion of the phase diagram of dipolar hard and soft spheres remains obscure, with many different hypothesis having been put forward.40–44 Concerning the low-density portion of the phase diagram, a gas–liquid critical point has been found numerically for sequences of models that asymptotically tend towards the dipolar hard sphere (DHS).41–44 For instance, if the dipolar interaction is complemented by an attractive dispersion interaction a phase separation may occur.45–49 However, recent simulation studies32 suggest that dipolar interactions alone are not able to sustain a gas–liquid like phase separation, at odds with the pioneering predictions of de Gennes and Pincus.50
Recently, we showed that there is a structural chain-to-ring transition in a highly diluted gas of DHS as temperature decreases51 and extended this study to higher concentrations where various branched structures were also considered.52,53 These investigations provided a possible solution to a long-lasting debate about the non-monotonic temperature dependence of the initial magnetic susceptibility in suspensions of magnetic nanoparticles.54,55 These conclusions were based on results of Monte Carlo simulations and density functional theory. However, the main ingredients of the system free energy – the partition functions of various clusters – have never been extracted from the simulations and were only calculated approximately, albeit rather carefully, in analytical models.
In the present study we focus on providing a precise evaluation of the partition functions of DHS chains and rings as a function of their sizes. In order to do so, we first build on the simulation method proposed in ref. 56–58. This method is based on constrained grand canonical Monte Carlo single-cluster simulations. Secondly, we compare the available analytical expressions for the same quantities to the simulation data. Quite remarkably, the theoretical parameter-free expressions quantitatively reproduce the numerical data at low density.
The manuscript is organised as follows. In the next section we thoroughly describe our simulation approach. Next, in Section 3, we verify previously used analytical expressions for partition functions, and the density functional approach describing DHS self-assembly. The last section contains a summary of the work and some perspectives.
2 Simulation method
DHS systems are characterised by two interactions: the anisotropic dipole–dipole attraction and the steric repulsion. The anisotropic dipole–dipole interaction has the form: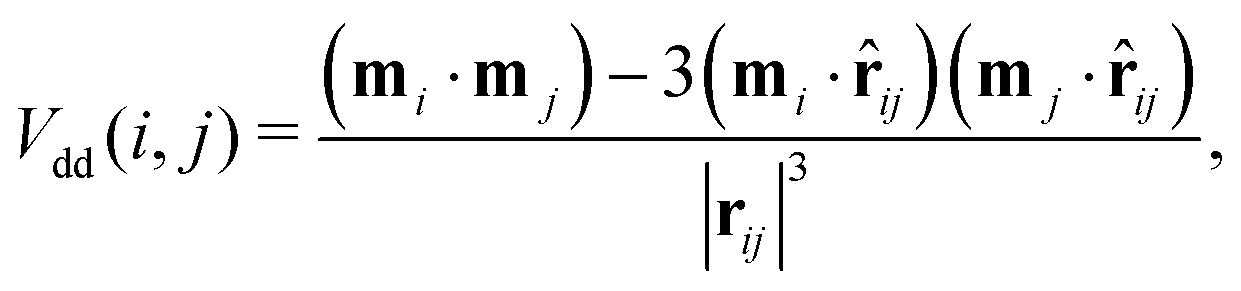 | (1) |
![[r with combining circumflex]](https://www.rsc.org/images/entities/b_char_0072_0302.gif) ij = rij/|rij|. In the present study we assume that all the magnetic moments have the same magnitude m. The steric repulsion has a standard hard-sphere form:
ij = rij/|rij|. In the present study we assume that all the magnetic moments have the same magnitude m. The steric repulsion has a standard hard-sphere form: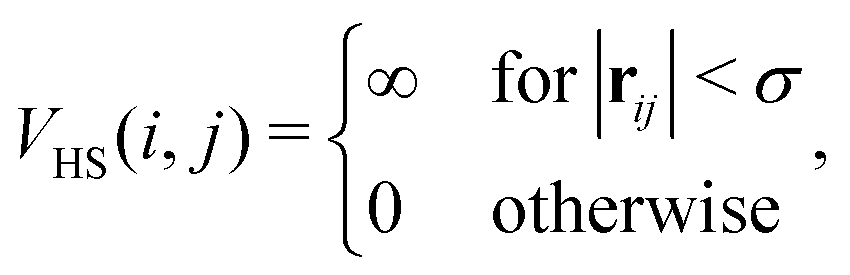 | (2) |
We define the cluster partition function ZN of a cluster made of N indistinguishable DHS particles as
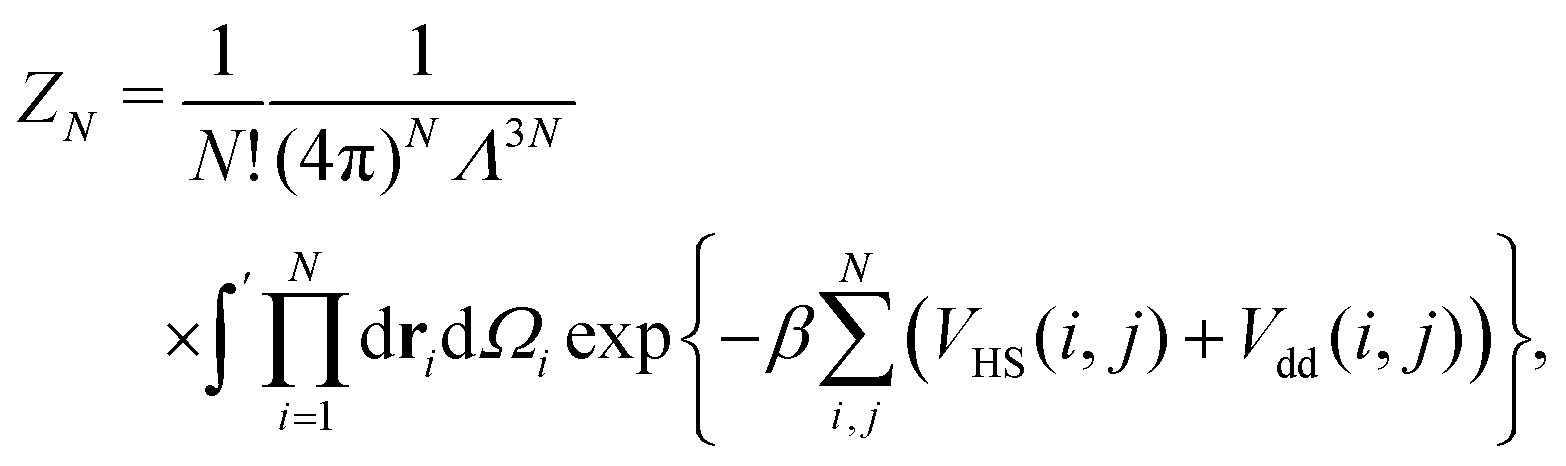 | (3) |
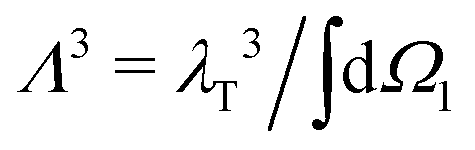 is the normalised thermal wavelength λT (arising from the integration over the translational and rotational momenta), convenient to define a spherically-averaged partition function. Here ri and Ωi denote the position and orientation of the i-th particle, respectively. The superscript ′ indicates that the sum is restricted to all phase space configurations for which the N particles form a cluster. A cluster is commonly defined as a collection of particles in which all possible pairs are connected via a sequence of bonds. Consequently, a preliminary step in every cluster calculation is the operative definition of bond, which will be given below. In the following we choose Λ3 = σ3 as the thermal volume.
Analytically, one can easily calculate the expressions for
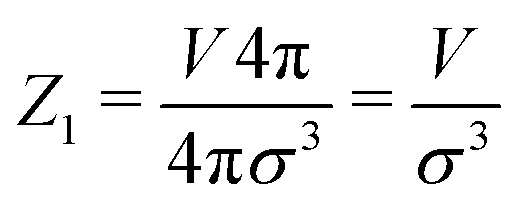 | (4) |
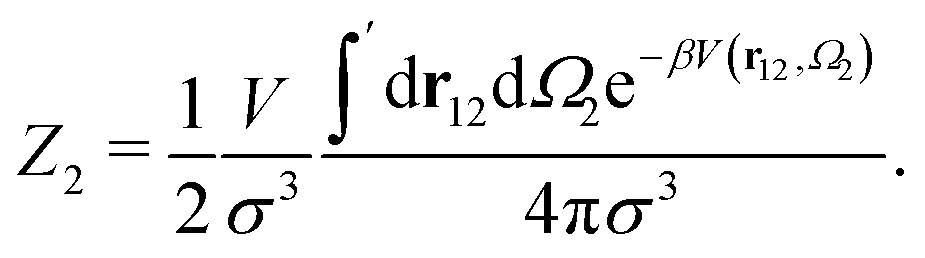 | (5) |
The ratio between the two has the form:
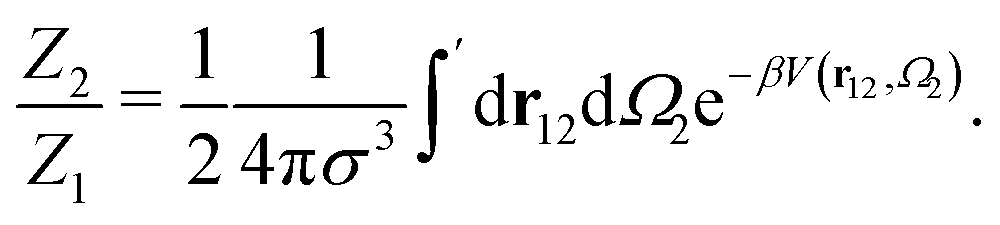 | (6) |
The evaluation of the cluster partition function (or cluster free energy) requires an average of the system Hamiltonian over all particle positions ri and dipolar orientations Ωi for which the cluster constraint is satisfied. A numerical evaluation of the free-energy requires in general a reversible path from an analytically-known reference system to the required thermodynamic state. In the case of a cluster, it is possible to define such a path connecting the required cluster size to a monomer (a cluster of size one), for which the partition function is analytically known (eqn (4)), via a path of clusters of all intermediate sizes. This idea, presented in ref. 56, and then optimised in later publications,57,58 requires a grand-canonical (GC) simulation (e.g. a simulation performed at fixed temperature T, volume V and activity z ≡ eβμ, with μ being the chemical potential) in which the particle additions and deletions are limited to configurations in which all particles in the system are part of a single cluster.
In the GC ensemble, the probability  of observing a cluster of size N is proportional to
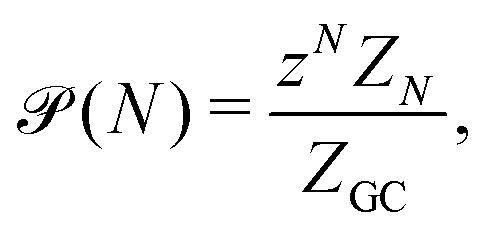 | (7) |
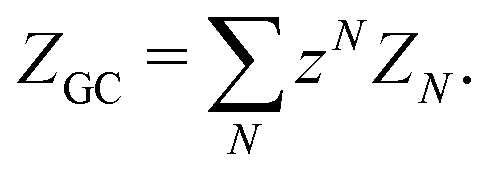 | (8) |
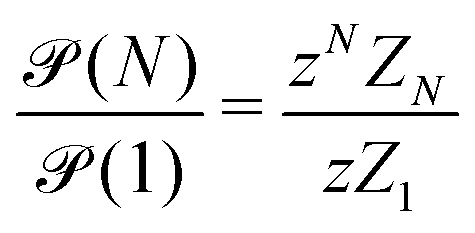 | (9) |
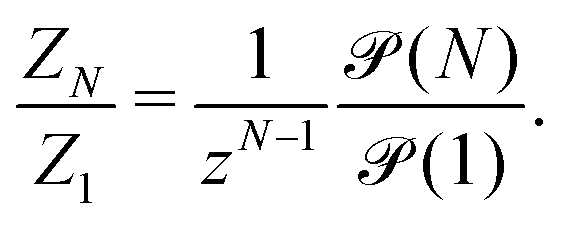 | (10) |
 is of order one for all N.
Our operative definition of a bond, initially proposed in ref. 32, employs a simple distance–energy criterion: two particles i and j are bonded if the interparticle distance rij < 1.3σ and if the interparticle potential energy Vdd(rij) < 0. The 1.3σ cut-off roughly coincides with the position of the first minimum in the radial distribution function, and hence selects particles belonging to the first neighbour shell. It is worth mentioning that there exist other criteria to define a bond.59–61 However, we do not expect the results to be sensitive to the precise definition of a bond at the values of T and ρ investigated here.
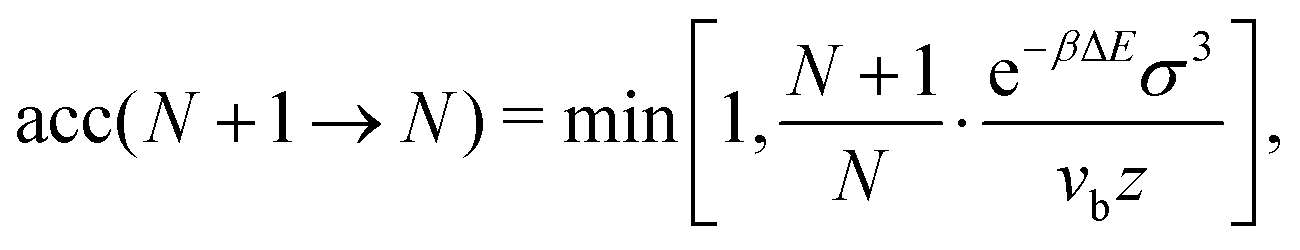
We run GC simulations with four types of MC moves: (i) the roto-translation move in which a random selected particle is displaced randomly by at most ±0.05σ and simultaneously randomly rotated by at most ±0.1 rad; (ii) the pivot move, in which a random particle i and one of its bonded neighbours j are selected; if the deletion of the bond splits the cluster in two pieces, then one of the two pieces is rotated by a random angle around the dipole direction of particle i. If new bonds are generated after the rotation, the move is rejected; (iii) the insertion of one particle inside a shell of internal radius σ and width 0.3σ (corresponding to an insertion volume 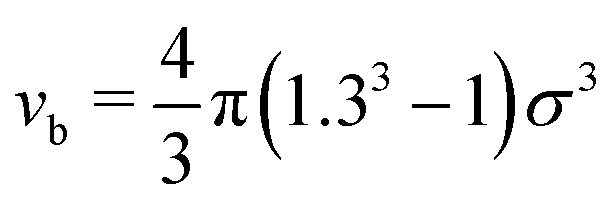 ) around a randomly selected particle; (iv) the deletion of one randomly selected particle. In all cases, the move is rejected if the final configuration is not composed by a single cluster. We find that the pivot move is particularly convenient to explore the low-T and low-ρ region in equilibrium and to sample the conformations of the self-assembled structures. This move – originally introduced by Lal62 and independently suggested by MacDonald et al.63 and by Mandras and Sokal64 – turns out to be highly efficient for studying configurational properties such as the physical size of the clusters. We note that no periodic boundary conditions are present (the volume is ideally infinite) and the potential energy of the system is composed by the sum of all N(N − 1)/2 interactions. The acceptance rules for inserting and deleting a particle have the form:58
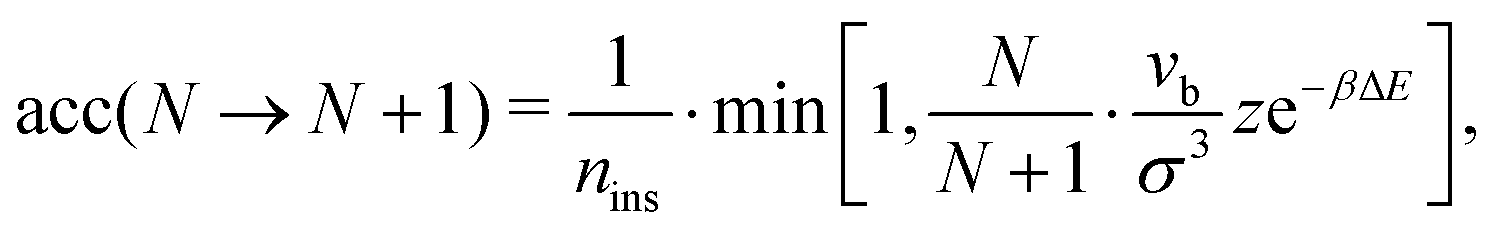 | (11) |
 | (12) |
The knowledge of the cluster partition function makes it possible to evaluate the cluster size distribution at any density under the hypothesis of an ideal gas of equilibrium clusters. Indeed, by minimizing the free energy of a gas of non-interacting clusters with respect to the cluster size distribution n(N), one obtains66,67
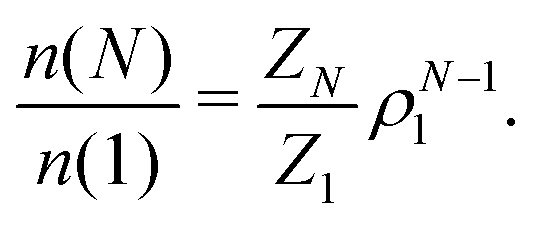 | (13) |
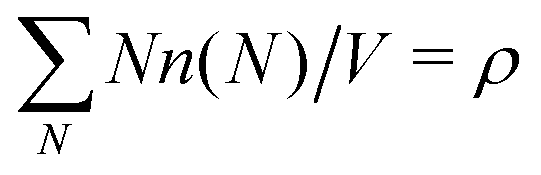 , where ρ is the dimensionless particle number density (multiplied by σ3) and
 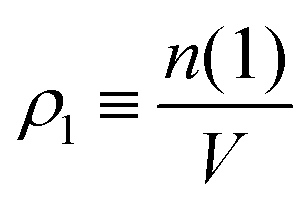 . It is also possible to take into account the excluded volume interaction in an approximate fashion by selecting the Carnahan–Starling expression for the free energy of hard spheres as the reference free energy of the fully monomeric state by writing58
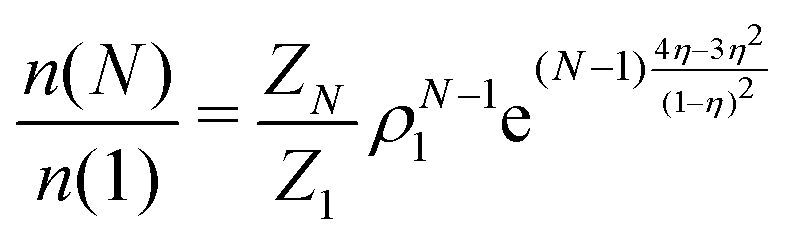 | (14) |
 .
.
During the course of each GC simulation we keep track of the number of configurations in which the cluster is a ring (configurations in which all particles have two bonds) or a chain (configurations in which N − 2 particles have two bonds and two particles have a single bond). The remaining configurations are classified as branched structures. Since the partition function ZN of a cluster of size N can be written as sum of the partition functions of rings ZringN, chains, ZchainN and branched structures of the same size ZbranchedN, it is possible to evaluate the ring and chain partition functions by multiplying the total partition function ZN by the probability of observing a ring Pr or a chain Pc.
3 Results and discussions
The calculated DHS partition functions can either be compared to known theoretical models or exploited to evaluate structural characteristics of the system. The first approach is very challenging, as only approximate partition functions can be obtained analytically. As for the cluster properties, they are usually estimated for finite particle concentrations. Consequently, one needs to separate the influence of inter-cluster interactions carefully. Here, we propose a combined approach. We use our numeric results to find the range of validity of known theoretical models for the partition functions of isolated clusters and for the free-energy density functional.3.1 Chains, rings and branched structures: relative relevance
The analysis of the conformations generated during the GCMC simulation allows us to evaluate the relative fraction of configurations which are in chains, rings and in branched structures for all investigated T. As alluded previously, these fractions are proportional to the partition functions of rings ZringN, chains, ZchainN and branched structures of the same size, normalized by the cluster partition function ZN. The results of such analysis are shown in Fig. 1. The data shows the complex interplay that determines the thermodynamic stability of the different clusters. On cooling, initially chains become more and more abundant, favoured by the progressive increase in the number of inter-particle bonds. By contrast, upon further cooling they give way to rings, structures which are favoured by one additional bond. At the lowest simulated temperature, chains have essentially disappeared. On decreasing temperature, branched clusters enter into play and become more abundant for progressively larger aggregates. Since branched clusters can be visualised as interacting chains and rings,53 in the following we focus predominantly on the elementary units, chains and rings.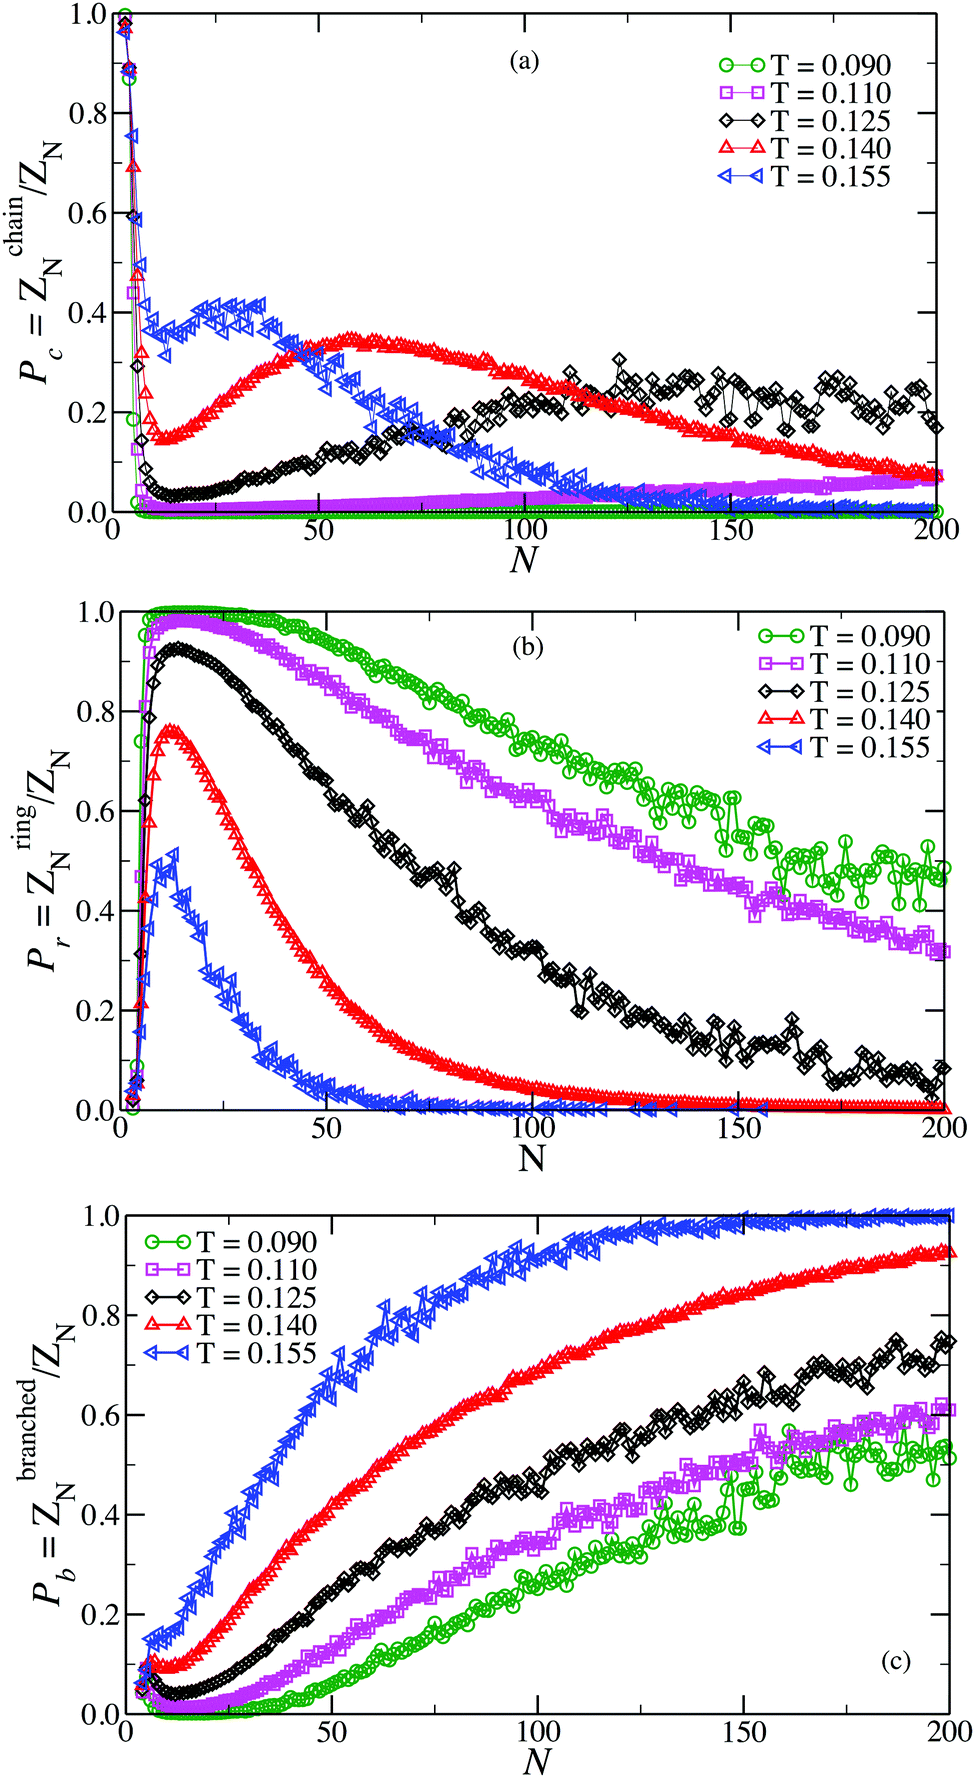 | ||
| Fig. 1 Probability of observing a chain Pc (a), a ring Pr (b) and a branched structure Pb (c) as a function of the cluster size N. | ||
3.2 Chain and ring partition functions
The only known method to calculate analytically the partition function of a DHS cluster with a given topology is to assume, in one way or another, a factorisation: the cluster free energy is reduced to a product of free energies of particle pairs. Thus, the basic ingredient required to analytically evaluate the partition function of any higher order cluster is the partition function of the dimer, eqn (5). There exist several ways to approximate such integral.68 Here, we use the one developed by Morozov and Shliomis in ref. 59, which is obtained through expanding the Hamiltonian in series in the vicinity of the close contact in a head-to-tail orientation and reads (coherently with the definition of ZN in eqn (3))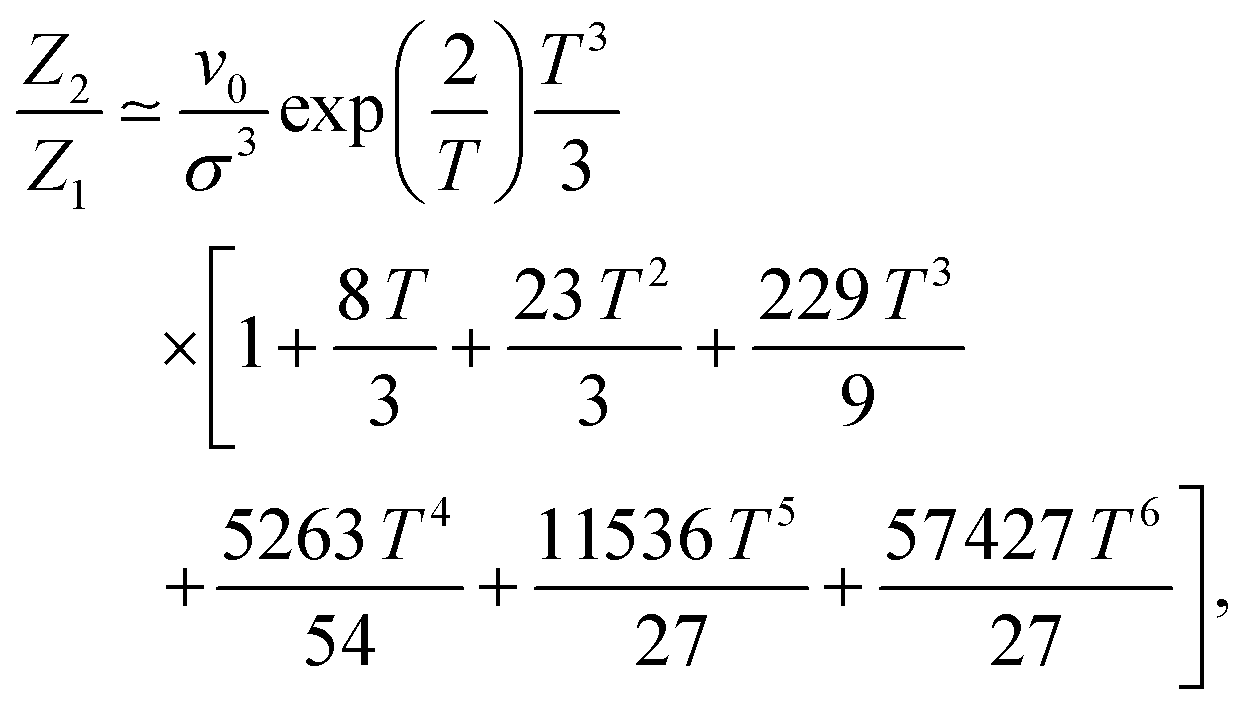 | (15) |
In Fig. 2, we show the comparison of the simulation data and analytical predictions, eqn (15), for various orders of the expansion. It turns out that, even though we are interested in the low-T limit, fluctuations from the head-to-tail orientation still matter, i.e. even for relatively large values of magnetic interactions, the last terms in the brackets are not negligible.
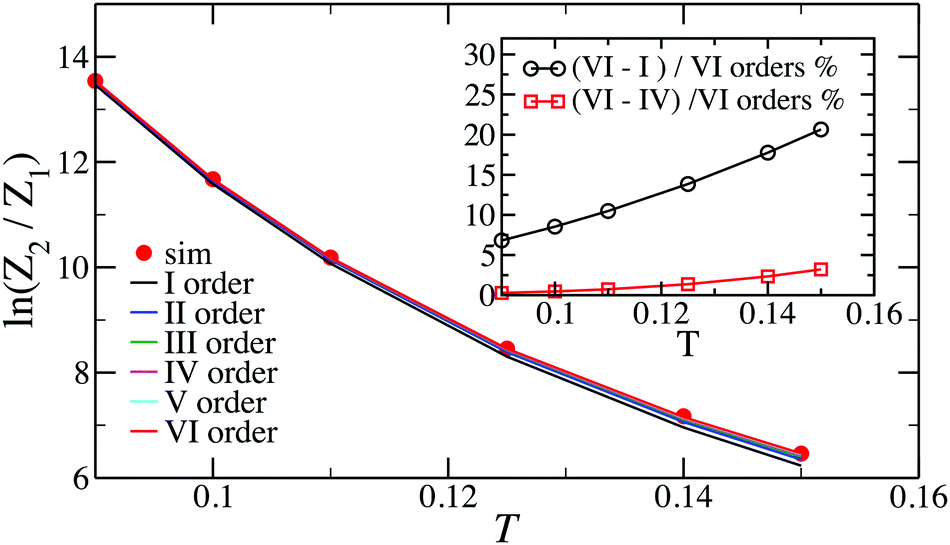 | ||
| Fig. 2 Plot of the logarithm of the dimer partition function normalised by the monomer partition function, ln(Z2/Z1). Inset: Relative contributions of the various terms to the expansions, expressed in per cent. | ||
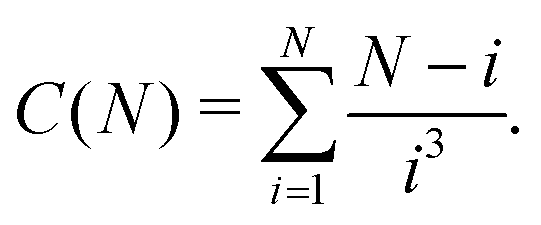
Dealing with larger clusters becomes significantly more complicated due to the fact that, even though the energetic contribution can be very well approximated by exp(2/T)T3/3, the fluctuations are defined not only by temperature, but also by the size and the topology of the cluster. As a consequence, analytical expressions for the partition functions are usually calculated taking into account nearest neighbours or next-nearest neighbour interactions only.69,70 Unfortunately, such an approximation turns out to be insufficient to describe the DHS self-assembly in the low-T regime. Consequently, the partition function of an N-particle chain that was previously developed in ref. 51 and 53 to analyse the structural transitions in low-density DHS systems takes the form
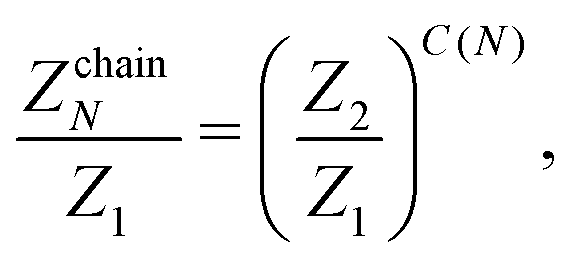 | (16) |
The latter expression is the result of considering all the distances between each pair of particles. Indeed, in a chain of size N there are N − 1 spheres separated by one diameter, N − 2 particles separated by two diameters, and so on, and only one pair of particles is separated by N − 1 diameters.
Similarly, the expression employed in ref. 51 for a N-particle ring partition function has the form:
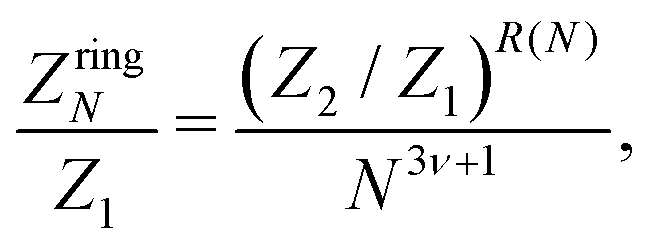 | (17) |
The term 1/N3ν+1 captures the difference in entropy between chains and rings arising from (i) the entropic contribution of the chain ends and (ii) the N ways of opening a ring to form a chain; ν = 0.588 is the self-avoiding random walk exponent,
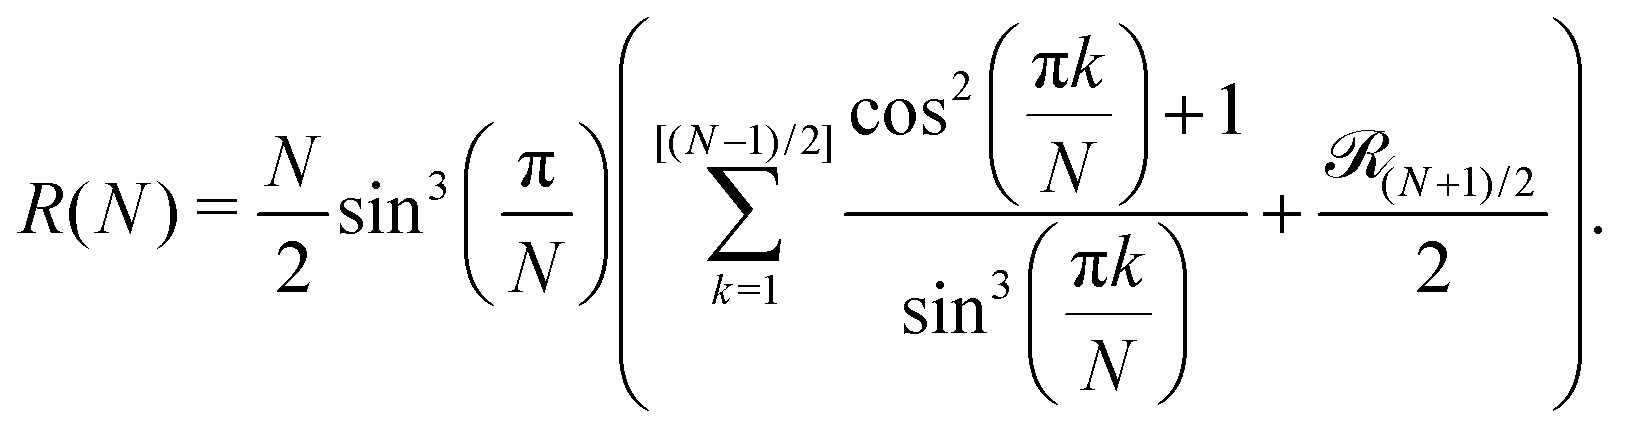
 stands for the residual of the division and [·] has the meaning of the integer part of the expression in the brackets. This expression was obtained by calculating all pair interactions in a perfect ring with dipoles oriented tangentially.71
Even though eqn (16) provides a nearly quantitative description of the aggregate formation in DHS systems at low and moderate densities, a closer look reveals a sizeable discrepancy, shown in Fig. 3. Here, the results of the simulations differ rather noticeably from theoretical predictions plotted with dashed lines, albeit only quantitatively. The partition functions calculated from eqn (17) are plotted in Fig. 4 with dashed lines. Analogously to the case of the chain partition function, we observe a small but noticeable difference with simulation data.
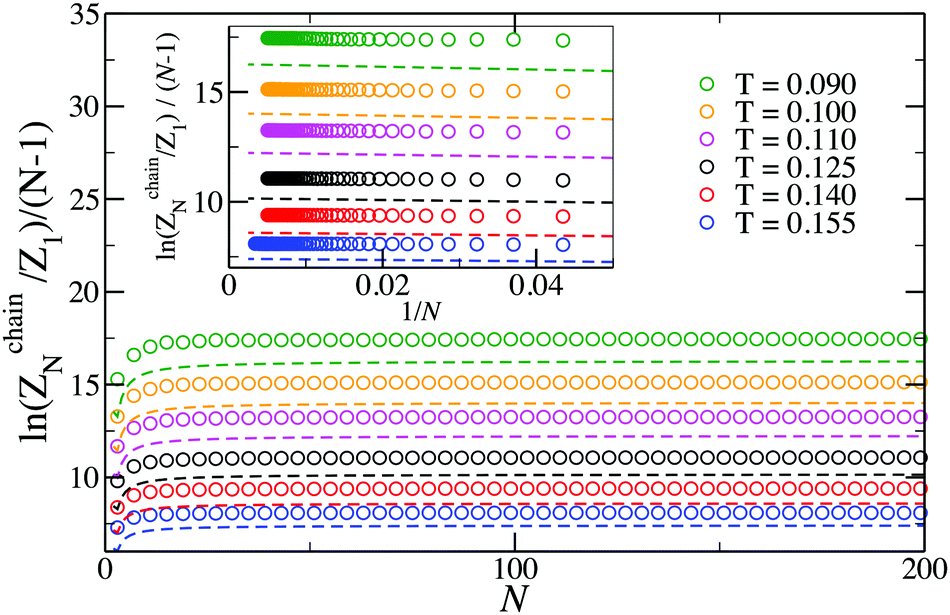 | ||
| Fig. 3 Plot of the logarithm of the N-particle chain partition function vs. N. The log of the partition function has been divided by N − 1 to highlight the contribution of each bond in the chain. Symbols are simulation results; dashed lines are predictions of eqn (16). | ||
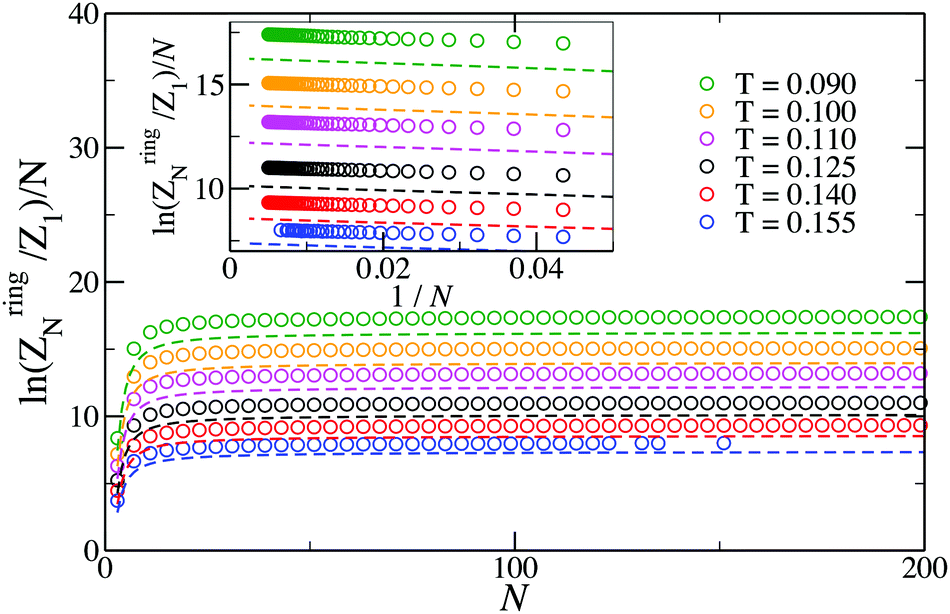 | ||
| Fig. 4 Plot of the logarithm of the N-particle ring partition function normalized by the number of bonds in the ring (N). Symbols are simulation results; dashed lines are predictions of eqn (17). At the highest temperature investigated here, T = 0.155, the lack of symbols at large N is due to the chance of finding rings of large sizes, N ≳ 100, being very small compared to finding branched structures of the same size (see Fig. 1). | ||
The task of improving the analytical expressions for chain and ring partition functions is not straightforward and will be the subject of future work. However, already at this stage we can profit from the knowledge of accurate numeric values for the partition functions and analyse the range of validity for the commonly used Density Functional Theory (see, e.g., ref. 51 and 53) to predict the DHS self-assembly and phase behaviour.
3.3 Cluster analysis
The knowledge of the cluster partition function makes it possible to evaluate the cluster size distribution at any density under the hypothesis of an ideal gas of chains and rings. The ideal gas of cluster approach includes the strong association that originates the formation of aggregates, but it neglects mutual interactions between these aggregates. In our case, this corresponds to neglecting all branched structures which can be considered as arising from the interaction between chains and rings.Indeed, by minimising the free energy of a gas of non-interacting clusters with respect to the cluster size distributions g(N) (chains) and f(N) (rings), (where g(N) and f(N) are defined as the number density of cluster of size N and g(1) is by definition the number density of monomers, e.g. chains of length one) one obtains51,53,66,67
 | (18) |
If ZchainN and ZringN are known and the number density of branched structures is negligible, then the mass-balance equation provides the unknown value of g(1) as
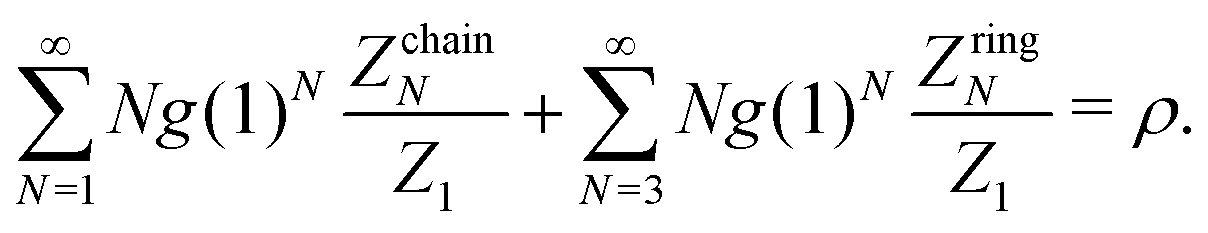 | (19) |
Strictly speaking, our approach is only valid at infinite dilution, when it is possible to consider the system as a collection of non-interacting chains and rings. Thus, comparing the distributions calculated via Grand-Canonical Monte Carlo simulations to those obtained through full simulations,32 we can find the DHS density at which the assumption of a system composed solely of non-interacting chains and rings breaks down. It is worth mentioning that there is one more difference between the two methods: single-cluster simulations are performed in vacuum, with no periodic boundary conditions such that the long-range nature of the interactions arising from the presence of other clusters is neglected. By contrast, the full canonical simulations employ periodic boundary conditions and hence require a special treatment for the long-range dipolar interactions, in this case performed through Ewald summations.72
In Fig. 5 we report the chain size distributions g(N)/g(1) calculated from the MC simulations performed in ref. 32 and compare them with the cluster size distributions g(N)/g(1) obtained from the GCMC simulations for several values of the DHS density. For the lowest density the chains are short and, for T > 0.125, a clear exponential decay is present. In addition, in this temperature range, the fraction of particles in chains grows monotonically with decreasing temperature. At lower temperature the tendency changes: the fraction of particles in chains decreases, and the exponential decay is replaced by a more complex dependence, which gets more resolved upon increasing density, finally becoming a shoulder for N ∈ (10…100). Up to ρ = 0.007, there is no influence of cluster–cluster interactions on the chain distributions, as the canonical (symbols) and single-cluster (lines) results coincide within the noise. However, the agreement worsens as ρ exceeds 0.028, as seen in Fig. 5(d).
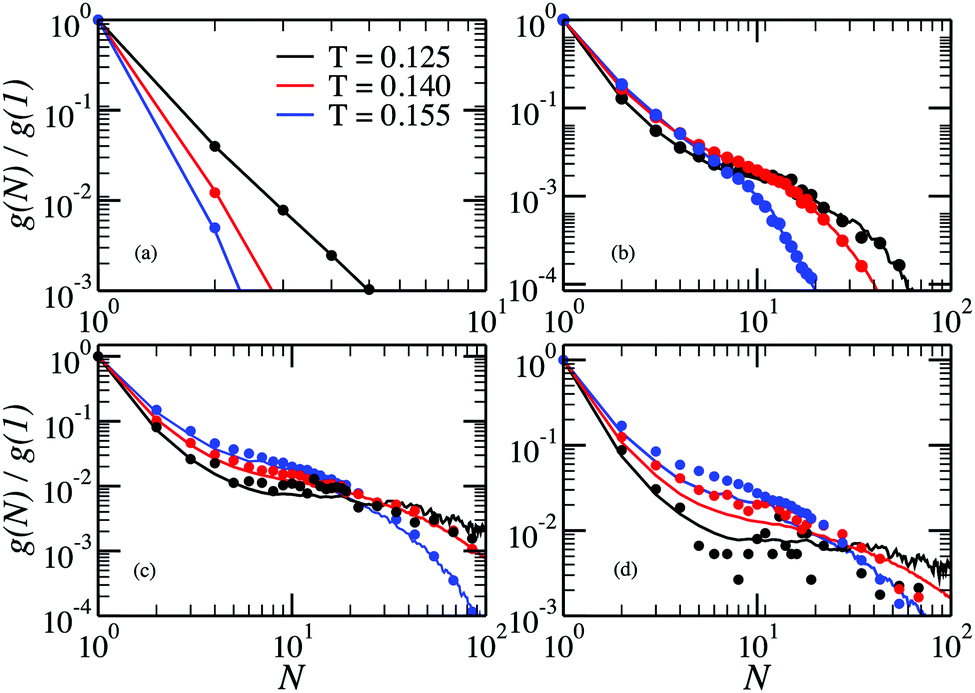 | ||
| Fig. 5 Chain size distributions at density (a) ρ = 0.00001 (b) ρ = 0.0005, (c) ρ = 0.007, (d) ρ = 0.028 as a function of the cluster size for different values of the temperature. The lines indicate the results from the single-cluster simulations and the symbols are directly obtained from the canonical MC simulations. | ||
The behaviour of rings is presented in Fig. 6. Here, we see that for low densities our new method provides another advantage: the fraction of rings at T = 0.155 can be accessed. In fact, the probability of observing a ring is so small that they are effectively not seen in the canonical simulations, whereas single-cluster simulations can even quantify it. At low ρ the fraction of rings has a clearly pronounced maximum that shift towards larger rings on cooling. The growing probability of finding a ring at low T explains the sudden decrease of the probability of finding a chain in the system. As for the chains, inter-cluster interactions become important at ρ = 0.028, and the cluster GC method fails to describe accurately the fraction of rings, especially at low T.
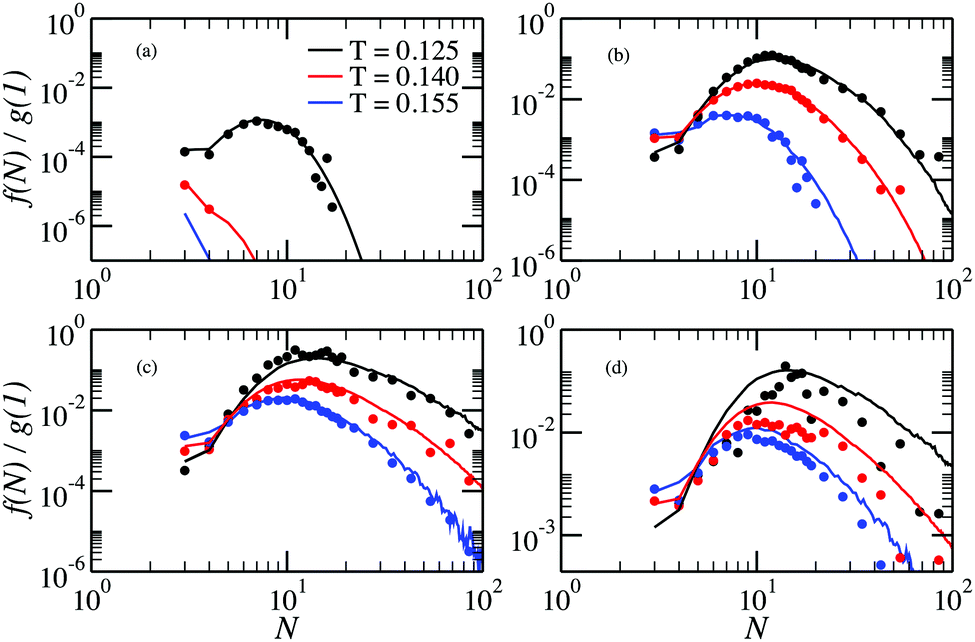 | ||
| Fig. 6 Ring size distributions at density (a) ρ = 0.00001, (b) ρ = 0.0005, (c) ρ = 0.007, (d) ρ = 0.028, as a function of the cluster size for different values of the temperature. Lines are results from single-cluster simulations, symbols are obtained from canonical MC simulations.33 | ||
From the cluster-size distributions we can conclude that the assumption of non-interacting chains and rings starts failing at ρ ∼ 0.028. This tendency can be seen even more clearly in Fig. 7, where we plot the average cluster size as a function of ρ for different temperatures. Here, one can see the comparison between canonical Monte Carlo results and theoretical estimates, computed through two different density functional approaches. The average cluster size – an integral characteristics of the system – turns out to be a very good indicator for the influence of the inter-cluster interaction. Indeed, we see that the limitations of the ideal gas of chains and rings manifest themselves at ρ < 0.001. The behaviour of the solid lines, which show the outcome of the density functional theory and cluster partition functions calculated here, demonstrate that according to the assumption of non-interacting chains and rings, the average chain length grows very rapidly with the particle concentration. At the same time, the usage of the analytically approximated partition functions (dashed lines) seems to better describe the average cluster size up to higher values of ρ. Such a serendipitous agreement has been previously taken as evidence to set the range of concentrations in which the cluster–cluster interactions can be neglected.53 However, the much better agreement, compared to the old approach, of the new data with the simulation data at very low concentrations demonstrate without any doubts the superiority of the former. As a result, the accurate calculation of the partition functions performed in this work reveals strikingly low values of particle concentration below which only chains and rings are present. At densities higher than these values branched (and eventually percolating) clusters become important and must be taken into account to correctly describe the system. This is especially important considering that real ferrofluids rarely contain less than 7–10 volume percent of magnetic nanoparticles, i.e. at least one order of magnitude more than the aforementioned limits.
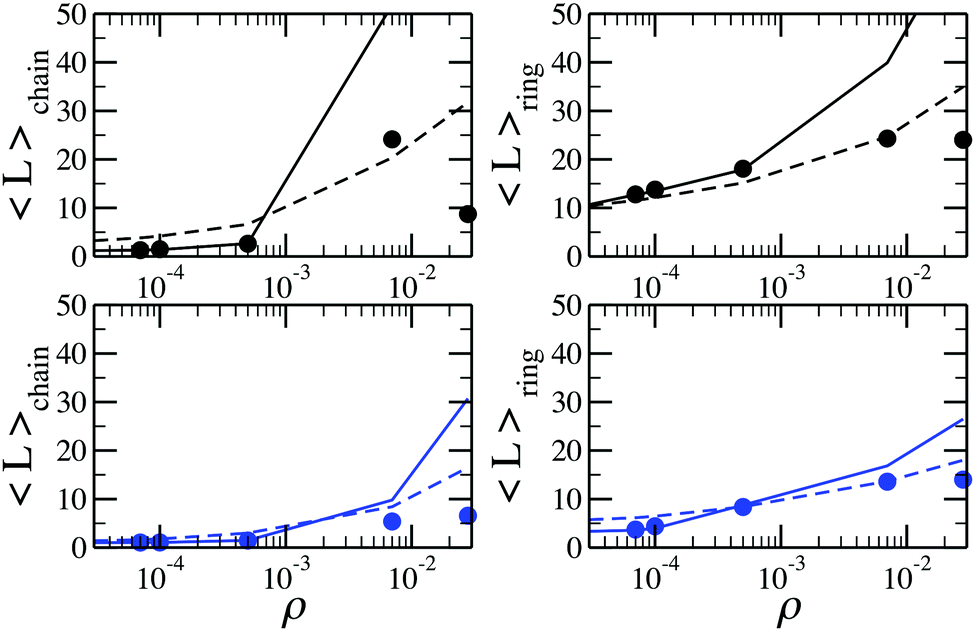 | ||
| Fig. 7 Average cluster size of (left) chains and (right) rings as a function of density for systems at (top, in black) T = 0.125 and (bottom, in blue) T = 0.155. Solid lines are results of the density functional calculations with cluster partition functions calculated with the method developed here; dashed lines are the predictions of the density functional theory with cluster partition functions calculated analytically; symbols are directly obtained from canonical MC simulations. | ||
The quality of the ideal-gas assumption affects more observables than the average cluster size. In Fig. 8 we present the fractions of particles aggregated in rings and chains, using the same notation convention. These plots show that the previously used expressions for partition functions (plotted with dashed lines) were responsible for the low-concentration (Fig. 8a) deviations of the DFT predictions and the results of the canonical Monte Carlos simulations (symbols). The last panel of the figure shows that already at ρ = 0.007 the majority of the particles in the canonical MC simulations are neither in a chain nor in a ring, demonstrating that the deviations between solid lines and points is to be ascribed to the formation of branched structures. The formation of the latter is a clear consequence of the arising of interactions between chains and rings. This effect becomes more and more important as ρ increases. It is worth noting that the fractions of particles in chains and rings seem to be more sensitive to the inter-cluster interactions than the cluster size distributions.
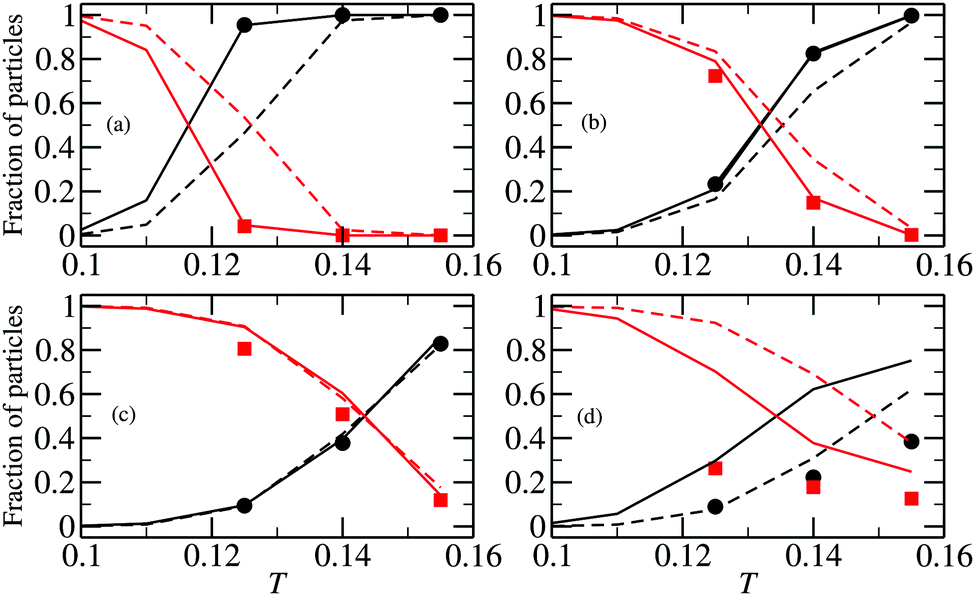 | ||
| Fig. 8 Fraction of particles in chains (in black) and rings (in red) as functions of temperature. (a) ρ = 0.00001, (b) ρ = 0.0001, (c) ρ = 0.0005, (d) ρ = 0.007. Solid lines are results of density functional calculations with the cluster partition functions calculated with the method developed here; dashed lines are the predictions of the density functional theory with the cluster partition functions calculated analytically; symbols are obtained from canonical MC simulations.51 | ||
In the last part of our discussion we present the ratios of ring fractions to chain fractions as a function of cluster size. This ratio can be found in Fig. 9 for two temperatures. The comparison between the results of the method developed here and of the DFT with approximated partition functions leads to an important observation: even though the two approaches yield different absolute values of the partition functions, as shown in Fig. 3 and 4, they both well reproduce the ratio between the ring and chain partition functions. It is clear that for an infinite ring and an infinite chain the difference between the partition functions should vanish. Besides that, as the accurate calculations of partition functions performed here show, chain and ring free energies behave in a qualitatively similar fashion with growing cluster size. However, the subtle differences in interparticle correlations within these structures have a clear effect on the fractions of various self-assembled clusters.
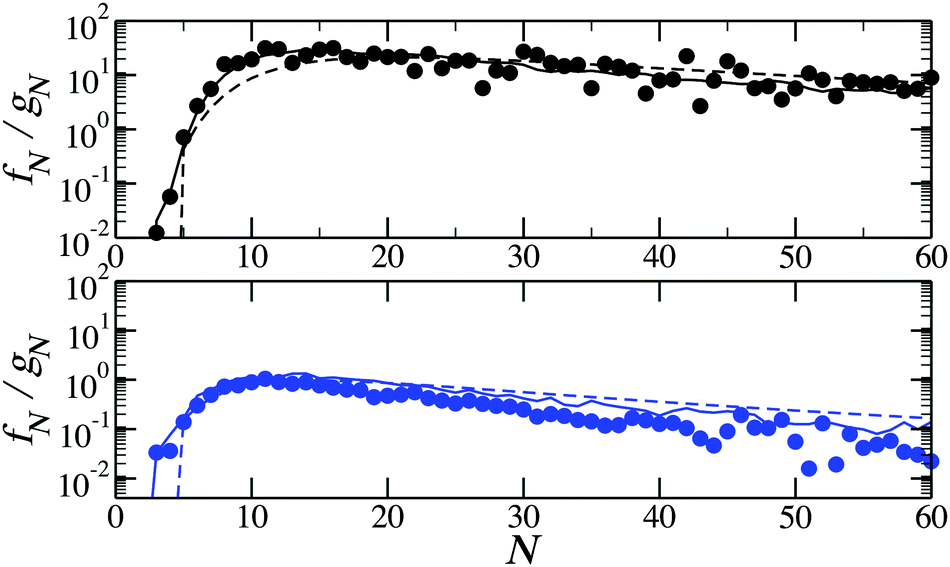 | ||
| Fig. 9 The ratio of ring to chain concentrations as functions of the cluster size for T = 0.125 (top, in black) and T = 0.155 (bottom, in blue). Solid lines are results of the density functional calculations with the cluster partition functions calculated with the method developed here; dashed lines are the predictions of the density functional theory with the cluster partition functions calculated analytically; symbols are obtained from canonical MC simulations for ρ = 0.007.51 | ||
4 Conclusions
In the present manuscript we reported the numerical evaluation of the partition function of clusters composed of bonded DHS, specifically focusing on chains and rings. The GC Monte Carlo single-cluster method allowed us to evaluate the cluster size distributions in DHS systems at previously-inaccessible low temperatures. We found that the probability of finding rings grows steadily with decreasing T, completely overwhelming the probability of finding chains. At such small reduced temperatures (T = 0.09), the energetic penalty of having an unpaired chain-end becomes so large that nearly all the chains preferentially close into ring structures.Interestingly, in the region where simulations done with the single-cluster (which are performed in the void and hence without periodic boundary conditions) and canonical MC (which take into account the long-range nature of the dipolar interactions through Ewald summations) methods can be compared, we observe a nearly-perfect agreement between the two. This reinforces the theoretical approaches that attempt to model the thermodynamic of DHS in term of topological transition73,74 of weakly interacting (through the formation of branching points) elementary clusters (e.g. chains and rings).
We have also evaluated the bulk behaviour of the DHS system under the assumption that branched structures can be neglected, such that the system can be modelled as an ideal gas of non-interacting chains and rings. The result of this evaluation has been compared with bulk simulations of DHS, confirming that at very low densities and temperatures, the system can indeed be modelled as an ideal gas of rings and chains. For larger densities, the effect of branching becomes relevant.
The availability of precise evaluations of the chain, ring and branched partition functions calls for a theoretical effort in the direction of accurately quantifying their N and T dependence. By leveraging the same approach, we plan to examine the GCMC data to extract the partition function of the various branched structures observed previously in systems of DHS.52,53 Developing such understanding will make it possible to map the (T-dependent) DHS interactions into simple models of associating fluids, which are in principle amenable of analytic solution in mean field. This hopefully will provide an accurate modelling of DHS in an extended T and ρ window.
Conflicts of interest
There are no conflicts to declare.Acknowledgements
This research has been partially supported by the Austrian Research Fund (FWF): START-Projekt Y 627-N27. S. S. K. is supported by DFG-RFBR DFG Ref. No. OD 18/24-1. S. S. K. and A. O. I. gratefully acknowledge research funding from the Ministry of Education and Science of the Russian Federation (Contract No. 02.A03.21.006, Project No. 3.1438.2017/4.6). J. M. T. acknowledges financial support from the Fundação para a Ciência e Tecnologia (Portugal) through contracts no. EXCL/FIS-NAN/0083/2012 and UID/FIS/00618/2013. Authors are grateful to the Ural Federal University stimulating programme. M. R., F. S. and S. S. K. acknowledge support from ETN-COLLDENSE (H2020-MSCA-ITN-2014, Grant No. 642774).References
- L. Resler Jr. and R. E. Rosensweig, AIAA J., 1964, 2, 1418–1422 CrossRef.
- S. Odenbach and S. Thurm, in Ferrofluids: Magnetically Controllable Fluids and Their Applications, ed. S. Odenbach, Springer, Berlin, Germany, 2002, vol. 594, pp. 185–201 Search PubMed.
- I. Anton, I. de Sabata and L. Vékás, J. Magn. Magn. Mater., 1990, 85, 219–226 CrossRef CAS.
- D. Huber, Small, 2005, 1, 482–501 CrossRef CAS PubMed.
- L. L. Vatta, R. D. Sanderson and K. R. Koch, Pure Appl. Chem., 2006, 78, 1793–1801 CrossRef CAS.
- J. Durán, J. Arias, V. Gallardo and A. Delgado, J. Pharm. Sci., 2008, 97, 2948–2983 CrossRef PubMed.
- Q. A. Pankhurst, N. T. K. Thanh, S. K. Jones and J. Dobson, J. Phys. D: Appl. Phys., 2009, 42, 224001 CrossRef.
- K. M. Krishnan, IEEE Trans. Magn., 2010, 46, 2523–2558 CrossRef CAS PubMed.
- M. M. van Oene, L. E. Dickinson, F. Pedaci, M. Köber, D. Dulin, J. Lipfert and N. H. Dekker, Phys. Rev. Lett., 2015, 114, 218301 CrossRef PubMed.
- R. Hergt, R. Hiergeist, I. Hilger, W. Kaiser, Y. Lapatnikov, S. Margel and U. Richter, J. Magn. Magn. Mater., 2004, 270, 345–357 CrossRef CAS.
- F. Sonvico, S. Mornet, S. Vasseur, C. Dubernet, D. Jaillard, J. Degrouard, J. Hoebeke, E. Duguet, P. Colombo and P. Couvreur, Bioconjugate Chem., 2005, 16, 1181–1188 CrossRef CAS PubMed.
- J.-P. Fortin, C. Wilhelm, J. Servais, C. Ménager, J.-C. Bacri and F. Gazeau, J. Am. Chem. Soc., 2007, 129, 2628–2635 CrossRef CAS PubMed.
- S. K. Smoukov, S. Gangwal, M. Marquez and O. D. Velev, Soft Matter, 2009, 5, 1285–1292 RSC.
- S.-H. Kim, J. Sim, J.-M. Lim and S.-M. Yang, Angew. Chem., Int. Ed., 2010, 49, 3786–3790 CrossRef CAS PubMed.
- P. Tierno, Phys. Chem. Chem. Phys., 2014, 16, 23515–23528 RSC.
- M. Yan, J. Fresnais and J.-F. Berret, Soft Matter, 2010, 6, 1997–2005 RSC.
- A. Günther, P. Bender, A. Tschöpe and R. Birringer, J. Phys.: Condens. Matter, 2011, 23, F5103 CrossRef PubMed.
- S. Sacanna, L. Rossi and D. J. Pine, J. Am. Chem. Soc., 2012, 134, 6112–6115 CrossRef CAS PubMed.
- S. Disch, E. Wetterskog, R. P. Hermann, D. Korolkov, P. Busch, P. Boesecke, O. Lyon, U. Vainio, G. Salazar-Alvarez, L. Bergstrom and T. Bruckel, Nanoscale, 2013, 5, 3969–3975 RSC.
- M. Agthe, E. Wetterskog, J. Mouzon, G. Salazar-Alvarez and L. Bergstrom, CrystEngComm, 2014, 16, 1443–1450 RSC.
- M. B. Bannwarth, S. Utech, S. Ebert, D. A. Weitz, D. Crespy and K. Landfester, ACS Nano, 2015, 0, 0 Search PubMed.
- L. Hu, R. Zhang and Q. Chen, Nanoscale, 2014, 6, 14064–14105 RSC.
- P. Mukherjee, P. Manchanda, P. Kumar, L. Zhou, M. J. Kramer, A. Kashyap, R. Skomski, D. Sellmyer and J. E. Shield, ACS Nano, 2014, 8, 8113–8120 CrossRef CAS PubMed.
- T.-J. Park, G. C. Papaefthymiou, A. J. Viescas, A. R. Moodenbaugh and S. S. Wong, Nano Lett., 2007, 7, 766–772 CrossRef CAS PubMed.
- R. Kötitz, W. Weitschies, L. Trahms, W. Brewer and W. Semmler, J. Magn. Magn. Mater., 1999, 194, 62–68 CrossRef.
- J. J. Weis and D. Levesque, Phys. Rev. Lett., 1993, 71, 2729–2732 CrossRef CAS PubMed.
- R. P. Sear, Phys. Rev. Lett., 1996, 76, 2310–2313 CrossRef CAS PubMed.
- R. van Roij, Phys. Rev. Lett., 1996, 76, 3348–3351 CrossRef CAS PubMed.
- Y. Levin, Phys. Rev. Lett., 1999, 83, 1159–1162 CrossRef CAS.
- P. J. Camp, J. C. Shelley and G. N. Patey, Phys. Rev. Lett., 2000, 84, 115–118 CrossRef CAS PubMed.
- P. J. Camp and G. N. Patey, Phys. Rev. E: Stat. Phys., Plasmas, Fluids, Relat. Interdiscip. Top., 2000, 62, 5403–5408 CrossRef CAS.
- L. Rovigatti, J. Russo and F. Sciortino, Phys. Rev. Lett., 2011, 107, 237801 CrossRef PubMed.
- L. Rovigatti, J. Russo and F. Sciortino, Soft Matter, 2012, 8, 6310–6319 RSC.
- P. J. Camp and G. N. Patey, Phys. Rev. E: Stat. Phys., Plasmas, Fluids, Relat. Interdiscip. Top., 2000, 62, 5403–5408 CrossRef CAS.
- R. Blaak, M. A. Miller and J.-P. Hansen, Europhys. Lett., 2007, 78, 26002 CrossRef.
- M. Klokkenburg, R. Dullens, W. Kegel, B. Erné and A. Philipse, Phys. Rev. Lett., 2006, 96, 037203 CrossRef PubMed.
- P. Y. Keng, I. Shim, B. D. Korth, J. F. Douglas and J. Pyun, ACS Nano, 2007, 1, 279–292 CrossRef CAS PubMed.
- K. Ng, J. P. Valleau, G. M. Torrie and G. N. Patey, Mol. Phys., 1979, 38, 781–788 CrossRef CAS.
- R. Jia, H. Braun and R. Hentschke, Phys. Rev. E: Stat., Nonlinear, Soft Matter Phys., 2010, 82, 062501 CrossRef PubMed.
- A.-P. Hynninen and M. Dijkstra, Phys. Rev. Lett., 2005, 94, 138303 CrossRef PubMed.
- G. Ganzenmüller, G. N. Patey and P. J. Camp, Mol. Phys., 2009, 107, 403–413 CrossRef.
- J. C. Shelley, G. N. Patey, D. Levesque and J. J. Weis, Phys. Rev. E: Stat. Phys., Plasmas, Fluids, Relat. Interdiscip. Top., 1999, 59, 3065–3070 CrossRef CAS.
- N. G. Almarza, E. Lomba, C. Martn and A. Gallardo, J. Chem. Phys., 2008, 129, 234504 CrossRef CAS PubMed.
- G. Ganzenmüller and P. J. Camp, J. Chem. Phys., 2007, 126, 191104 CrossRef PubMed.
- K. Van Workum and J. F. Douglas, Phys. Rev. E: Stat., Nonlinear, Soft Matter Phys., 2005, 71, 031502 CrossRef PubMed.
- J.-M. Caillol, J. Chem. Phys., 1993, 98, 9835–9849 CrossRef CAS.
- J. J. Weis, D. Levesque and G. J. Zarragoicoechea, Phys. Rev. Lett., 1992, 69, 913–916 CrossRef PubMed.
- L. Luo and S. H. L. Klapp, J. Chem. Phys., 2009, 131, 034709 CrossRef PubMed.
- R. Hentschke, J. Bartke and F. Pesth, Phys. Rev. E: Stat., Nonlinear, Soft Matter Phys., 2007, 75, 011506 CrossRef PubMed.
- P. G. de Gennes and P. A. Pincus, Phys. Kondens. Mater., 1970, 11, 189–198 CrossRef CAS.
- S. Kantorovich, A. O. Ivanov, L. Rovigatti, J. M. Tavares and F. Sciortino, Phys. Rev. Lett., 2013, 110, 148306 CrossRef PubMed.
- L. Rovigatti, S. Kantorovich, A. O. Ivanov, J. M. Tavares and F. Sciortino, J. Chem. Phys., 2013, 139, 134901 CrossRef PubMed.
- S. S. Kantorovich, A. O. Ivanov, L. Rovigatti, J. M. Tavares and F. Sciortino, Phys. Chem. Chem. Phys., 2015, 17, 16601–16608 RSC.
- A. Tari, J. Popplewell and S. Charles, J. Magn. Magn. Mater., 1980, 15-18, 1125–1126 CrossRef CAS.
- A. Lebedev and S. Lysenko, J. Magn. Magn. Mater., 2011, 323, 1198–1202 CrossRef CAS.
- R. Pool and P. G. Bolhuis, J. Phys. Chem. B, 2005, 109, 6650–6657 CrossRef CAS PubMed.
- D. J. Kraft, R. Ni, F. Smallenburg, M. Hermes, K. Yoon, D. A. Weitz, A. van Blaaderen, J. Groenewold, M. Dijkstra and W. K. Kegel, Proc. Natl. Acad. Sci. U. S. A., 2012, 109, 10787–10792 CrossRef CAS PubMed.
- T. Vissers, Z. Preisler, F. Smallenburg, M. Dijkstra and F. Sciortino, J. Chem. Phys., 2013, 138, 164505 CrossRef PubMed.
- K. Morozov and M. Shliomis, Ferrofluids: Magnetically Controllable Fluids and Their Applications, in Lecture Notes in Physics, ed. S. Odenbach, 2002, vol. 594, pp. 162–184 Search PubMed.
- Z. Wang and C. Holm, Phys. Rev. E: Stat., Nonlinear, Soft Matter Phys., 2003, 68, 041401 CrossRef PubMed.
- E. Pyanzina, S. Kantorovich, J. Cerdà, A. Ivanov and C. Holm, Mol. Phys., 2009, 107, 571–590 CrossRef CAS.
- M. Lal, Mol. Phys., 1969, 17, 57–64 CrossRef CAS.
- B. MacDonald, N. Jan, D. L. Hunter and M. O. Steinitz, J. Phys. A: Math. Gen., 1985, 18, 2627 CrossRef CAS.
- N. Madras and A. D. Sokal, J. Stat. Phys., 1988, 50, 109–186 CrossRef.
- P. Virnau and M. Müller, J. Chem. Phys., 2004, 120, 10925–10930 CrossRef CAS PubMed.
- T. L. Hill, An Introduction to Statistical Thermodynamics, Dover Pubns, 1987 Search PubMed.
- F. Sciortino, Basic concepts in self-assembly, Proc. of the Int. School of Physics 'Enrico Fermi', Varenna, 2015.
- V. S. Mendelev and A. O. Ivanov, Phys. Rev. E: Stat., Nonlinear, Soft Matter Phys., 2004, 70, 051502 CrossRef PubMed.
- P. C. Jordan, Mol. Phys., 1973, 25, 961–973 CrossRef CAS.
- P. C. Jordan, Mol. Phys., 1979, 38, 769–780 CrossRef CAS.
- T. Prokopieva, V. Danilov, S. Kantorovich and C. Holm, Phys. Rev. E: Stat., Nonlinear, Soft Matter Phys., 2009, 80, 031404 CrossRef PubMed.
- D. Frenkel and B. Smit, Understanding molecular simulation: from algorithms to applications, Academic Press, 2nd edn, 2002 Search PubMed.
- T. Tlusty and S. A. Safran, Science, 2000, 290, 1328 CrossRef CAS PubMed.
- J. Tavares and P. Teixeira, Mol. Phys., 2011, 109, 1077–1085 CrossRef CAS.
| This journal is © The Royal Society of Chemistry 2017 |