 Open Access Article
Creative Commons Attribution 3.0 Unported Licence
Gramicidin ion channels in a lipid bilayer supported on polyelectrolyte multilayer films: an electrochemical impedance study†
Eleftheria
Diamanti‡
 a,
Eduart
Gutiérrez-Pineda‡
 bc,
Nikolaos
Politakos
a,
Patrizia
Andreozzi
a,
María José
Rodriguez-Presa
b,
Wolfgang
Knoll
d,
Omar
Azzaroni
 b,
Claudio A.
Gervasi
*bc and
Sergio E.
Moya
 *a
*a
aSoft Matter Nanotechnology Group, CIC biomaGUNE, Paseo Miramón 182 C, 20009 San Sebastián, Guipúzcoa, Spain. E-mail: smoya@cicbiomagune.es
bInstituto de Investigaciones, Fisicoquímicas Teóricas y Aplicadas (INIFTA), Departamento de Química, Facultad de Ciencias Exactas, Universidad Nacional de la Plata, CONICET, Sucursal 4-C.C.16, 1900 La Plata, Argentina. E-mail: gervasi@inifta.unlp.edu.ar
cArea Electroquímica, Facultad de Ingeniería, Universidad Nacional de La Plata, calle 1 y 47, 1900 La Plata, Argentina
dAIT Austrian Institute of Technology, Vienna, and CEST Competence Center for Electrochemical Surface Technology, Wiener Neustadt, Austria
First published on 6th November 2017
Abstract
Supported membranes on polymer cushions are of fundamental interest as models for cell membranes. The use of polyelectrolyte multilayers (PEMs) assembled by the layer by layer (LbL) technique as supports for a bilayer allows for easy integration of the lipid bilayer on surfaces and devices and for nanoscale tunable spacing of the lipid bilayer. Controlling ionic permeability in lipid bilayers supported on PEMs triggers potential applications in sensing and as models for transport phenomena in cell membranes. Lipid bilayers displaying gramicidin channels are fabricated on top of polyallylamine hydrochloride (PAH) and polystyrene sulfonate (PSS) multilayer films, by the assembly of vesicles of phosphatidylcholine and phosphatidylserine, 50![[thin space (1/6-em)]](https://www.rsc.org/images/entities/char_2009.gif) :
:![[thin space (1/6-em)]](https://www.rsc.org/images/entities/char_2009.gif) 50 M/M, carrying gramicidin (GA). Quartz crystal microbalance with dissipation shows that the vesicles with GA fuse into a bilayer. Atomic force microscopy reveals that the presence of GA alters the bilayer topography resulting in depressions in the bilayer of around 70 nm in diameter. Electrochemical impedance spectroscopy (EIS) studies show that supported bilayers carrying GA have smaller resistances than the bilayers without GA. Lipid layers carrying GA display a higher conductance for K+ than for Na+ and are blocked in the presence of Ca2+.
50 M/M, carrying gramicidin (GA). Quartz crystal microbalance with dissipation shows that the vesicles with GA fuse into a bilayer. Atomic force microscopy reveals that the presence of GA alters the bilayer topography resulting in depressions in the bilayer of around 70 nm in diameter. Electrochemical impedance spectroscopy (EIS) studies show that supported bilayers carrying GA have smaller resistances than the bilayers without GA. Lipid layers carrying GA display a higher conductance for K+ than for Na+ and are blocked in the presence of Ca2+.
Introduction
Artificial lipid bilayers supported on solid substrates (SLBs),1–4i.e., TiO2, SiO2, and Au, have been proposed as models for cell membranes for biophysical studies1,5,6 and as part of sensor devices. Lipid bilayers are used to provide biocompatibility to interfaces or as a mean to integrate proteins, peptides, channels etc. in sensors, benefiting from the biologically resembling environment of the lipid bilayer, where these can be assembled and their functionalities are improved. In addition, several bioanalytical and medical applications in drug screening and diagnostics have been proposed for supported lipid bilayers carrying proteins and channels.7,8SLBs with inbuilt channels are of interest for selective ion transport as channels in cell membranes to control the traffic of specific ions and block others. This selectivity can be used for the design of ion sensors. SLBs with channels can also be used as models for transport studies in membranes, especially for electrochemical studies, as they allow the use of techniques such as cyclic voltammetry or impedance spectroscopy for ion transport characterization.
Gramicidin is one of the most extensively studied channel former peptides.9–11 It is a linear peptide (pentadecaptide), which assembles into a helical transmembrane dimer structure12 producing a continuous channel through a lipid bilayer. This peptide in its dimer form has a length of 26 Å, which is sufficient for the dimer to span a lipid bilayer (40 Å) and form pores of 4 Å in diameter.13,14 Through the gramicidin pores, monovalent cations are transported. Gramicidin in its active form permits cation selective transport, while divalent cations like Ca2+ block the channel.9 Ion selectivity for gramicidin follows the following order:9 H+ > NH4+ > Cs+ > Rb+ >K+ > Na+ > Li+. Supported membranes with inbuilt polypeptide gramicidin pores11 have already provided significant information about several important biological processes.
Layer by layer (LbL) films represent an interesting case as supports for lipid layers. The LbL technique is based on the alternating deposition of oppositely charged polyelectrolytes (PEs) that lead to the assembly of a multilayer polyelectrolyte film with nanometre precision.15,16 Membranes supported on polymeric surfaces are of fundamental interest, as biological membranes are themselves supported on top of a cushion of biopolymers, the glycocalix or the cell wall.8 The LbL assembly provides in addition a simple means of fabricating thin films on charged surfaces. Lipid layers on polyelectrolyte multilayers (PEMs) could be assembled on almost any surface and the distance between the interface and the lipids could be controlled in the nanometre range by the number of assembled polyelectrolyte layers. Cassier et al.17 have shown that it is possible to support lipid layers on top of PEMs fabricated by the LbL technique. Despite the fact that lipid layers assembled on polyelectrolyte capsules decrease the ionic conductivity for capsule walls,18–20 early examples in the literature of lipid layers on PEMs, mainly by Kügler and Knoll21 and Cassier et al.17 show lipid layers with defects and high conductivity. The electrical characteristics of the lipid layers on PEMs were far from those of the black lipid membranes. A possible reason for the high conductivity observed for lipid layers on PEMs may be that the lipid composition for the vesicles used in the studies by the groups of Möhwald and Knoll do not lead to bilayer formation but to the assembly of not-fully fused vesicles, as was shown later.22 Because of the high conductivity of the lipid layers, no attempts to integrate channels in lipid bilayers assembled on PEMs have been reported. The high conductivity or ionic permeability of the lipids would not allow tuning or selectively blocking of the ion permeability by the incorporation of channels.
Recently, Fischlechner et al.22 and Diamanti et al.23 showed that it is possible to form complete lipid bilayers on top of PEMs by the adsorption of vesicles of mixed zwitterionic (dioleoylphosphatidylcholine, DOPC) and anionic (dioleoylphosphatidylserine, DOPS) phospholipids. Bilayer formation takes place if the molar percentage of DOPS lies between 50 and 70%. Electrochemical impedance spectroscopy (EIS) studies performed by Diamanti et al.24 showed that the lipid bilayer assembled on PAH/PSS displayed high resistance values: 1.89 × 10⁷ Ω cm2. This resistance is comparable with the resistance of a black lipid membrane and thus allows the introduction of channels or trans-membrane proteins for selective transport.
In this work, we aim to provide a proof of concept for the integration of channels in lipid bilayers supported on PEMs as a means of controlling ionic permeability. We explored the incorporation of gramicidin to form channels in a DOPC![[thin space (1/6-em)]](https://www.rsc.org/images/entities/char_2009.gif) :
:![[thin space (1/6-em)]](https://www.rsc.org/images/entities/char_2009.gif) DOPS (50
DOPS (50![[thin space (1/6-em)]](https://www.rsc.org/images/entities/char_2009.gif) :
:![[thin space (1/6-em)]](https://www.rsc.org/images/entities/char_2009.gif) 50) bilayer assembled on top of PAH/PSS PEMs. Since the bilayer formed with these lipids displays high resistance, the incorporation of the ionophores will allow tuning of the conductivity for specific ions. Gramicidin has been chosen because of its simplicity and because it is possible to incorporate it in the lipid vesicles before their assembly on the PEMs. Bilayer formation has been proven by means of the quartz crystal microbalance with dissipation (QCM-D). Atomic force microscopy (AFM) was applied to visualize the bilayer topography when the gramicidin had been incorporated in the vesicles. Electrical impedance spectroscopy (EIS) was performed to study channel selectivity for K+ and Na+ and the limited Ca2+ permeability.
50) bilayer assembled on top of PAH/PSS PEMs. Since the bilayer formed with these lipids displays high resistance, the incorporation of the ionophores will allow tuning of the conductivity for specific ions. Gramicidin has been chosen because of its simplicity and because it is possible to incorporate it in the lipid vesicles before their assembly on the PEMs. Bilayer formation has been proven by means of the quartz crystal microbalance with dissipation (QCM-D). Atomic force microscopy (AFM) was applied to visualize the bilayer topography when the gramicidin had been incorporated in the vesicles. Electrical impedance spectroscopy (EIS) was performed to study channel selectivity for K+ and Na+ and the limited Ca2+ permeability.
Results and discussion
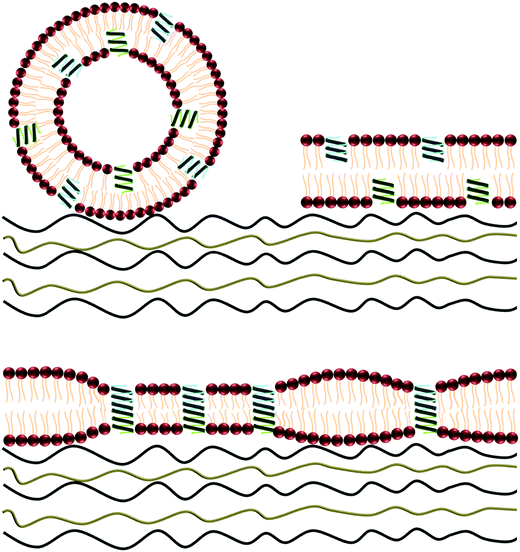
Vesicles were prepared including GA in their formulation. For the incorporation of GA in the lipid bilayer, vesicles were reconstituted in the presence of GA as described in the experimental section. Our approach is depicted in Fig. 1. The lipid composition of the vesicles was chosen to be 50![[thin space (1/6-em)]](https://www.rsc.org/images/entities/char_2009.gif) :
:![[thin space (1/6-em)]](https://www.rsc.org/images/entities/char_2009.gif) 50 DOPC
50 DOPC![[thin space (1/6-em)]](https://www.rsc.org/images/entities/char_2009.gif) :
:![[thin space (1/6-em)]](https://www.rsc.org/images/entities/char_2009.gif) DOPS and their composition was verified by 1H NMR measurements (Fig. S1, ESI†).
DOPS and their composition was verified by 1H NMR measurements (Fig. S1, ESI†).
The size and surface potential of the vesicles carrying GA were first characterized. Size distributions from intensity distributions, as measured by DLS revealed diameters of 91.6 ± 0.2 nm (PDI = 0.061 ± 0.04) for vesicles with a 50![[thin space (1/6-em)]](https://www.rsc.org/images/entities/char_2009.gif) :
:![[thin space (1/6-em)]](https://www.rsc.org/images/entities/char_2009.gif) 50 DOPC
50 DOPC![[thin space (1/6-em)]](https://www.rsc.org/images/entities/char_2009.gif) :
:![[thin space (1/6-em)]](https://www.rsc.org/images/entities/char_2009.gif) DOPS composition and 0.1 mM of gramicidin while the diameter of the SUVs without GA was 120 ± 0.1 nm (PDI = 0.032 ± 0.02). ζ-Potential measurements of the unilamellar vesicles resulted in negative potential values; −19.9 ± 1.9 mV. Vesicles without GA displayed more negative potential values, −28.7 ± 1.2 mV, probably due to the higher density of negatively charged DOPS head groups before gramicidin incorporation.
DOPS composition and 0.1 mM of gramicidin while the diameter of the SUVs without GA was 120 ± 0.1 nm (PDI = 0.032 ± 0.02). ζ-Potential measurements of the unilamellar vesicles resulted in negative potential values; −19.9 ± 1.9 mV. Vesicles without GA displayed more negative potential values, −28.7 ± 1.2 mV, probably due to the higher density of negatively charged DOPS head groups before gramicidin incorporation.
Lipid bilayer formation from vesicles carrying GA
QCM-D measurements revealed that the lipid bilayer was successfully formed from the vesicles with a 50![[thin space (1/6-em)]](https://www.rsc.org/images/entities/char_2009.gif) :
:![[thin space (1/6-em)]](https://www.rsc.org/images/entities/char_2009.gif) 50 molar ratio of DOPC
50 molar ratio of DOPC![[thin space (1/6-em)]](https://www.rsc.org/images/entities/char_2009.gif) :
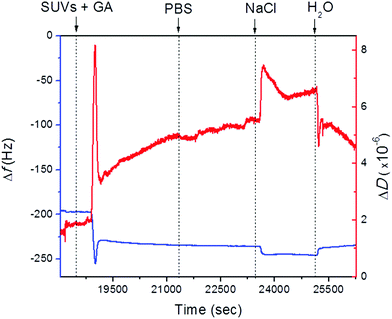
:![[thin space (1/6-em)]](https://www.rsc.org/images/entities/char_2009.gif) DOPS carrying 0.1 mM of gramicidin. After vesicle addition to the PEMs, the frequency displayed a characteristic jump, which is typical of a bilayer formation.25 Following a rapid decrease in frequency after vesicle addition there was an increase in frequency upon rupture of the vesicles liberating the enclosed solution (Fig. 2). Stable values for the frequency were obtained after rinsing. Upon addition of PBS, no changes in frequency were observed. The vesicle assembly resulted in a total frequency shift of Δf = 37 Hz, which is compatible with bilayer formation as reported before. Dissipation followed a similar trend. It increased after the vesicles came into contact with the surface and decreased after the vesicles were ruptured and fused. However, the values of ΔD obtained were almost 3 times higher than the ones reported in our previous studies for the 50
DOPS carrying 0.1 mM of gramicidin. After vesicle addition to the PEMs, the frequency displayed a characteristic jump, which is typical of a bilayer formation.25 Following a rapid decrease in frequency after vesicle addition there was an increase in frequency upon rupture of the vesicles liberating the enclosed solution (Fig. 2). Stable values for the frequency were obtained after rinsing. Upon addition of PBS, no changes in frequency were observed. The vesicle assembly resulted in a total frequency shift of Δf = 37 Hz, which is compatible with bilayer formation as reported before. Dissipation followed a similar trend. It increased after the vesicles came into contact with the surface and decreased after the vesicles were ruptured and fused. However, the values of ΔD obtained were almost 3 times higher than the ones reported in our previous studies for the 50![[thin space (1/6-em)]](https://www.rsc.org/images/entities/char_2009.gif) :
:![[thin space (1/6-em)]](https://www.rsc.org/images/entities/char_2009.gif) 50 DOPC
50 DOPC![[thin space (1/6-em)]](https://www.rsc.org/images/entities/char_2009.gif) :
:![[thin space (1/6-em)]](https://www.rsc.org/images/entities/char_2009.gif) DOPS assembled vesicles.23,26 In addition, when the vesicles were adsorbed on the PEM surface, dissipation increased drastically (ΔD = 8 × 10⁻⁶ dissipation units), indicating that the vesicles carrying GA have a more dissipative character, probably because the vesicles are more fluid as a consequence of the presence of GA or the presence of pores with water permeability. Upon rupture of the vesicles, the dissipation decreased to 3 × 10⁻⁶ dissipation units to increase afterwards progressively to 5 × 10⁻⁶ dissipation units. The changes in dissipation may hint at reorganization of GA in the lipid layers. Dissipation values were higher for the lipid bilayer with GA compared with the one without GA; however, the frequency changes following vesicle assembly were almost the same in both cases. This suggests that despite the bilayer being formed, the presence of gramicidin has an impact on its structure. Dissipation is higher probably because of the formation of pores by the presence GA, but these do not represent a major difference in the mass deposited on the PEMs.
DOPS assembled vesicles.23,26 In addition, when the vesicles were adsorbed on the PEM surface, dissipation increased drastically (ΔD = 8 × 10⁻⁶ dissipation units), indicating that the vesicles carrying GA have a more dissipative character, probably because the vesicles are more fluid as a consequence of the presence of GA or the presence of pores with water permeability. Upon rupture of the vesicles, the dissipation decreased to 3 × 10⁻⁶ dissipation units to increase afterwards progressively to 5 × 10⁻⁶ dissipation units. The changes in dissipation may hint at reorganization of GA in the lipid layers. Dissipation values were higher for the lipid bilayer with GA compared with the one without GA; however, the frequency changes following vesicle assembly were almost the same in both cases. This suggests that despite the bilayer being formed, the presence of gramicidin has an impact on its structure. Dissipation is higher probably because of the formation of pores by the presence GA, but these do not represent a major difference in the mass deposited on the PEMs.
AFM measurements were conducted to visualize the changes in morphology in the lipid bilayer due to the presence of GA. As shown in our previous work,23 a lipid bilayer formed from DOPC![[thin space (1/6-em)]](https://www.rsc.org/images/entities/char_2009.gif) :
:![[thin space (1/6-em)]](https://www.rsc.org/images/entities/char_2009.gif) DOPS (50
DOPS (50![[thin space (1/6-em)]](https://www.rsc.org/images/entities/char_2009.gif) :
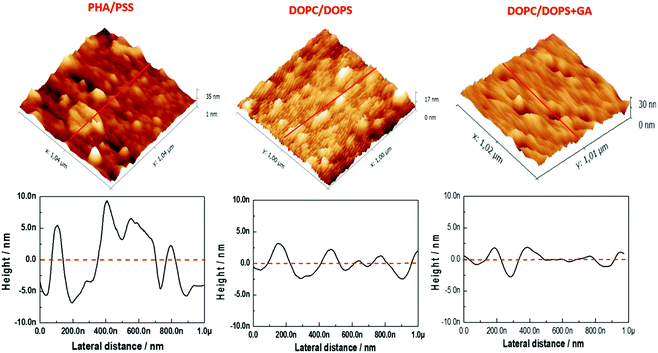
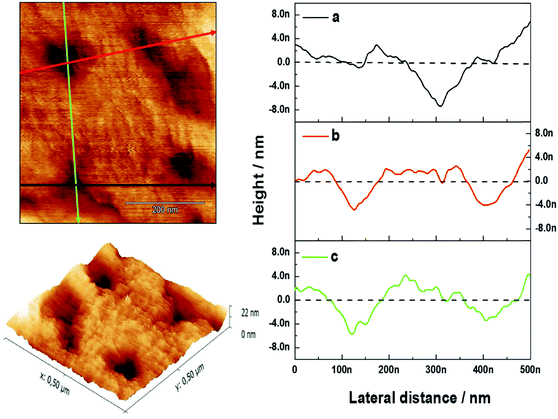
:![[thin space (1/6-em)]](https://www.rsc.org/images/entities/char_2009.gif) 50) vesicles assembled on top of the PAH/PSS PEM displayed a flatter surface compared with the PAH/PSS PEM (Fig. 3). The grainy topography of the PEM is partially transferred to the lipid bilayer on top, as the lipid bilayer follows the features of the PEM. However, the continuity of the bilayer results in a flatter structure with less pronounced depths. The inner diameter of the channel pore of gramicidin as shown in the literature is of the order of ∼4 Å.13 Nevertheless this size could vary, depending on the environment, thus inner diameters of 12 Å have also been reported.27 In addition, the pore channel filled with aqueous solution may vary from 3.4 up to 6.3 Å.27 The outer diameter of the channel is about 30–35 Å.27 As the maximum resolution of the AFM tip is 10 nm, the visualization of the pore by AFM is not possible. However, when 0.1 mM of GA was incorporated into the lipid bilayer, a significant change in the surface morphology was observed, as shown in Fig. 3 (DOPC:DOPS + GA). Domain structures appeared on the surface of the bilayer. These domains are small but uniform depressions of 72.39 ± 12.9 nm in diameter. This can be observed more clearly in the section profile shown in Fig. 4. The diameter (w) of the depressions was measured using a simple geometrical deconvolution because the widths of the depressions were increased in the AFM images due to tip-sample convolution.28
50) vesicles assembled on top of the PAH/PSS PEM displayed a flatter surface compared with the PAH/PSS PEM (Fig. 3). The grainy topography of the PEM is partially transferred to the lipid bilayer on top, as the lipid bilayer follows the features of the PEM. However, the continuity of the bilayer results in a flatter structure with less pronounced depths. The inner diameter of the channel pore of gramicidin as shown in the literature is of the order of ∼4 Å.13 Nevertheless this size could vary, depending on the environment, thus inner diameters of 12 Å have also been reported.27 In addition, the pore channel filled with aqueous solution may vary from 3.4 up to 6.3 Å.27 The outer diameter of the channel is about 30–35 Å.27 As the maximum resolution of the AFM tip is 10 nm, the visualization of the pore by AFM is not possible. However, when 0.1 mM of GA was incorporated into the lipid bilayer, a significant change in the surface morphology was observed, as shown in Fig. 3 (DOPC:DOPS + GA). Domain structures appeared on the surface of the bilayer. These domains are small but uniform depressions of 72.39 ± 12.9 nm in diameter. This can be observed more clearly in the section profile shown in Fig. 4. The diameter (w) of the depressions was measured using a simple geometrical deconvolution because the widths of the depressions were increased in the AFM images due to tip-sample convolution.28
| w0 − w = 2(2Rh + h2)1/2 |
EIS studies
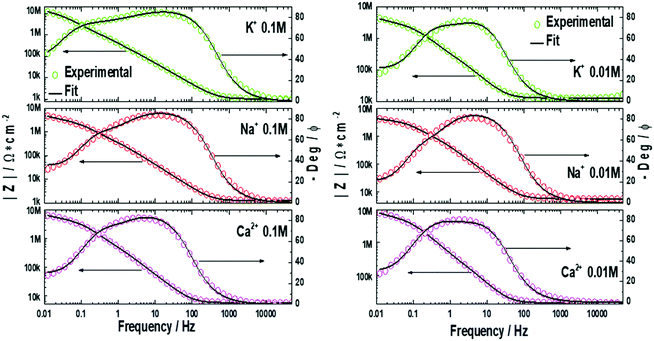
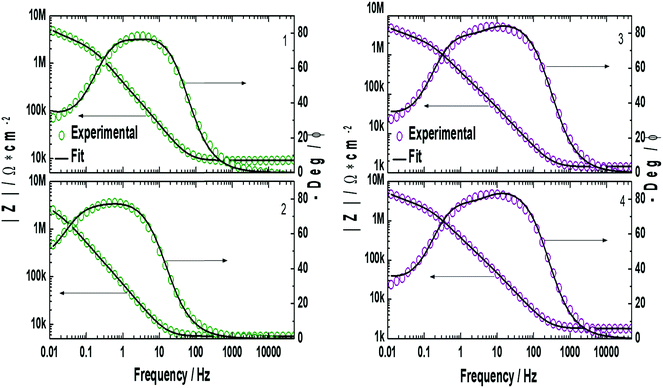
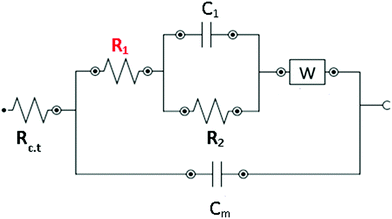
EIS measurements were performed on the lipid bilayer on PEMs carrying GA in the presence of NaCl, KCl and CaCl2 at different ion concentrations. Experiments were performed as described in the experimental section. Fig. 5 and 6 show the experimental and fitted impedance data for the different ions considered in Bode diagrams. In Fig. 5, EIS experiments are shown for solutions of a single cation: K+, Na+ or Ca2+ at two different concentrations: 0.01 M and 0.1 M, respectively. In Fig. 5, EIS data correspond to mixtures of a monovalent ion, K+ or Na+, 0.005 M and 0.01 M, and Ca2+, 0.01 M. From the figures, it can be concluded that there is very good agreement between the experimental data and fitting. Fits are based on the model developed by Gervasi et al.30 In this model, M+ species arrive at the membrane/electrolyte interface by aqueous diffusion, adsorb at the end of an active channel and incorporate inside according to the electrochemical step (1). In the simplest case, the interfacial transfer kinetics is a first-order reaction. Thereafter, the cation permeates the bilayer through the channel as indicated by electrochemical step (2), characterized by a simple activation energy barrier and irreversible kinetics. The reaction mechanism can be formally written as: | (1) |
 | (2) |
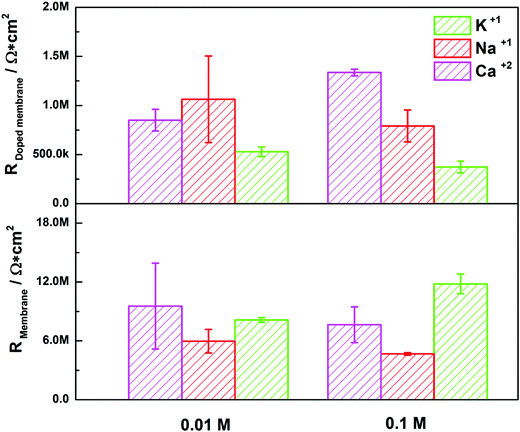
 , for different cations were estimated using Complex Nonlinear Least Squares fits (CNLS) of the experimental data at different concentrations, where I is the ionic current, E is the potential, θ is the degree of coverage and c the ionic concentration. Transport resistances are shown in Fig. 8 for K+, Na+ and Ca2+ at two concentrations: 0.01 and 0.1 M. For comparison, the values for the resistance of the lipid bilayer without GA are also provided in the figure for the same ions and ion concentrations. From the EIS data for the bilayer with GA, it can be concluded that the lower resistance and therefore highest conductance is observed for K+ ions, as was expected since GA channels show a higher affinity for these ions. The resistance decreases with increasing ion concentration from 528.5 kΩ cm2 to 372.7 kΩ cm2 when passing from 0.01 M to 0.1 M. Na+ resistance is higher than for K+ at the two concentrations considered, i.e. the conductance is lower than for K+. At 0.01 M, there is very large variability among the data with an average resistance value of 1.065 MΩ cm2, but the resistance decreases to 791.5 kΩ cm2 at 0.1 M Na+, respectively. A clear tendency for the resistance to decrease with increasing ion concentration is observed for both ions. This means that ion conductivity is higher when the ion concentration is increased. The resistance for the bilayer without GA was always higher for both ions, by approximately 5 times. Opposite to what is observed for the GA, the resistance for K+ is slightly higher than for Na+, meaning that for the Na+ ion conductivity is higher. However, this result is unexpected as it is known that the conductivity for Na+ ions in lipid membranes is usually lower than for K+.31 Na+ ions are larger than K+ ones because of the large hydration shell of Na+. The larger Na+ ions find it more difficult to pass through defects in the membranes than the K+ ions. In the case of the supported membranes on polyelectrolytes, we can assume that the interaction of the lipids with the polyelectrolyte results in restricted mobility for the lipids directly in contact with the polyelectrolytes and that this favors the presence of defects in the supported membranes, large enough not to restrict the flux of Na+, resulting in higher conductivity for this ion in the membranes without GA. The higher K+ conductivity of the membranes with GA is indeed indicative of channel-mediated conductivity.
In the case of Ca2+, a different behavior can be observed for the membrane with GA. As the Ca2+ concentration is increased from 0.01 M to 0.1 M the resistance increases as well, from 850 kΩ cm2 to 1.336 MΩ cm2 (conductance decreases). This indicates that a large fraction of the pores is blocked when the Ca2+ concentration is higher, which is also the expected behavior for GA pores. For the membrane without GA resistance, values are also 5 times higher than with GA and resistance decreases when the Ca2+ is increased. The difference in the behavior for the membrane with and without GA hints again at a pore effect. The increase in resistance increasing the concentration of Ca2+ proves that ion conductivity takes place through GA channels and not through defects in the lipid layers. If this was the case, one would observe a decrease in the resistance as the concentration of Ca2+ is increased as for the membrane. The higher conductance for K+ than for Na+ is also indicative of the transport through the channel, as affinity for K+ is higher than for Na+ in gramicidin.
Experimental
Materials and methods
Poly(allylamine hydrochloride) (PAH, Mw 15 kDa), poly-(styrenesulfonate sodium salt) (PSS, Mw 70 kDa), sodium 3-mercapto-1-propanesulfonate (MPS, Mw 178.21 g mol−1), gramicidin (A, B and C mixture) from Bacillus aneurinolyticus (Bacillus brevis), phosphate-buffered saline (PBS), potassium chloride (KCl), sodium chloride (NaCl), calcium chloride (CaCl2) and chloroform (anhydrous, >99%) were purchased from Sigma-Aldrich. The phospholipids 1,2-dioleoyl-sn-glycero-3-phosphocholine (DOPC, 10 mg mL−1 in chloroform) and 1,2-dioleoyl-sn-glycero-3-phospho-L-serine (DOPS, sodium salt, 10 mg mL−1 in chloroform) were obtained from Avanti Polar Lipids, Inc. Ethanol (99.9% HPLC) was obtained from Scharlau S.A.SUVs preparation and characterization
Vesicles were formed by mixing DOPC, DOPS, and gramicidin as follows: lipid stock solutions in chloroform, 10 mg mL−1, were mixed together at a 50![[thin space (1/6-em)]](https://www.rsc.org/images/entities/char_2009.gif) :
:![[thin space (1/6-em)]](https://www.rsc.org/images/entities/char_2009.gif) 50 (DOPC
50 (DOPC![[thin space (1/6-em)]](https://www.rsc.org/images/entities/char_2009.gif) :
:![[thin space (1/6-em)]](https://www.rsc.org/images/entities/char_2009.gif) DOPS) molar ratio. The chloroform was evaporated with an argon stream and followed by at least 1 h incubation under vacuum to remove any trace of chloroform. The lipid film was rehydrated with PBS (10 mM, pH 7.4), together with gramicidin to a final concentration of 0.1 mM. The resulting multilamellar vesicles (MLVs) were extruded through a 50 nm polycarbonate membrane forming small unilamellar vesicles (SUVs). The size and charge of the vesicles were characterized by dynamic light scattering (DLS) and ζ-potential, respectively. 1H NMR measurements were conducted to reveal the exact composition of both DOPC and DOPS in the lipid mixture. The chloroform from the lipid mixture was first evaporated and then dissolved again in CDCl3 at a concentration of 0.75 mg mL−1.
DOPS) molar ratio. The chloroform was evaporated with an argon stream and followed by at least 1 h incubation under vacuum to remove any trace of chloroform. The lipid film was rehydrated with PBS (10 mM, pH 7.4), together with gramicidin to a final concentration of 0.1 mM. The resulting multilamellar vesicles (MLVs) were extruded through a 50 nm polycarbonate membrane forming small unilamellar vesicles (SUVs). The size and charge of the vesicles were characterized by dynamic light scattering (DLS) and ζ-potential, respectively. 1H NMR measurements were conducted to reveal the exact composition of both DOPC and DOPS in the lipid mixture. The chloroform from the lipid mixture was first evaporated and then dissolved again in CDCl3 at a concentration of 0.75 mg mL−1.
QCM-D measurements
The formation of the bilayer from SUVs carrying GA on 11 layers of PAH and PSS was followed by means of the QCM-D technique (Q-Sense E4). For the PEM assembly, polyelectrolyte solutions were flown for 10 min through the chamber until a stable frequency value was achieved. Each deposition was followed by 10 min of rinsing with 0.5 M NaCl. The last deposited layer was the positively charged PAH. The PEM was formed on 11 layers. Afterwards, the chamber was filled with PBS (10 mM, pH 7.4) and the dispersion of SUVs carrying 0.1 mM gramicidin in PBS (0.1 mg mL−1) was flown. When the frequency reached a stable value, the quartz sensor was rinsed with PBS to remove non-adsorbed vesicles. Finally, the membrane was rinsed with Milli-Q water.AFM measurements
AFM measurements were performed in liquid state using a Multimode AFM with a Nanoscope V controller (Bruker AXS, Santa Barbara, CA) equipped with a J-scanner. Oxide-sharpened silicon nitride cantilevers (T: 600 nm) with a nominal spring constant of 0.06 N m−1 (Bruker, model: DNP-10) and f0: 12–24 kHz were used. QCM-D sensors with (PAH/PSS)5.5 and the assembled lipid bilayer with gramicidin were attached to Teflon-coated metal disks using double-sided tape and placed on the AFM scanner. Images were acquired with minimal force. Tapping mode images were analysed using the Gwyddion software (gwyddion.net).EIS measurements
A general-purpose three-electrode electrochemical cell was used to perform the impedance characterization of the lipid membrane displaying gramicidin supported on PEMs. A gold surface was used as the substrate of the working electrode 0.2 cm2. The multilayer cushion and the lipid bilayer carrying GA were deposited on top of the gold surface, which had been previously modified with a self-assembled monolayer of MPS, formed from a 0.01 M ethanolic solution of the thiol. For the assembly of the thiol monolayer, the gold surface was left in MPS solution overnight, resulting in a negatively charged surface. A platinum (Pt) plate served as the counter electrode. Potentials were measured with respect to a silver/silver chloride reference electrode (Ag/AgCl/saturated KCl with a potential of 0.199 V vs. the standard hydrogen electrode). Measurements were conducted in 0.1 M and 0.01 M KCl, NaCl and CaCl2 electrolyte solutions, respectively. Measurements were made with an Autolab PGSTAT302 (Metrohm).Conclusions
We have shown that DOPC:DOPS vesicles carrying GA can be assembled on PAH/PSS multilayers resulting in a lipid bilayer. QCM-D data prove the formation of a bilayer with built-in GA. AFM shows that the topology of the bilayer is altered by the presence of GA inducing height depressions in the surface of the bilayer. EIS shows a higher conductance for K+ than Na+ for the same ionic concentration, which is opposite to the behaviour of the membranes without GA for the same ions. For both monovalent ions, the conductance increases with ionic strength. A lower conductance was measured for Ca2+, which decreases with increasing ion concentration, again oppositely to the behaviour of a lipid bilayer without GA. The higher affinity for K+ than Na+ and the blocking effect of Ca2+ are in accordance with the expected behaviour of the GA channels.To summarize, in this work we show that a bilayer with incorporated gramicidin channels can be assembled on top of a polyelectrolyte multilayer film, and GA channels display selective ionic transport. More complex architectures, involving membrane proteins can be envisaged. Our results lead the way for potential applications of lipid bilayers on PEMs for ion sensors or selective transport.
Conflicts of interest
There are no conflicts to declare.Acknowledgements
The authors thank the H2020 project RISE HYMADE (645686) for financial support. CAG is a researcher at CICBA.Notes and references
- R. P. Richter, J. L. K. Him and A. Brisson, Mater. Today, 2003, 6, 32–37 CrossRef CAS
.
- F. F. Rossetti, M. Bally, R. Michel, M. Textor and I. Reviakine, Langmuir, 2005, 21, 6443–6450 CrossRef CAS PubMed
.
- E. Reimhult, B. Kasemo and F. Höök, Int. J. Mol. Sci., 2009, 10, 1683–1696 CrossRef CAS PubMed
.
- I. Köper, Mol. Biosyst., 2007, 3, 651 RSC
.
- A. Kloboucek, A. Behrisch, J. Faix and E. Sackmann, Biophys. J., 1999, 77, 2311–2328 CrossRef CAS PubMed
.
- L. a Lautscham, C. Y. Lin, V. Auernheimer, C. a Naumann, W. H. Goldmann and B. Fabry, Biomaterials, 2014, 35, 3198–3207 CrossRef CAS PubMed
.
- T. Phung, Y. Zhang, J. Dunlop and J. Dalziel, Biosens. Bioelectron., 2011, 26, 3127–3135 CrossRef CAS PubMed
.
- M. Tanaka and E. Sackmann, Nature, 2005, 437, 656–663 CrossRef CAS PubMed
.
- S. B. Hladky and D. A. Haydon, Biochim. Biophys. Acta, Biomembr., 1972, 274, 294–312 CrossRef CAS
.
- W. Veatch and L. Stryer, J. Mol. Biol., 1977, 113, 89–102 CrossRef CAS PubMed
.
- D. a Kelkar and A. Chattopadhyay, Biochim. Biophys. Acta, Biomembr., 2007, 1768, 2011–2025 CrossRef CAS PubMed
.
- D. W. Urry, Proc. Natl. Acad. Sci. U. S. A., 1971, 68, 672–676 CrossRef CAS
.
- D. W. Urry, M. C. Goodall, J. D. Glickson and D. F. Mayers, Proc. Natl. Acad. Sci. U. S. A., 1971, 68, 1907–1911 CrossRef CAS
.
- J. A. Killian, Biochim. Biophys. Acta, 1992, 1113, 391–425 CrossRef CAS
.
- G. Decher, J. D. Hong and J. Schmitt, Thin Solid Films, 1992, 210–211, 831–835 CrossRef CAS
.
- G. Decher, M. Eckle, J. Schmitt and B. Struth, Curr. Opin. Colloid Interface Sci., 1998, 3, 32–39 CrossRef CAS
.
- T. Cassier, A. Sinner, A. Offenhäuser and H. Möhwald, Colloids Surf., B, 1999, 15, 215–225 CrossRef CAS
.
- S. Moya, E. Donath, G. B. Sukhorukov, M. Auch, H. Ba, H. Lichtenfeld and H. Mo, Macromolecules, 2000, 33, 4538–4544 CrossRef CAS
.
- R. Georgieva, S. Moya, S. Leporatti, B. Neu, H. Ba, C. Reichle, E. Donath and H. Mo, Langmuir, 2000, 16, 7075–7081 CrossRef CAS
.
- R. Georgieva, S. E. Moya, H. Bäumler, H. Möhwald and E. Donath, J. Phys. Chem. B, 2005, 109, 18025–18030 CrossRef CAS PubMed
.
- R. Kügler and W. Knoll, Bioelectrochemistry, 2002, 56, 175–178 CrossRef
.
- M. Fischlechner, M. Zaulig, S. Meyer, I. Estrela-Lopis, L. Cuéllar, J. Irigoyen, P. Pescador, M. Brumen, P. Messner, S. Moya and E. Donath, Soft Matter, 2008, 4, 2245 RSC
.
- E. Diamanti, L. Cuellar, D. Gregurec, S. E. Moya and E. Donath, Langmuir, 2015, 31, 8623–8632 CrossRef CAS PubMed
.
- E. Diamanti, D. Gregurec, M. J. Rodríguez-Presa, C. A. Gervasi, O. Azzaroni and S. E. Moya, Langmuir, 2016, 32, 6263–6271 CrossRef CAS PubMed
.
- C. A. Keller and B. Kasemo, Biophys. J., 1998, 75, 1397–1402 CrossRef CAS PubMed
.
- E. Diamanti, P. Andreozzi, R. Anguiano, L. Yate, D. Gregurec, N. Politakos, R. F. Ziolo, E. Donath and S. E. Moya, Phys. Chem. Chem. Phys., 2016, 18, 32396–32405 RSC
.
- G. N. Tishchenko, V. I. Andrianov, B. K. Vainstein, M. M. Woolfson and E. Dodson, Acta Crystallogr., Sect. D: Biol. Crystallogr., 1997, 53, 151–159 CrossRef CAS PubMed
.
- L. Connelly, H. Jang, F. T. Arce, R. Capone, S. A. Kotler, S. Ramachandran, B. L. Kagan, R. Nussinov and R. Lal, J. Phys. Chem. B, 2012, 116, 728–735 CrossRef PubMed
.
- M. Diociaiuti, F. Bordi, A. Motta, A. Carosi, A. Molinari, G. Arancia and C. Coluzza, Biophys. J., 2002, 82, 3198–3206 CrossRef CAS PubMed
.
- C. A. Gervasi and A. E. Vallejo, Electrochim. Acta, 2002, 47, 2259–2264 CrossRef CAS
.
- T. E. Andreoli, J. A. Bangham and D. C. Tosteson, J. Gen. Physiol., 1967, 50, 1729 CrossRef CAS PubMed
.
Footnotes |
| † Electronic supplementary information (ESI) available. See DOI: 10.1039/c7sm01539a |
| ‡ E. D and E. G contributed equally to this manuscript. |
| This journal is © The Royal Society of Chemistry 2017 |

