 Open Access Article
Creative Commons Attribution 3.0 Unported Licence
Visualization of periodic electric polarizability of helical nanofibers formed by self-assembly of nucleotide-bearing bolaamphiphiles and natural-source DNA as a template†
Rika
Iwaura

Food Research Institute, National Agriculture and Food Research Organization, 2-1-12 Kannondai, Tsukuba, Ibaraki 305-8642, Japan. E-mail: riwaura@affrc.go.jp; Fax: +81-29-838-7996; Tel: +81-29-838-8022
First published on 26th October 2017
Abstract
The possibility of fabricating DNA-based electronics has attracted considerable attention, but constructing robust, functional DNA nanowires on hard substrates has proven to be difficult. This paper describes the production of robust one-dimensional nanofibers by self-assembly of 1,18-nucleotide-bearing bolaamphiphiles templated by salmon sperm DNA. Electrostatic force microscopy measurements of the nanofibers on a highly oriented pyrolytic graphite substrate revealed that they showed electric polarizability that varied periodically with a pitch of 20–30 nm. Atomic force microscopy, gel electrophoresis, and circular dichroism spectroscopy suggested that the periodic polarizability was derived from right-handed helicity induced by the template DNA. Salmon sperm DNA itself did not show electric polarizability.
Introduction
DNA self-assembles readily owing to precise molecular recognition between its component molecules and is therefore a promising building block for well-defined nanostructures. Many researchers have constructed nanostructures and nanodevices such as DNA origami, DNA-based metal assemblies, and DNA-based plasmonic nanostructures.1–4 In addition, the ability of DNA molecules to act as conductive nanowires, both in solution and on surfaces, has been investigated theoretically and demonstrated experimentally.5–9 However, because surface-adsorbed DNA is fragile, its electronic functions are poorly reproducible, and it can sometimes act as an insulator instead of as a conductor. Therefore, although protein- and peptide-based electronics, such as molecular wires, biomedical devices, and field-emitting transistors,10–13 are known, progress toward the development of DNA-based electronics has been limited.14 However, Porath et al. demonstrated that G-quadruplex DNA, a robust structure consisting of stacked planar guanine tetrads, shows polarizability and long-range charge transport, as indicated by electrostatic force microscopy (EFM).15,16 These results suggest the importance of structural robustness for DNA conductivity.My research group has reported the formation of one-dimensional helical nanofibers with widths of 5.5–7 and pitches of 20–30 nm by means of DNA-templated self-assembly of nucleotide-bearing bolaamphiphiles—that is, bolaamphiphiles bearing a 3′-phosphorylated adenosine, thymidine, guanosine, or cytosine moiety at each end of a long oligomethylene chain.17–19 These nanofibers are highly stabilized by noncovalent interactions extending along the longitudinal axis of the nanofiber, such as stacking interactions between the nucleic acids and hydrophobic interactions between the oligomethylene chains. In addition, the exterior of the nanofibers is edged by the template DNA owing to complementary base pairing, which results in the formation of DNA-like helical structures. Even when dried, these nanofibers are stable on hard substrates such as mica and highly oriented pyrolytic graphite. Thus, the nanofibers can be expected to exhibit electrical properties similar to those of G-quadruplex DNA. Herein, the construction of one-dimensional helical nanofibers by self-assembly of salmon-sperm-derived DNA and nucleotide-bearing bolaamphiphiles is reported; the nanofibers showed unique periodic polarizability derived from the helical nanofiber structure, as indicated by EFM.
Experimental
Preparation of self-assemblies
Bolaamphiphiles bearing adenylic acid, thymidylic acid, guanylic acid, and cytidylic acid moieties—A18A, T18T, G18G, and C18C respectively—were synthesized by means of the phosphoramidite method reported previously.18 Salmon sperm DNA was purchased from Wako Pure Chemical Industries (Osaka, Japan) and used without further purification.A18A, T18T, G18G, and C18C were heated for 1 h in Milli-Q water at 90 °C with sonication. The resulting solution was subjected to thermal cycling in a Mastercycler Nexus cycler (Eppendorf, Hamburg, Germany) programmed for 30 cycles of 5 min at 95 °C, 5 min at 25 °C, and 30 s at 70 °C. The solution was then incubated at 25 °C overnight to give self-assemblies of the four nucleotide-bearing bolaamphiphiles (hereafter abbreviated 4M).
To prepare self-assemblies from salmon sperm DNA and the four nucleotide-bearing bolaamphiphiles (hereafter abbreviated DNA-SS/4M), an aqueous solution of A18A, T18T, G18G, and C18C (prepared by heating and sonication as described above) was added to the DNA, and the mixture was then subjected to thermal cycling as described above. The concentration of each of the nucleotide-bearing bolaamphiphiles and the salmon sperm DNA was adjusted to 2 g L−1. At this concentration, the molar concentration of salmon sperm DNA and the sum of the molar concentrations of the nucleotide-bearing bolaamphiphiles were 6 × 10⁻³ mol L−1 and 1.6 × 10⁻², respectively, based on the nucleotide moieties. An aqueous solution containing only salmon sperm DNA was prepared by means of a procedure similar to that described for DNA-SS/4M.
Atomic force microscopy and EFM observations
For atomic force microscopy (AFM) observations, 2 μL of a dispersion of DNA-SS/4M or salmon sperm DNA was placed on mica and dried at room temperature for 1 h. The specimen was then washed with Milli-Q water (10 μL), blotted with filter paper to remove excess water, dried again for 30 min, and then observed with an atomic force microscope (MFP-3D BIO, Oxford Instruments, Oxford, UK) equipped with a silicon microcantilever (4096 × 4096 pixels, OMCL-240TS, spring constant 2 N m−1; Olympus, Tokyo, Japan) in tapping mode.For EFM observations, the dispersions of DNA-SS/4M (1 μL) and salmon sperm DNA (1 μL) were placed on highly oriented pyrolytic graphite, mixed, and then dried at room temperature for 1 h. The specimen was then washed with Milli-Q water (10 μL), blotted with filter paper to remove excess water, and dried again overnight. The dried specimen was fixed on a copper plate with conductive carbon tape and observed with an MFP-3D-BIO instrument equipped with the microcantilever used for AFM. EFM images (256 × 256 pixels) were obtained with a voltage of +5, 0, or −5 V supplied to the microcantilever.
Agarose gel electrophoresis
Agarose gel electrophoresis was performed in tris/borate/EDTA (TBE) buffer (TaKaRa, Tokyo, Japan). Ethidium bromide (EtBr) and DNA markers (1 kb DNA ladder and 100 bp DNA ladder) were purchased from Bio-Rad (CA, USA) and TaKaRa, respectively. Agarose (0.75 g, Agarose HS; Nippon Gene, Japan) was dissolved in 50 mL of boiling TBE buffer solution, and the resulting solution was poured into a gel-forming cassette, which was kept at room temperature for at least 1 h. Electrophoresis was performed at 3.3 V cm−1 for 90 min with a Mupid-exU electrophoresis system (Advance Co., Tokyo, Japan). Then the gel was placed on a UV fluorescent thin-layer chromatography plate (Silica Gel 60 F254 aluminum sheet, Merck, Darmstadt, Germany) wrapped with cling film, and the wrapped plate was illuminated by a UV lamp at 254 nm. For EtBr staining, the agarose gel was stained in a TBE buffer solution containing EtBr (10 μg mL−1), and bands were photographed under UV light.Circular dichroism spectroscopy
Circular dichroism (CD) spectra were measured in aqueous solution with a J-820 instrument (JASCO Corp., Tokyo, Japan) and a 0.02 cm microsampling disc. The samples were diluted 5-fold with Milli-Q water.Results and discussion
AFM and EFM observations
AFM images of salmon sperm DNA dried on mica revealed a network-like structure consisting of ∼1.6 nm-high clusters of DNA strands (Fig. 1a and Fig. S1a, ESI†). Similar structures with heights of ∼2 nm have been reported for DNA on hard substrates and have been attributed to a monolayer of DNA strands.20–22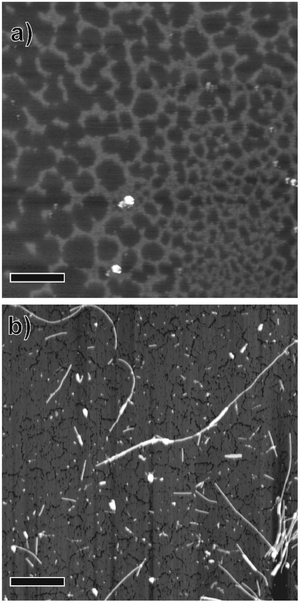 | ||
| Fig. 1 Atomic force microscopy images of (a) salmon sperm DNA and (b) DNA-SS/4M nanofibers dried on mica substrates. Scale bars = 1 μm. | ||
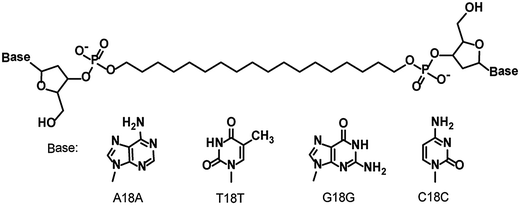
Dispersed whitish flocs were observed in the aqueous solution containing the self-assembly from the four nucleotide-bearing bolaamphiphiles (A18A, T18T, G18G, and C18C; Scheme 1) and salmon sperm DNA (DNA-SS/4M). AFM images of the flocs dried on mica revealed one-dimensional, unbranched nanofibers with a uniform height (diameter) of 4.4 nm and lengths of several hundred nanometers to 5 μm (Fig. 1b and Fig. S1b, ESI†). An AFM phase image of one of the nanofibers suggested a discrete helical morphology with a pitch of ∼20 nm (Fig. S1c, ESI†). The CD spectrum of DNA-SS/4M (discussed below) was consistent with the formation of a right-handed helical structure. The structure of DNA-SS/4M on mica clearly differed from that of salmon sperm DNA and that of 4M, which has a nanorod structure (width 2.8–40 nm, length ∼500 nm).17 The height of the DNA-SS/4M nanofibers was slightly less than that of previously reported nanofibers formed from nucleotide-bearing bolaamphiphiles and synthetic oligo-DNA as a template (5.5–7 nm), owing to the difference in composition, as will be discussed below. The pitch of the DNA-SS/4M nanofibers was similar to that of nanofibers previously reported by my research group.17,19
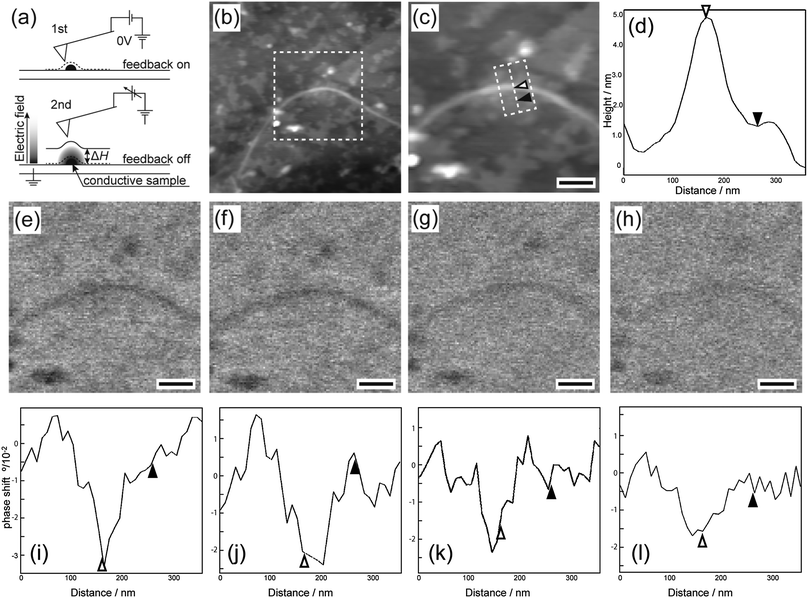
EFM was used to compare the electrostatic characteristics of the DNA-SS/4M nanofibers and salmon sperm DNA on highly oriented pyrolytic graphite. First, the EFM probe was scanned across the surface of a sample containing both DNA-SS/4M and salmon sperm DNA to obtain normal topographic images of the two structures (Fig. 2a, upper panel). Then the probe was raised (by ΔH) to eliminate van der Waals forces between the sample and the probe, a bias was applied between the probe and the sample, and the probe was scanned parallel to the topographic line obtained from the first scan, with Z feedback off (Fig. 2a, lower panel). The electrostatic force between the probe and the sample, derived from charged domains, shifts the resonance frequency of the probe and is displayed as a phase image. Because EFM measurements are sensitive to the characteristics of the cantilever and to the measurement conditions, the DNA-SS/4M nanofibers and salmon sperm DNA were coadsorbed on the graphite substrate for these EFM measurements.
The topographic images of the coadsorbed DNA-SS/4M and salmon sperm DNA revealed a nanofiber and clusters, respectively (Fig. 2b and c). The height profile (Fig. 2d) revealed that the nanofiber was ∼4.7 nm high (indicated by the white triangle) and that the cluster was ∼1.5 nm high (indicated by the black triangle). These morphologies and heights are consistent with the results obtained by AFM (Fig. 1 and Fig. S1, ESI†).
Once it had been confirmed that the DNA-SS/4M nanofibers and salmon sperm DNA clusters could be observed within the same field of view, EFM measurements of the area (indicated by the dashed box in Fig. 2b) were carried out. The EFM images of the salmon sperm DNA clusters showed only slight phase shifts irrespective of the bias voltage (Fig. S2a and b, ESI†) and ΔH (Fig. 2e–h); the amplitude of the shifts was comparable to the noise level (Fig. 2i–l and Fig. S3, ESI†). These results indicate that there was almost no electrostatic interaction between the DNA and the cantilever tip and thus that the DNA did not behave as a conductor on the substrate. In contrast, a negatively shifted phase image was observed for the DNA-SS/4M nanofiber at bias voltages of both +5 and −5 V at a ΔH of 5 nm (Fig. 2e, i and Fig. S2b, ESI†). However, no phase image was observed for the nanofiber at a voltage of 0 V and a ΔH of 5 nm (Fig. S2a, ESI†). These observations suggest that the cantilever tip was not affected by van der Waals interactions when it was lifted by 5 nm and hence that the phase shifts observed at ±5 V were due to electrostatic interactions between the cantilever tip and the nanofiber. In addition, negatively shifted phase images were obtained for the position of the nanofiber regardless of the sign of the voltage. This result indicates that the electrostatic interaction between the nanofiber and the cantilever tip was attractive, owing to the polarizability of the nanofiber.16,23,24 The phase shift at the nanofiber location indicated by the white triangle in Fig. 2c varied from −3.2° to −1.5° as ΔH was varied from 5 to 100 nm (Fig. 2f–l and Fig. S3, ESI†). A ΔH of 100 nm (at which the phase shifts of the nanofiber and salmon sperm DNA were −1.5° and −0.5°, respectively) was sufficient to allow comparison of the heights of the salmon sperm DNA cluster and the nanofiber (difference of ∼3 nm). This result confirms that the effect of the height difference on the electrostatic interactions between the probe and the salmon sperm DNA and the nanofiber was negligible even though the Z feedback was off during the second scan.
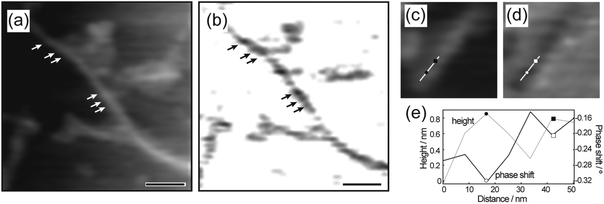
More interestingly, a periodic arrangement of dark and bright areas was observed in the EFM phase images of the nanofibers (Fig. 3b and Fig. S8c, ESI†), suggesting that the polarizability of the nanofiber was not homogeneous. The periodicity in the EFM phase images of the nanofiber matched that of the helical periodicity observed in the topographic and amplitude images (Fig. 3a and Fig. S8a, b, ESI†); in both cases, the periodicity was 20–30 nm. Furthermore, the section profiles of the topography and the EFM phase shift of the nanofiber were symmetrical (Fig. 3e).
Agarose gel electrophoresis
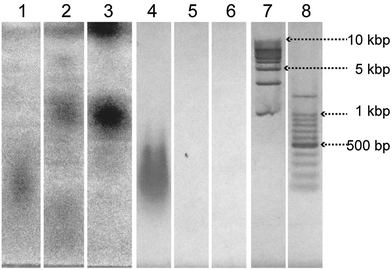
The complexation of salmon sperm DNA and the nucleotide-bearing bolaamphiphiles was investigated by means of agarose gel electrophoresis (Fig. 4). The bands were visualized by UV shadowing25 and by EtBr staining. Relatively broad bands corresponding to the 100 to 500 bp DNA ladder marker were observed for salmon sperm DNA (lanes 1 and 4). An aqueous solution of 4M displayed no bands when visualized by EtBr staining (lane 6), indicating that EtBr did not bind to 4M. In contrast, UV shadowing revealed dark bands centered at −1 kbp and at the origin (lane 3). For the aqueous solution of DNA-SS/4M, no band corresponding to salmon sperm DNA was observed by either UV shadowing or EtBr staining (lanes 2 and 5), suggesting that salmon sperm DNA did not exist as free DNA in the aqueous solution of DNA-SS/4M. In contrast, DNA-SS/4M showed a weakly-colored band at the same position as the 4M band (at −1 kbp) when the bands were visualized by UV shadowing (lane 2). Because the four nucleotide-bearing bolaamphiphiles were added in excess relative to the amount of salmon sperm DNA, this band was attributed to free nucleotide-bearing bolaamphiphiles. The electrophoresis results revealed that in aqueous solution, the salmon sperm DNA and the nucleotide-bearing bolaamphiphiles self-assembled to form a complex. Because the DNA-SS/4M nanofibers had a wide distribution of lengths (Fig. 1b), no clear bands attributable to them were observed in the gel.CD spectroscopy
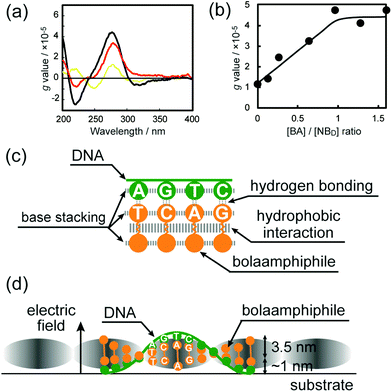
The CD spectrum of an aqueous solution of DNA-SS/4M exhibited a bisignate CD signal in the wavelength region characteristic of the π–π* transitions of the nucleobase moieties (Fig. 5a). Positive and negative Cotton bands at λ = 280 and 220 nm indicated the right-handed helicity of the DNA-SS/4M nanofibers. Anisotropy factors (g values)26,27 for the CD spectra of DNA, 4M, and DNA-SS/4M were calculated. The g value for DNA-SS/4M was larger than the values for salmon sperm DNA and 4M, which suggests the greater chirality of DNA-SS/4M relative to that of DNA or 4M. The CD spectra of DNA-SS/4M were obtained at 4M concentrations ranging from 0 to 1.6 × 10⁻² M. Note that the concentration of 4M is taken as [BA]/[NBD], where [BA] is the total molar concentration of the four nucleotide-bearing bolaamphiphiles (which are present at equimolar amounts in 4M), and [NBD] is the molar concentration of nucleobase moieties in the salmon sperm DNA; [BA]/[NBD] ranged from 0![[thin space (1/6-em)]](https://www.rsc.org/images/entities/char_2009.gif) :
:![[thin space (1/6-em)]](https://www.rsc.org/images/entities/char_2009.gif) 1 to 1.6
1 to 1.6![[thin space (1/6-em)]](https://www.rsc.org/images/entities/char_2009.gif) :
:![[thin space (1/6-em)]](https://www.rsc.org/images/entities/char_2009.gif) 1. The results revealed that the intensity of the CD spectrum strongly depended on the 4M concentration. The g value of the positive Cotton effect due to the nucleobase moieties became higher as the concentration of nucleotide-bearing bolaamphiphiles was increased (Fig. S9, ESI†), supporting the induction of helicity in the DNA-SS/4M nanofibers. To determine the optical activity of the nucleobase moieties as a function of 4M concentration, g values at λ = 280 nm were plotted against 4M concentration (Fig. 5b). The plot revealed that the g value reached a plateau at a [BA]/[NBD] ratio between 0.8
1. The results revealed that the intensity of the CD spectrum strongly depended on the 4M concentration. The g value of the positive Cotton effect due to the nucleobase moieties became higher as the concentration of nucleotide-bearing bolaamphiphiles was increased (Fig. S9, ESI†), supporting the induction of helicity in the DNA-SS/4M nanofibers. To determine the optical activity of the nucleobase moieties as a function of 4M concentration, g values at λ = 280 nm were plotted against 4M concentration (Fig. 5b). The plot revealed that the g value reached a plateau at a [BA]/[NBD] ratio between 0.8![[thin space (1/6-em)]](https://www.rsc.org/images/entities/char_2009.gif) :
:![[thin space (1/6-em)]](https://www.rsc.org/images/entities/char_2009.gif) 1 and 1
1 and 1![[thin space (1/6-em)]](https://www.rsc.org/images/entities/char_2009.gif) :
:![[thin space (1/6-em)]](https://www.rsc.org/images/entities/char_2009.gif) 1, suggesting that only one end of each nucleotide-bearing bolaamphiphile in the DNA-SS/4M nanofibers was in complex with a single strand of salmon sperm DNA.
1, suggesting that only one end of each nucleotide-bearing bolaamphiphile in the DNA-SS/4M nanofibers was in complex with a single strand of salmon sperm DNA.
Polarizability of the nanofiber derived from salmon sperm DNA template
As described above, the construction of right-handed helical nanofibers from natural-source DNA was demonstrated. The salmon sperm DNA did not show electric polarizability, as has been reported previously.16,28,29 This fact indicates the importance of using robust structures, such as G-quadruplex DNA,12 to achieve conductivity on a hard substrate.12 In this study, the electric polarizability of self-assembled helical nanofibers formed from salmon sperm DNA and nucleotide-bearing bolaamphiphiles was confirmed by EFM measurements, and more interestingly, the polarizability showed periodicity.The helical nanofibers appeared to have structures similar to those of nanofibers obtained by self-assembly of nucleotide-bearing bolaamphiphiles and synthetic oligo-DNA as a template.13,15 That is, the oligomethylene chains of the nucleotide-bearing bolaamphiphiles aggregated at the center of the nanofibers, and this aggregation resulted in extensive hydrophobic interactions along the longitudinal direction of the nanofibers, resulting in a thermodynamically stable structure.30 The antisymmetric stretching νas(CH2) band, which is a sensitive indicator of the alkylene chain conformation,31 appeared at 2916 cm−1 for the DNA-SS/4M nanofibers (Table S1, ESI†), suggesting that the alkylene chains of the nucleotide-bearing bolaamphiphiles in the nanofibers were in an all-trans conformation. A similar νas(CH2) band frequency has been reported for alkyl chains with an all-trans conformation in a single crystal of n-alkane.32 Therefore, I contend that the oligomethylene chains of the nucleotide-bearing bolaamphiphiles were tightly packed in an all-trans conformation in the DNA-SS/4M nanofiber.
On the outside of the nanofibers, the nucleobase moieties of the bolaamphiphiles were stacked and formed complementary base pairs with the bases of the salmon sperm DNA, resulting in right-handed helicity. The molar absorptivity of the nucleobase moiety of the DNA-SS/4M nanofiber (5.9 × 10³ dm3 mol−1 cm−1) was smaller than the absorptivities of the nucleobase moieties in DNA-SS (6.2 × 10³ dm3 mol−1 cm−1) and 4M (6.8 × 10³ dm3 mol−1 cm−1), the calculated molar absorptivity obtained from the sum of the UV absorption spectra of DNA-SS and 4M (6.6 × 10³ dm3 mol−1 cm−1), and the absorptivities of the four nucleic acid monomers (8.9–15 × 103 dm3 mol−1 cm−1), as shown in Fig. S10 and Table S2 (ESI†). The hypochromic effect observed for the DNA-SS/4M nanofiber suggests that the stacking interaction between the nucleobases were strong in the nanofiber. The crystalline-like oligomethylene chain packing and the strong stacking interaction of the nucleobase moieties is likely to have contributed substantially to the rigidity and polarizability of the DNA-SS/4M nanofiber (Fig. 5c). The rod-like structure self-assembled from 4M showed a νas(CH2) band frequency (2917 cm−1) and hypochromicity similar to those of the DNA-SS/4M nanofiber (Table S2, ESI†), suggesting that the robustness of the nanofiber structure is derived from the robustness of the self-assembled 4M structure. In fact, the EFM images of the rod-like self-assembly formed from 4M displayed a negative shift at bias voltages of +5 and −5 V, indicating electric polarizability (Fig. S6, ESI†). These results indicate that the nanofiber formed by co-assembly of DNA and 4M showed electric polarizability that was independent of the DNA sequence (Fig. S4–S7, ESI†). Because the nucleotide-bearing bolaamphiphiles were symmetrical (the bases at both ends were the same), when they paired with the matched nucleobases of the template DNA, the sequence of the nucleobases at the unpaired ends of the nucleotide-bearing bolaamphiphiles would be unlikely to match the base sequence of the salmon sperm DNA. Thus, the nucleobases in the salmon sperm DNA and the nucleotide-bearing bolaamphiphiles were present at a 1![[thin space (1/6-em)]](https://www.rsc.org/images/entities/char_2009.gif) :
:![[thin space (1/6-em)]](https://www.rsc.org/images/entities/char_2009.gif) 1 molar ratio in the resulting complex; the nucleobases at one of the ends of each nucleotide-bearing bolaamphiphile existed in a free state. The width of the fiber as measured by AFM (∼4.4 nm) was consistent with the sum of the molecular lengths of the nucleotide-bearing bolaamphiphiles (3.5 nm)18 and the width of single-stranded DNA (1 nm).
1 molar ratio in the resulting complex; the nucleobases at one of the ends of each nucleotide-bearing bolaamphiphile existed in a free state. The width of the fiber as measured by AFM (∼4.4 nm) was consistent with the sum of the molecular lengths of the nucleotide-bearing bolaamphiphiles (3.5 nm)18 and the width of single-stranded DNA (1 nm).
Detailed comparison of the topographic and polarization structures of the helical nanofibers revealed that the phase shifts in the EFM measurements were more negative at the higher positions in the corresponding topographic images, and were less negative at the lower positions (Fig. 3c–e). The higher positions in the helical nanofibers likely correspond to the positions where the nucleotide-bearing bolaamphiphiles are oriented nearly perpendicular to the substrate, whereas the lower positions correspond to positions of nearly parallel orientation (Fig. 5d). This observation suggests that the polarization of the nanofibers varied with the arrangement of the nucleotide-bearing bolaamphiphiles and salmon sperm DNA with respect to the substrate, and thus the helical nanofibers had periodically polarizable structures.
Conclusions
The polarizability of self-assembled helical nanofibers with diameters of <10 nm was demonstrated by EFM. The polarizability of the nanofibers in an electric field depended on the arrangement of the constituent molecules. These results demonstrate that the use of a DNA template to precisely control the electric characteristics of nanomaterials is a promising technique that can be expected to facilitate the development of nanoelectronics.Acknowledgements
I thank Oxford Instruments for their help with EFM measurements.References
- L. B. Wang, L. G. Xu, H. Kuang, C. L. Xu and N. A. Kotov, Acc. Chem. Res., 2012, 45, 1916 CrossRef CAS PubMed.
- T. Torring, N. V. Voigt, J. Nangreave, H. Yan and K. V. Gothelf, Chem. Soc. Rev., 2011, 40, 5636 RSC.
- S. J. Tan, M. J. Campolongo, D. Luo and W. L. Cheng, Nat. Nanotechnol., 2011, 6, 268 CrossRef CAS PubMed.
- A. V. Pinheiro, D. R. Han, W. M. Shih and H. Yan, Nat. Nanotechnol., 2011, 6, 763 CrossRef CAS PubMed.
- R. M. Young, A. P. N. Singh, A. K. Thazhathveetil, V. Y. Cho, Y. Q. Zhang, N. Renaud, F. C. Grozema, D. N. Beratan, M. A. Ratner, G. C. Schatz, Y. A. Berlin, F. D. Lewis and M. R. Wasielewski, J. Am. Chem. Soc., 2015, 137, 5113 CrossRef CAS PubMed.
- J. D. Slinker, N. B. Muren, S. E. Renfrew and J. K. Barton, Nat. Chem., 2011, 3, 228 CrossRef CAS PubMed.
- H. Cohen, C. Nogues, R. Naaman and D. Porath, Proc. Natl. Acad. Sci. U. S. A., 2005, 102, 11589 CrossRef CAS PubMed.
- D. Porath, G. Cuniberti and R. Di Felice, Long-Range Charge Transfer in DNA II, 2004, 237, 183 CAS.
- R. G. Endres, D. L. Cox and R. R. P. Singh, Rev. Mod. Phys., 2004, 76, 195 CrossRef CAS.
- R. de la Rica and H. Matsui, Chem. Soc. Rev., 2010, 39, 3499 RSC.
- K. Besar, H. A. M. Ardona, J. D. Tovar and H. E. Katz, ACS Nano, 2015, 9, 12401 CrossRef CAS PubMed.
- D. Ivnitski, M. Amit, O. Silberbush, Y. Atsmon-Raz, J. Nanda, R. Cohen-Luria, Y. Miller, G. Ashkenasy and N. Ashkenasy, Angew. Chem., Int. Ed., 2016, 55, 9988 CrossRef CAS PubMed.
- M. Torculas, J. Medina, W. Xue and X. Hu, ACS Biomater. Sci. Eng., 2016, 2, 1211 CrossRef CAS.
- E. Scheer, Nat. Nanotechnol., 2014, 9, 960 CrossRef CAS PubMed.
- G. I. Livshits, A. Stern, D. Rotem, N. Borovok, G. Eidelshtein, A. Migliore, E. Penzo, S. J. Wind, R. Di Felice, S. S. Skourtis, J. C. Cuevas, L. Gurevich, A. B. Kotlyar and D. Porath, Nat. Nanotechnol., 2014, 9, 1040 CrossRef CAS PubMed.
- H. Cohen, T. Sapir, N. Borovok, T. Molotsky, R. Di Felice, A. B. Kotlyar and D. Porath, Nano Lett., 2007, 7, 981 CrossRef CAS PubMed.
- R. Iwaura, Y. Kanai and M. Ohnishi-Kameyama, ChemPlusChem, 2016, 81, 1230 CrossRef CAS.
- R. Iwaura, T. Iizawa, H. Minamikawa, M. Ohnishi-Kameyama and T. Shimizu, Small, 2010, 6, 1131 CrossRef CAS PubMed.
- R. Iwaura, K. Yoshida, M. Masuda, M. Ohnishi-Kameyama, M. Yoshida and T. Shimizu, Angew. Chem., Int. Ed., 2003, 42, 1009 CrossRef CAS PubMed.
- G. Wei, H. L. Zhou, Z. G. Liu, Y. H. Song, L. Wang, L. L. Sun and Z. Li, J. Phys. Chem. B, 2005, 109, 8738 CrossRef CAS PubMed.
- A. G. Wu, Z. Li, L. H. Yu, H. D. Wang and E. Wang, Anal. Sci., 2001, 17, 583 CrossRef CAS PubMed.
- T. Kanno, H. Tanaka, N. Miyoshi and T. Kawai, Jpn. J. Appl. Phys., 2000, 39, L269 CAS.
- T. Jiang, O. A. Vail, Z. G. Jiang, X. B. Zuo and V. P. Conticello, J. Am. Chem. Soc., 2015, 137, 7793 CrossRef CAS PubMed.
- Charged materials shift positive or negative depending on the sign of the bias voltage.
- S. M. Hassur and H. W. Whitlock, Anal. Biochem., 1974, 59, 162 CrossRef CAS PubMed.
- R. Iwaura, F. J. M. Hoeben, M. Masuda, A. Schenning, E. W. Meijer and T. Shimizu, J. Am. Chem. Soc., 2006, 128, 13298 CrossRef CAS PubMed.
- B. M. W. Langeveld-Voss, R. J. M. Waterval, R. A. J. Janssen and E. W. Meijer, Macromolecules, 1999, 32, 227 CrossRef CAS.
- C. Gomez-Navarro, F. Moreno-Herrero, P. J. de Pablo, J. Colchero, J. Gomez-Herrero and A. M. Baro, Proc. Natl. Acad. Sci. U. S. A., 2002, 99, 8484 CrossRef CAS PubMed.
- M. Bockrath, N. Markovic, A. Shepard, M. Tinkham, L. Gurevich, L. P. Kouwenhoven, M. S. W. Wu and L. L. Sohn, Nano Lett., 2002, 2, 187 CrossRef CAS.
- J. Wang, K. Liu, R. Xing and X. Yan, Chem. Soc. Rev., 2016, 45, 5589 RSC.
- M. Masuda, V. Vill and T. Shimizu, J. Am. Chem. Soc., 2000, 122, 12327 CrossRef CAS.
- H. L. Casal, D. G. Cameron and H. H. Mantsch, Can. J. Chem., 1983, 61, 1737 CrossRef.
Footnote |
| † Electronic supplementary information (ESI) available. See DOI: 10.1039/c7sm01420a |
| This journal is © The Royal Society of Chemistry 2017 |

