
 Open Access Article
 This Open Access Article is licensed under a
 Creative Commons Attribution 3.0 Unported Licence
Self-assembled clusters of patchy rod-like molecules†
Miroslav
Jurásek
*ab and
Robert
Vácha
 ab
ab
aCEITEC – Central European Institute of Technology, Kamenice 5, 625 00 Brno, Czech Republic
bFaculty of Science, Masaryk University, Kotlářská 2, 602 00 Brno, Czech Republic. E-mail: robert.vacha@mail.muni.cz; robertvacha@gmail.com
First published on 5th September 2017
Abstract
The design of complex self-assembled structures remains a challenging task due to the intricate relationship between the properties of the building blocks and the final morphology of the aggregates. Here, we report such a relationship for rod-like particles with one or two attractive patches based on a combination of computer simulations and analytical theory. We investigated the formation of finite aggregates under various conditions and constructed structure diagrams, which can be used to determine and extrapolate the system composition. The size of the clusters is mainly determined by the size of the attractive patches and their geometrical arrangement. We showed that it is challenging to obtain clusters with more than four particles in high yields, and more complex building blocks or additional molecules would need to be used. Moreover, the particles with patch sizes close to the structure boundaries can switch between the aggregate state by a small change in conditions. These findings can be useful for the development of self-assembling building blocks and for the understanding of protein folds of coiled coils under various conditions.
1 Introduction
The development of artificial building blocks which can be used in the self-assembly of large and complex structures remains challenging.1,2 The ability to control the formation of nanostructures by assembling biomolecules is of particular interest, due to their biocompatability and possible use in medicine. Nature offers a great deal of inspiration in the assembly of proteins into an incredibly large number of various nanomachines, tools, covers, and materials with exceptional properties. However, it was recently shown that evolution has not used all possible designs, and it is possible to obtain de novo assemblies not observed in Nature.3–7 Therefore, it is important to explore and find the limits of protein assemblies and attempt to expand the available repertoire of protein folds.There is a vast available space of possible sequences in protein design, which cannot be tested in experiments or simulations for peptides longer than 10 amino acids. An alternative method to explore the available assemblies is a top-down approach, where basic features and understanding are obtained via highly coarse-grained models, which can be further refined to sequence. We employed such a route and investigated how the aggregate structure depends on the shape and distribution of interaction sites on building blocks. To start with, we focused on amphiphilic helical peptides and related finite-size cluster assemblies called coiled-coils.
2 Methods
Simulations
We modeled the shape of an amphiphilic α-helix with a spherocylinder, i.e. a rod with hemispherical caps at both ends, which is a well-studied model of prolate-shaped particles.8–10 Attractive interaction between amphiphilic α-helices was effectively added by decorating a spherocylinder with attractive patch(es) running along the main axis, on the surface of the cylindrical body (see Fig. 1).11–14 The size of a spherocylinder is determined by its diameter, σ = 1.2 nm, and length of the cylindrical part, l = 3 nm. The real space units of nm were chosen to connect to α-helices directly, but the results are valid to other particles with the same aspect ratios. The interacting patch is defined by the angular width α, which is numbered in subscript for spherocylinders with two patches. The angle between the two patches (their centers) is denoted as γ (see Fig. 1A). In simulations, we varied the size of the patches and their position. For particles with two patches we kept both patches the same, α1 = α2 = 10°, and only varied the angle between them. While the size of spherocylinders represents a typical amphiphilic α-helix with about 20 amino acids, the results are valid for any other particles with the same shape, aspect ratio, and the arrangement of interactions. | ||
| Fig. 1 (A) Schematic representation of a patchy spherocylinder with one and two interaction patches. Angles defining the patch size, α, and angle between the patches, γ, are depicted. l is the length of the cylindrical body of the spherocylinder and σ is its diameter. Note that interaction patch covers only the cylindrical part, not the end caps. (B) Distance dependence of interaction potential for particles with short (green line) and longer (blue line) range interactions. δ1 and δ2 are distances at which the potential starts to shift to zero for short and longer range interactions, respectively. λ corresponds to the distance at which cos2 function shifts to zero. | ||
We used an implicit-solvent model, where interactions between attractive patches effectively include all interactions between the particles, e.g. hydrophobic, hydrogen bonds, salt-bridges etc. Distance dependence of repulsive interactions between particles is represented by Weeks–Chandler–Andersen (shift and truncated Leonard-Jones) potentials which goes to a minimum at  . The attractive part of the potential has a cos2 distance dependence with a switching range of 0.3 nm, the distance at which the interaction smoothly goes from minima to zero (see Fig. 1B). Therefore, two particles start to have non-zero interaction at distance ≈1.6 nm between the central line segments. The switching range was chosen to represent a short-range hydrophobic interaction. The depth of attractive potential was set to −1.3333 ε per unit length of interaction patch, i.e. two spherocylinders 3 nm in length have an interaction minimum of −4 ε. Orientation dependence of interaction potential is a complex function calculated with line segments, which define the spherocylinder (all points with a distance smaller than 0.5σ from the line segment are inside the spherocylinder). Attractive interaction between patches is calculated from lengths of line segments situated inside an angular wedge defined by each patch. For the detailed description of interaction potential, we refer the reader to the original paper.11 All the above parameters were the same in all simulations unless explicitly described.
Unless stated otherwise, all systems were composed of 125 patchy speherocylindrical particles in a cubic box with dimensions of 25 × 25 × 25 nm3, which corresponds to a number density of 0.008 nm−3 and equal to a reduced density,15ρ* ≈ 0.04, which is well below the nematic transition at ρ* = 0.60 for hard spherocylinders with an aspect ratio of 2.5. All simulations were done using periodic boundary conditions.
We studied the aggregation at different concentrations, temperatures, and interaction parameters such as the size of the interaction patch and range. All simulations were carried out using the Metropolis Monte Carlo method implemented in our in-house software (freely available at github.com/robertvacha/SC). Simulations were done with an off-lattice model using translation and rotation moves. Single particle translations were done by random vectors from a homogeneous sphere of radius 0.212 nm. Rotations were done by rotating particles around the random axis on a unit sphere16 with an angle in the range from 0° to 7.5°. To enhance the sampling and convergence, all simulations were run in the NVT ensemble with parallel tempering. The temperature range captured compositions from those dominated by large aggregates to those with mostly monomers (0.1 to 0.65 kT/ε). All simulations were started from random configurations. The systems were sampled for ≈108 sweeps after reaching a steady state.
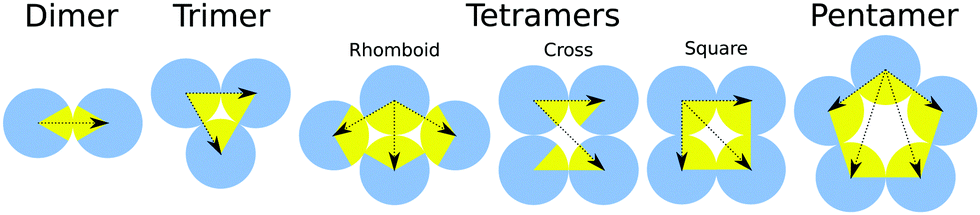
Clusters were defined as aggregates, where all the particles interact, directly or via other particles, more strongly than a threshold of 1.4 ε (see Fig. S6, ESI,† and Fig. 3). We defined different clusters based on the cluster geometry (see Fig. 2). In regular clusters, particles are aligned parallel to each other. This way assemblies closely resemble aggregates of spherical patchy particles in 2D, the topic already studied both experimentally and theoretically.17–20 Closed clusters are defined by patch saturation, i.e. all patches participate in a maximal number of interactions accessible to given patch in regular clusters. The advantage of the regular closed clusters is their symmetry, which makes them easier to analyze and understand. Irregular clusters form only a small portion of clusters in our simulations and should become negligible with increasing particle aspect ratio (see Fig. S8, ESI†).
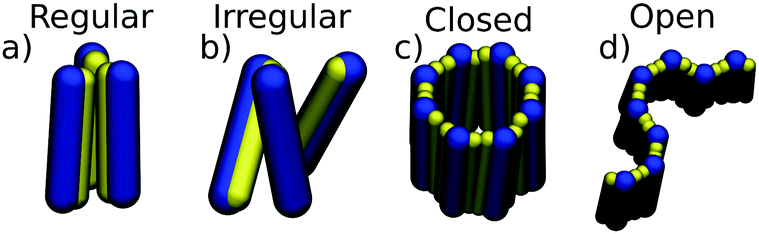 | ||
| Fig. 2 Types of distinguished clusters: (a) regular clusters (parallel particles), (b) irregular clusters, (c) closed clusters, and (d) open clusters. The spherocylinder body is shown in blue and the direction of the interaction patch is displayed as a yellow spherocylinder. | ||
Theory
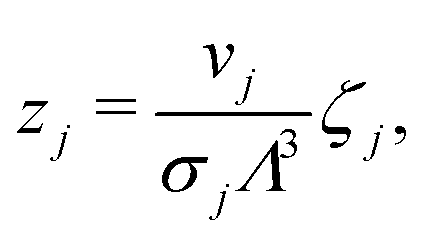
The well-defined morphology of regular clusters enabled us to formulate a following theory for both closed and opened clusters. Let's assume an aggregation equilibrium of j particles, X: jX ⇌ Xj. At low densities, the clusters can be considered as non-interacting, so we can use the law of mass action to express the equilibrium constant, K, as the ratio of cluster partition functions,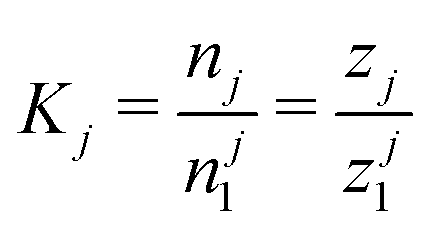 , where n is the equilibrium cluster population and the subscript denotes the cluster size, zj is the cluster partition function, and z1 is the partition function of a monomer. The cluster partition function is given in general form as follows:
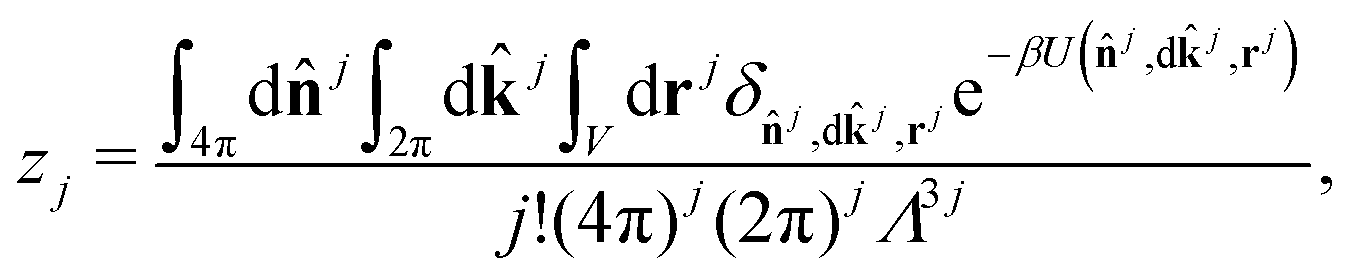 | (1) |
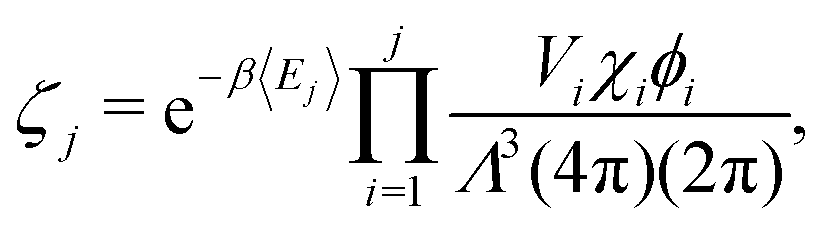
![[n with combining circumflex]](https://www.rsc.org/images/entities/b_char_006e_0302.gif) denotes the orientation of particles,
denotes the orientation of particles, ![[k with combining circumflex]](https://www.rsc.org/images/entities/b_char_006b_0302.gif) denotes the angular orientation of the interaction patch around the axis of the particle, r denotes the position of a particle, U is the interaction energy, β = 1/kBT is the inverse temperature, where kB is the Boltzmann constant, and δj,dj,rj is a function equal to 1 for particles in the cluster and 0 otherwise.
denotes the angular orientation of the interaction patch around the axis of the particle, r denotes the position of a particle, U is the interaction energy, β = 1/kBT is the inverse temperature, where kB is the Boltzmann constant, and δj,dj,rj is a function equal to 1 for particles in the cluster and 0 otherwise.
Eqn (1) could be formally rewritten such that we express the position of all the particles with respect to cluster center of mass. In that case we can separately integrate the center of mass of the cluster over the volume, and internal degrees of freedom of the cluster. Integral over volume then states
 | (2) |
 | (3) |
By substitution of eqn (2) and (3) in the law of mass action, one obtains an expression enabling one to calculate the population of all clusters with respect to monomers and to each other:
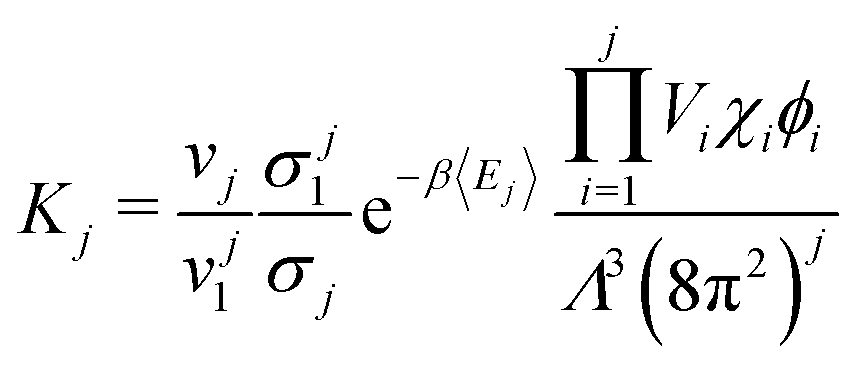 | (4) |
For spherocylinders with one patch, we can approximate the internal degrees of freedom as a function of patch size:
| Viχiϕi ≈ Aig(αi − αmin)3wi | (5) |
For spherocylinders with two patches, the angle between the patches γ defines the optimal cluster geometry (instead of αmin for one patch spherocylinder) and min[α1,2] defines the rotational freedom instead of αi − αmin for one patch, so
| Viχiϕi ≈ Aig(min[αi1,2] − |Δγi|)3wi, | (6) |
The above assumptions were validated by agreement between the theory and the simulation data at different concentrations and with different patch sizes (see the ESI†). The theory thus could be used to extrapolate the system composition under different conditions or to derive relative populations of cluster morphologies under given conditions (see Fig. S10, ESI†).
3 Results
3.1 Particles with one interaction patch
Firstly, we investigated the behavior of systems composed of particles with one patch. The structure diagram determined as a function of the patch size and temperature is displayed in Fig. 4. The particles formed two types of aggregates: finite-size closed clusters and fibril-like open clusters (see Fig. 2). We focused on the finite-size clusters (see Fig. 3) because fibrillar structures occurring at low temperatures were the subject of our previous work.11Morphologies and amounts of clusters depend on the size of the interaction patch and the interaction range. The depicted points in the diagram correspond to conditions where the equilibrium populations of two cluster types are the same. The theoretical dependence fit the simulated points well. For short-range interactions, we obtained clusters up to tetramers in size with an occasional small number of larger non-regular clusters. The system at low temperatures is dominated by dimers up to a patch size of 60°, followed by trimers up to 120°, and tetramers up to 180°. There is a ‘triple’ point where the population of monomers, dimers, and trimers is the same. It might be surprising that the size of the clusters does not follow a geometrical boundary of 90° for the tetramer. The explanations are in the cluster morphology which due to the short-range attraction is rhombic rather than a regular square (see Fig. 3). In the rhombic tetramer, two particles in the middle interact with the other three particles, so they need to have a patch of 120°, which is in agreement with our structural diagram. Close to the patch size boundaries of 60° and 120°, the particles can change the cluster morphology with temperature or interaction strength (see Fig. S10, ESI†). Note that since equipopulation conditions between dimers and trimers are achieved at higher temperature, then under the equipopulation conditions between monomers and trimers there are no conditions where the system is dominated by dimers for particles with a patch larger than α ≈ 70° (the system is mainly composed of monomers at high temperatures and upon cooling it becomes dominated by trimers).
 | ||
| Fig. 3 Schematic representation of clusters observed in simulations for particles with one patch. The particle body is represented as a blue circle, while the interaction patch is shown as a yellow sector. The number of interactions per particle in a cluster is depicted by black dotted lines. | ||
When the interaction is farther reaching, new cluster structures of square tetramers, cross tetramers, and pentamers appeared (see the structure diagram in Fig. 4B). Square and cross tetramers are formed for patches larger than 90°, when the interaction reaches across the diagonal of a square ( diameter). This can be seen by comparison of Fig. 4A and B, where the interaction range was increased from ≈1.64 nm to 2.3 nm (≈1.92 × particle diameter). Despite the similarity in the arrangement of particles in cross and square tetramers, they behave differently due to the differences in their interaction patterns (see Fig. 3). While each particle interacts with all other particles in the square tetramer, each particle interacts with only two other particles in the cross tetramer. Effectively cross tetramers are composed of two dimers connected by interactions across diagonals of the square. Therefore, cross tetramers are less stable than square tetramers due to enthalpy and less stable than trimers due to entropy. As a result cross tetramers are abundant only in the small region of parameter space connected to dimers (see Fig. 4B).
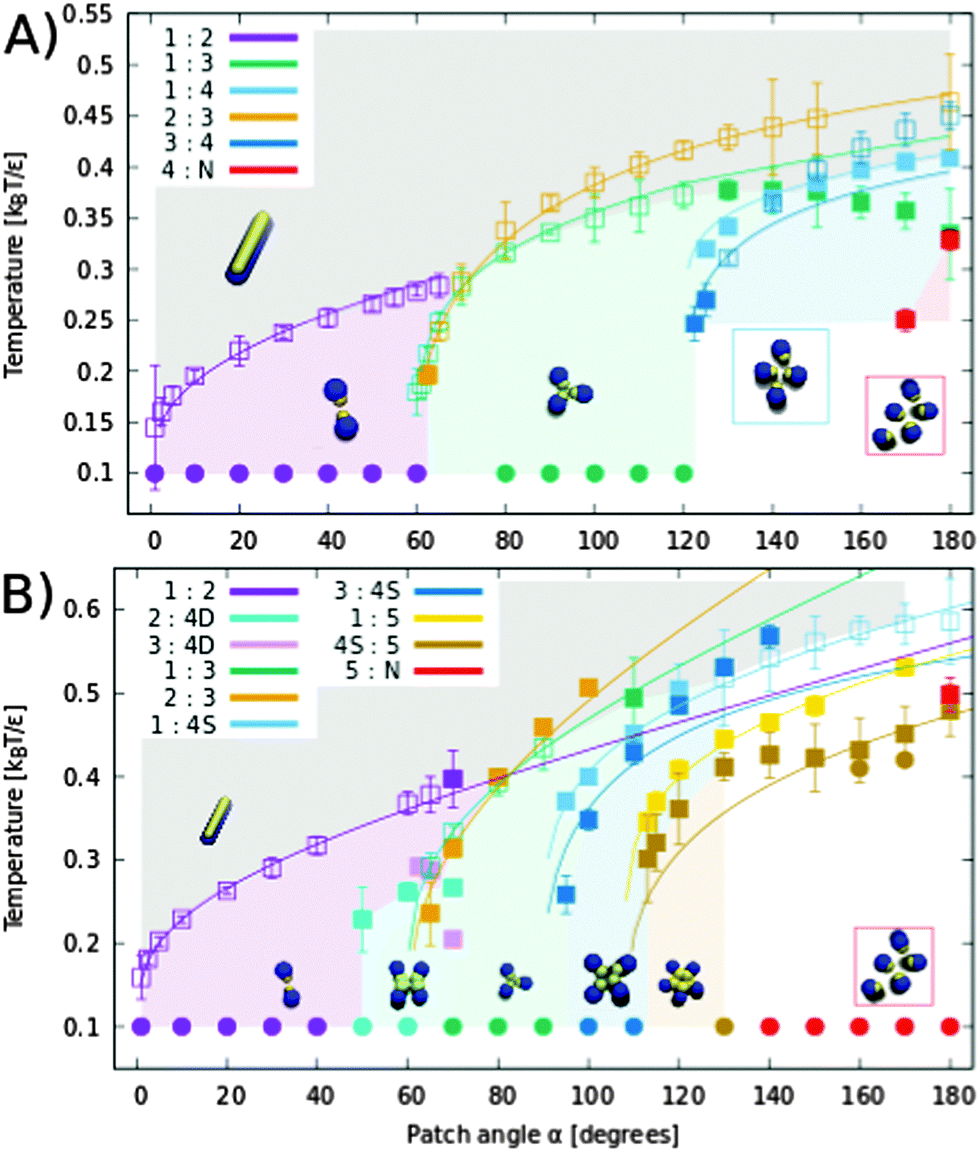 | ||
| Fig. 4 The structure diagram of the clusters formed by one patch spherocylinders with short-range (A) and farther range (B) interactions for various patch sizes. Areas in the graph are colored based on the most abundant cluster morphology found in simulations at given temperatures and at reduced density ρ* ≈ 0.040. Every point, apart from circles, represents an equipopulation point where the population of two cluster types is the same in the simulation. Numbers in the legend refer to the size of clusters, N represent all clusters larger than all clusters explicitly mentioned, 4D refers to cross tetramers, and 4S corresponds to square tetramers. Empty and filled squares are points obtained for systems with 125 and 500 particles, respectively. The “triple point”, where the populations of monomers, dimers, and trimers are the same, is at α = 70° and T ≈ 0.28 for short-range interaction and at α = 80° and T ≈ 0.40 for farther reaching interaction. Circular points represent single-point simulations to sample the most abundant clusters at low temperatures. Error bars represent one standard deviation in cluster population fluctuation. Lines are the equipotential curves based on the theory and fit parameters derived from equipopulation lines between monomers and clusters (fitted parameters are in the ESI†). The equipopulation lines between clusters of different sizes were calculated from theory using fitted parameters for equilibrium populations with monomers. | ||
The square tetramers are the most common tetramers as they are more stable than other tetramers in both enthalpy and entropy (see the number of interactions and the possibility of rotations in Fig. 3). Pentameric clusters were observed for patch angles larger than 108°, where regular pentamers compete with square tetramers. Pentamers are favoured by enthalpy and disfavoured by entropy compared to square tetramers, so pentamers were observed only at low temperatures. However, the situation should change at high densities, where the loss of translation entropy in pentamers decreases and they should become more stable than square tetramers (see Fig. S2, ESI,† for the concentration effect). Finite clusters larger then pentamers appeared occasionally at low temperatures. A further increase of the interaction range can lead to abundant larger finite clusters. However, such a range would be larger than two particle diameters, which would have to be modelled explicitly to avoid the unrealistic possibility of two particles interacting through a third particle.
3.2 Particles with two interaction patches
Another way to form larger finite clusters (hexamers, etc.) is to use particles with two separate patches forming a cluster with a hydrophilic core. For simplicity, we simulated particles with two symmetric patches with a size of 10°. At this size, each patch accommodates an interaction with one other particle, resulting in closed or open chain-like clusters (see Fig. 2). The calculated structure diagram is depicted in Fig. 5. We found that various regular closed clusters could be formed, depending on the angle between the patches, γ. The clusters of each size are the most stable when the angle between the patches corresponds to the inner angle of a regular polygon. We simulated systems with γ of up to 130°, where we observed regular clusters with sizes up to tetramers dominated the system. Pentamers and hexamers were obtained in lower yields. Heptamers or octamers were obtained only rarely. The region of γ angles, where the clusters can be formed, is determined by the patch size, α (see Fig. S9, ESI†). When the patch size is narrow (e.g. simulated 10°) the equipopulation lines might not overlap creating an interesting region, where no closed clusters are formed and the system is composed of open chains (gray area in Fig. 5). Decreasing the overlap for larger clusters could be used to increase their yield.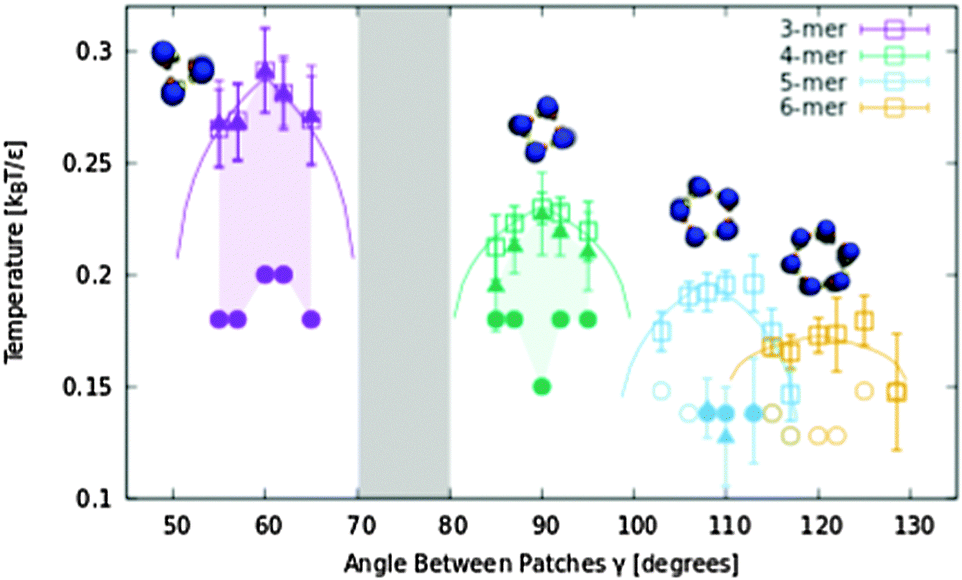 | ||
| Fig. 5 Structure diagram of particles with two symmetric patches of 10°. Areas in the graph are colored according to the most abundant cluster morphology. Squares and triangles are equipopulation points where the populations of two cluster types are the same in the simulation. Squares are for the same populations of monomers and closed clusters. Triangles stand for the equipopulation points between closed clusters and all other clusters in system. Circles stand for the lowest simulated temperature. The circles are filled for the systems dominated by closed clusters. Lines are theoretical fits (see the ESI† – structure diagram fit). Error bars represent one standard deviation in cluster population fluctuation during the simulation. In the gray region, no regular clusters were obtained. | ||
3.3 Discussion
The model parameters used in our simulations were chosen to represent short amphiphilic α-helices aggregating in coiled-coils. We found that the general structural features of the clusters obtained in our simulations resemble those of coiled-coil clusters found in nature.22 Coiled-coil clusters up to pentamers could be represented by single-patch particles with a hydrophobic core. Pentamers are only available when the interaction is farther reaching, which corresponds to the presence of bulky residues, in agreement with known structures.23 Pentamer and hexamer coiled-coils with a hydrophilic or hollow hydrophobic interior are better represented by our two patch model. Our results are in very good agreement with previously estimated phase boundaries for the formation of finite clusters by one patch spherocylinders.11 Our results can be compared to extensively studied models of spherical patchy particles, where finite-size clusters and micelles were also observed at low concentrations and high temperatures.24 However, due to the preferred parallel alignment of spherocylinders in the aggregate, morphologies resemble rather those of patchy spheres observed in two dimensions.17–20 In agreement with our findings, the same cluster morphologies of trimers, tetramers, and long 1D aggregates were observed at low temperatures for one patch spherical particles with a patch width ≈180° and short range interactions (see Fig. 4A).18 This suggests that increasing the interaction range and decreasing the patch width could result in new cluster morphologies as we have found (see Fig. 4B). A comparison of our results to spherical patchy particles in 2D suggests that patchy spherocylinders shall assemble into quasi 2D crystals. However, the third dimension of spherocylinders could result in the closing of the 2D crystal in a large spherical cage, which was reported for amphiphilic helices similar to patchy spherocylinders.25 Unfortunately, the scale of such structures cannot be reached by our simulations.The derived theory fits the simulated data very well and can be used to determine the system composition under various conditions (e.g. concentrations, temperatures, interactions), where assumption of non-interacting clusters holds. It can also be used to calculate the conditions of the highest yield and evaluate the particle interaction parameters necessary for specific clusters. Our results suggest that very specific or directional interactions are needed to obtain larger clusters than pentamers. Such specific interactions include farther reaching interactions that can be realized in the form of hydrophobic chains for smaller particles or farther reaching depletion forces for large particles in specific solvents. For larger clusters, it would thus be advantageous to use more complex building blocks than single α-helices. The addition of end-to-end interactions would result in the formation of fibrils with the cross-section geometry of the clusters described above as previously observed.11 Furthermore, for particles connected by a flexible linker with a patch width of 65° or 125° vitrimer like polymers might be obtained.26,27
4 Conclusion
In summary, the aggregation of rod-like particles with one and two interaction patches was studied using Monte Carlo simulations and a derived theory based on statistical mechanics. The obtained system compositions at various temperatures and various particle parameters are displayed in the form of structure diagrams focused on clusters of different sizes and morphologies. We found that the larger the clusters, the more difficult it is to make them, because the region of parameters where they dominate the system is smaller. Clusters up to tetramers in size can be formed relatively easily by one- or two-patch particles. Pentamers need either farther reaching interactions and/or and two patches. Hexamers were only obtained in larger quantities for two-patch particles and in coexistence with other clusters. This suggests that larger clusters require more complex building blocks or very specific and/or directional interactions. Such interactions could also influence the accessibility and morphology of the cluster, which we have shown on tetramers with the morphology change from rhomboid to square geometry upon the increased interaction range.The simulated data fit our analytically derived theory, which suggests that the theory could be used to extrapolate, or predict data from experiments. The employed spherocylinder model was parametrized to mimic amphiphilic α-helices, and our results are in very good agreement with naturally found coiled-coils. However, our model is generic, so the findings are generally applicable to various assemblies of prolate-shaped patchy particles including functionalized nanotubes, rod-like viruses, or even macroscopic objects. Note that the one patch particles with patch sizes close to the structure boundaries of 60° and 120° can be used to switch between the aggregate structures.
Conflicts of interest
There are no conflicts to declare.Acknowledgements
This work was supported by the Czech Science Foundation (grant 14-12598S) and the CEITEC 2020 (LQ1601) project with financial contribution made by the Ministry of Education, Youths and Sports of the Czech Republic within special support from the National Programme for Sustainability II funds. Computational resources were provided by the CESNET LM2015042 and the CERIT Scientific Cloud LM2015085, provided under the programme “Projects of Large Research, Development, and Innovations Infrastructures”.References
- Q. Luo, C. Hou, Y. Bai, R. Wang and J. Liu, Chem. Rev., 2016, 116(22), 13571 CrossRef CAS PubMed.
- P. Pàmies, Nat. Mater., 2015, 14(4), 368 CrossRef PubMed.
- H. Gradišar, et al. , Nat. Chem. Biol., 2013, 9(6), 362 CrossRef PubMed.
- N. R. Zaccai, et al. , Nat. Chem. Biol., 2011, 7(12), 935 CrossRef CAS PubMed.
- G. W. Collie, et al. , Nat. Chem., 2015, 7(11), 871 CrossRef CAS PubMed.
- A. R. Thomson, et al. , Science, 2014, 346(6208), 485 CrossRef CAS PubMed.
- J. Liu, Q. Zheng, Y. Deng, C. S. Cheng, N. R. Kallenbach and M. Lu, Proc. Natl. Acad. Sci. U. S. A., 2006, 103(42), 15457 CrossRef CAS PubMed.
- S. C. McGrother, D. C. Williamson and G. Jackson, J. Chem. Phys., 1996, 104(17), 6755 CrossRef CAS.
- J. Zhao, S. Li, R. Zou and A. Yu, Soft Matter, 2012, 8(4), 1003 RSC.
- C. Y. Zhang, X. L. Jian and W. Lu, Soft Matter, 2015, 11(7), 1362 RSC.
- R. Vácha and D. Frenkel, Biophys. J., 2011, 101(6), 1432 CrossRef PubMed.
- N. S. Bieler, T. P. J. Knowles, D. Frenkel and R. Vácha, PLoS Comput. Biol., 2012, 8(10), e1002692 CAS.
- R. Vácha, S. Linse and M. Lund, J. Am. Chem. Soc., 2014, 136(33), 11776 CrossRef PubMed.
- I. Kabelka and R. Vácha, J. Chem. Phys., 2015, 143(24), 243115 CrossRef PubMed.
- P. Bolhuis and D. Frenkel, J. Chem. Phys., 1997, 106(2), 666 CrossRef CAS.
- M. P. Allen and D. J. Tildesley, Computer simulation of liquids, Clarendon Press, Oxford, 1987 Search PubMed.
- H. Shin and K. S. Schweizer, Soft Matter, 2014, 10(2), 262 RSC.
- Y. Iwashita and Y. Kimura, Soft Matter, 2013, 9(45), 10694 RSC.
- Y. Iwashita and Y. Kimura, Soft Matter, 2014, 10(37), 7170 RSC.
- C. S. Dias, N. A. M. Araújo and M. T. da Gama, Phys. Rev. E: Stat., Nonlinear, Soft Matter Phys., 2014, 90(3), 032302 CrossRef CAS PubMed.
- M. K. Gilson and K. K. Irikura, J. Phys. Chem. B, 2010, 114(49), 16304 CrossRef CAS PubMed.
- E. Moutevelis and D. N. Woolfson, J. Mol. Biol., 2009, 385(3), 726 CrossRef CAS PubMed.
- J. Ramos and T. Lazaridis, J. Am. Chem. Soc., 2006, 128(48), 15499 CrossRef CAS PubMed.
- G. Munao, Z. Preisler, T. Vissers, F. Smallenburg and F. Sciortino, Soft Matter, 2013, 9(9), 2652 RSC.
- Jordan M. Fletcher, et al. , Science, 2013, 340(6132), 595 CrossRef CAS PubMed.
- F. Romano and F. Sciortino, Phys. Rev. Lett., 2015, 114(7), 078104 CrossRef PubMed.
- F. Smallenburg, L. Leibler and F. Sciortino, Phys. Rev. Lett., 2013, 111(18), 188002 CrossRef PubMed.
Footnote |
| † Electronic supplementary information (ESI) available. See DOI: 10.1039/c7sm01384a |
| This journal is © The Royal Society of Chemistry 2017 |