
 Open Access Article
 This Open Access Article is licensed under a
 Creative Commons Attribution 3.0 Unported Licence
Structure of nanoscale-pitch helical phases: blue phase and twist-bend nematic phase resolved by resonant soft X-ray scattering†
Mirosław
Salamończyk
 ab,
Nataša
Vaupotič
*cd,
Damian
Pociecha
e,
Cheng
Wang
a,
Chenhui
Zhu
*a and
Ewa
Gorecka
*e
ab,
Nataša
Vaupotič
*cd,
Damian
Pociecha
e,
Cheng
Wang
a,
Chenhui
Zhu
*a and
Ewa
Gorecka
*e
aAdvanced Light Source, Lawrence Berkeley National Laboratory, Berkeley, CA 94720, USA. E-mail: chenhuizhu@lbl.gov
bLiquid Crystal Institute & Department of Physics, Kent State University, Kent, OH 44242, USA
cDepartment of Physics, Faculty of Natural Sciences and Mathematics, University of Maribor, Koroška 160, 2000 Maribor, Slovenia. E-mail: natasa.vaupotic@um.si
dJozef Stefan Institute, Jamova 39, 1000 Lubljana, Slovenia
eFaculty of Chemistry, University of Warsaw, Zwirki i Wigury 101, 02-089 Warsaw, Poland. E-mail: gorecka@chem.uw.edu.pl
First published on 18th August 2017
Abstract
Periodic structures of phases with orientational order of molecules but homogenous electron density distribution: a short pitch cholesteric phase, blue phase and twist-bend nematic phase, were probed by resonant soft X-ray scattering (RSoXS) at the carbon K-edge. The theoretical model shows that in the case of a simple heliconical nematic structure, two resonant signals corresponding to the full and half pitch band should be present, while only the full pitch band is observed experimentally. This suggests that the twist-bend nematic phase has a complex structure with a double-helix built of two interlocked, shifted helices. We confirm that the helical pitch in the twist-bend nematic phase is in a 10 nm range for both the chiral and achiral materials. We also show that the symmetry of the blue phase can be unambiguously determined through a resonant enhancement of the X-ray diffraction signals, by including polarization effects, which are found to be an important indicator in phase structure determination.
Nanostructured soft materials with hierarchical organization have recently attracted a lot of attention in both fundamental and application-based research; the examples of such systems can be found among liquid crystals, gels or structured polymers. The advantage of the chemical diversity of such materials, ranging from low weight molecules to polymers and nanoparticles, is that it enables intelligent material design by tuning of a particular material functional property, such as the electronic or optical energy band gap, polar or magnetic order, etc. Some of these materials may exhibit helical structures or helical morphology; the ‘classical’ examples of such systems are DNA and peptides, in which the helical arrangement of molecules is induced by the chirality of the molecular building blocks. A variety of helical structures formed by low weight molecules can be found among liquid crystals;1 chiral mesogenic molecules can self-assemble into helical nematic or smectic phases, in which molecules uniformly twist, or into a blue phase, a three-dimensional, nanoscale cubic phase formed of double twist cylinders, where each cylinder has an internal, nanoscale helical structure.1 Less frequent are examples of achiral mesogens (bent-core, dimers, etc.) that exhibit nanoscale helical structures:2 filaments made either from soft crystal layers3–5 or smectic membranes,6 as well as a helioconical nematic phase with an ultra-short, nanoscale helical pitch.7–14 These materials have recently attracted a lot of attention due to the rich physical phenomena related to spontaneous symmetry breaking. However, the origin of helix formation in achiral materials is still up for debate, partially due to a limited number of in situ, experimental probes of orientational order at submicron scale. For some soft matter phases, the orientational order of molecules is coupled to density modulations and, therefore, their structure can be revealed by standard X-ray diffraction, but the phases with a uniform electron density, such as nematic or blue phases, cannot be distinguished by this technique. The method that is sensitive to the spatial variation of the orientation of molecules at the nanoscale is resonant X-ray scattering, which has so far mainly been operated at the absorption edges of bromine, selenium and sulfur for studying the smectic C subphases to determine their secondary structure induced by the molecular orientation.15–18 Recently, resonant soft X-ray scattering at the carbon absorption K-edge has been applied to study phase separation in block copolymers,19,20 molecular orientation in solar cells,21 and the morphology of helical nanofilaments (B4 phase) made of bent-core mesogens.3
Here, we demonstrate that RSoXS in combination with theoretical modelling can be used to reveal a 3D structure of phases with uniform electron density and periodically modulated orientational order. Furthermore, we show that polarization analysis is very important in removing the remaining structural degeneracy. We apply the method to the blue phase (BP),22 chiral nematic (N*) and twist-bend nematic (NTB). The structure of all these phases (Fig. 1) is helical and the twist originates either from molecular chirality (N* and BP) or is caused by a unique, bent molecular geometry (NTB). The N* phase has a single twisted helical structure, with the average direction of the long molecular axes (director) lying in the direction perpendicular to the helix axis. The generally accepted model for the NTB phase is a single, uniform helix with the director precessing around the helix axis at some angle θ. For the bent molecules, the non-helical splay-bend nematic (NSB) phase was also predicted,23,24 in which modulation of the long molecular axis direction is constrained to the plane; however, so far, no clear experimental evidence for the NSB phase has been provided. In blue phases, the twist is induced in every direction perpendicular to the director, resulting in the so called double twist (DT) cylinder. Such DT cylinders cannot continuously fill the space, thus a 3D network of defects is formed with either the body centred (BPI, I4132 symmetry) or simple cubic (BPII, P4232 symmetry) structure. With elastic X-ray scattering, only diffused signals related to the short-range positional order are detected in all these phases. For the BP or N* phases having their helical pitch in the visible or near IR wavelength range, optical methods are used to determine the structure parameters. Here, we provide a direct, effective and general approach that can be applied to structures with periodicities below the optical wavelength, to which neither optical nor classical X-ray diffraction techniques are sensitive. By RSoXS, information about the molecular orientational order with periodicities of the order of a few to hundreds of nanometers can easily be obtained.
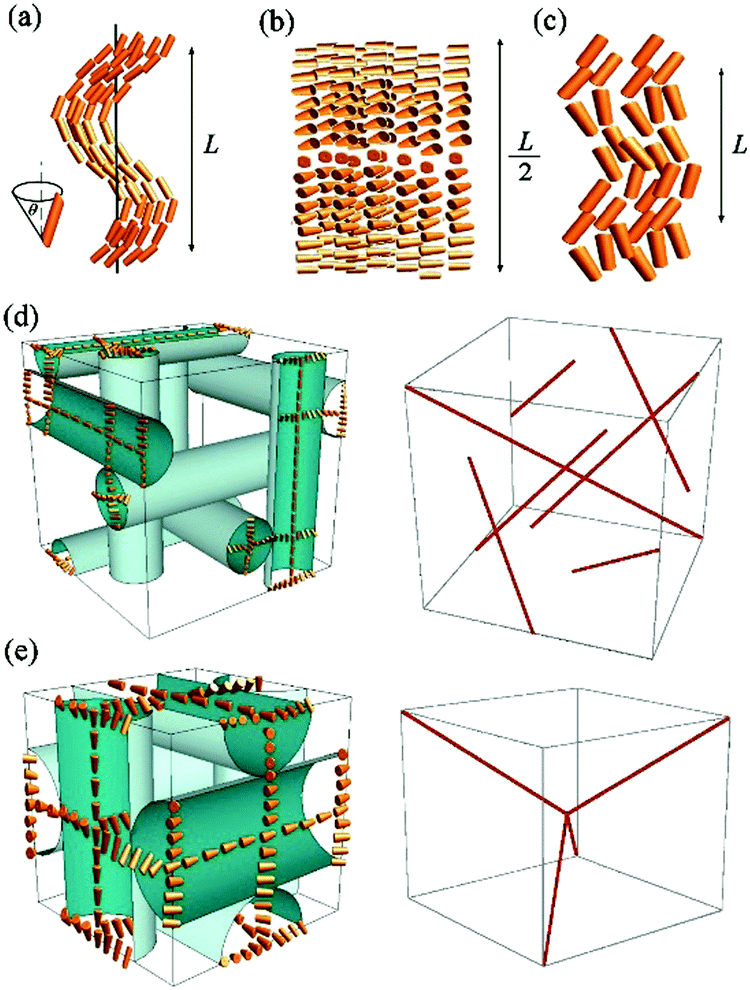 | ||
| Fig. 1 Structure of the (a) twist-bend nematic NTB, (b) chiral nematic N*, and (c) splay-bend nematic NSB phases. L is the modulation length. Double twisted cylinders (left) and the defect network (right) in blue phases (d) of type I (BPI) and (e) type II (BPII). | ||
We performed RSoXS measurements for a chiral SB314 material showing a N*–NTB phase sequence and a chiral AZO714,25 compound showing a BP–NTB phase sequence on cooling and a NTB–N*–BP phase sequence on heating (Fig. 2). The results were compared to those obtained for the achiral CB7CB dimeric compound, which is a model NTB material showing a N–NTB phase sequence.8–11,13
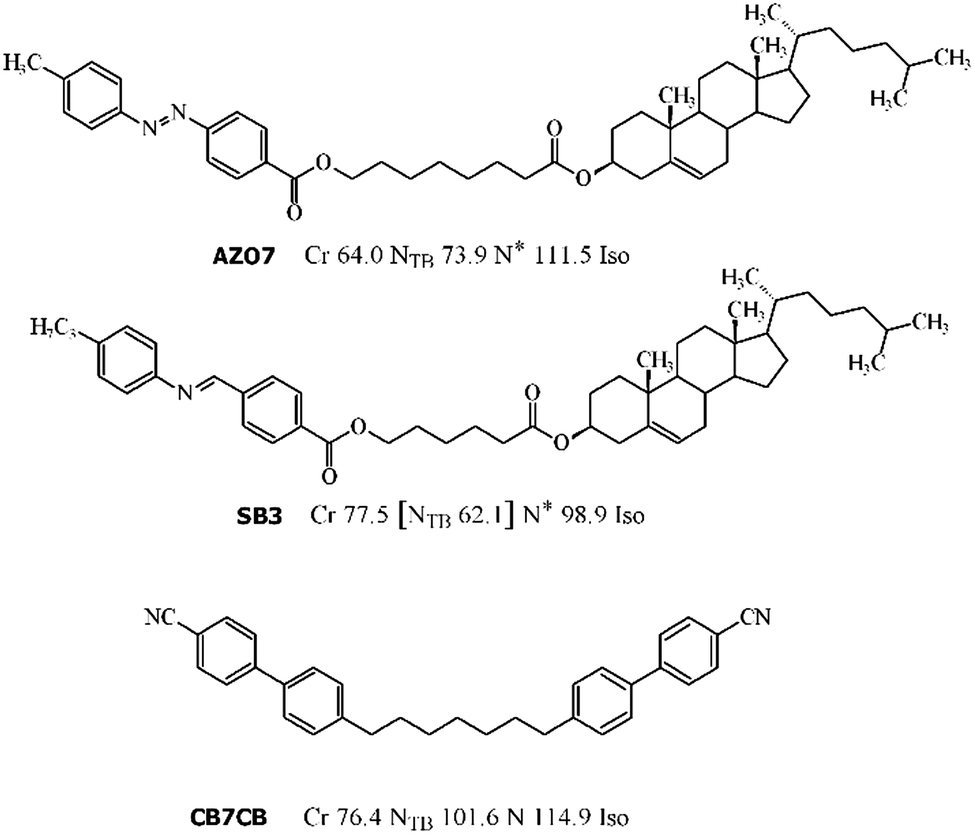 | ||
| Fig. 2 Molecular structure of the studied compounds AZO7, SB3 and CB7CB. For each compound, the phase sequence and phase transition temperature (°C) determined by differential scanning calorimetry (DSC) on heating scans are given. Note that for AZO7, a narrow range of a blue phase between the N* and Iso phase was found by microscopy observations; however, it was not recorded on the DSC curves due to limited resolution. Upon cooling the AZO7 samples, the blue phase was metastable down to the transition to the NTB phase and thus the cholesteric phase was not observed. | ||
When the chiral material, AZO7, is cooled from the isotropic phase, several RSoXS signals are obtained that can be indexed to the cubic structure (Fig. 3). On further cooling, the signals related to the cubic lattice disappear and a single peak corresponding to a much shorter periodicity appears, signifying a transition to the NTB phase. The position of the signal in the NTB phase is temperature dependent: on cooling, the periodicity reduces from 20.3 to 13.3 nm (see ESI,† Fig. S15). Interestingly, on subsequent heating, the sample undergoes a transition from the NTB to the N* phase, in which only one signal, corresponding to the half pitch band, is observed at 110 nm (Fig. 3). On further heating, the BP phase is observed only in a narrow temperature range of few degrees, close to the isotropic phase. Apparently, for this material, the BP phase is thermodynamically stable close to the clearing temperature but can easily be supercooled, similar to that observed previously for other dimeric materials.26
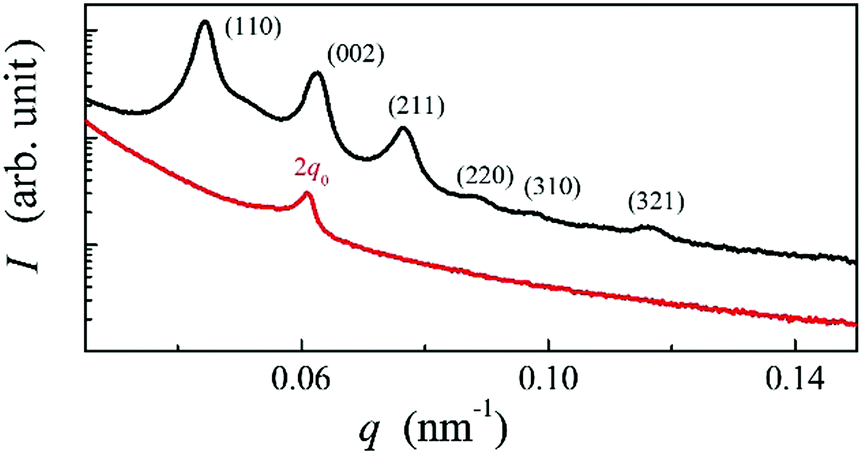 | ||
| Fig. 3 RSoXS patterns; the intensity (I) is in arbitrary units as a function of the magnitude of the scattering vector q for the AZO7 compound in the BPI (black line) and N* (red line) phase. | ||
Such a phase sequence enables a direct comparison between the cholesteric pitch and the size of the unit cell of the BP phase. Assuming that the helical pitch at the transition from the cholesteric to the BP phase does not change significantly, the unit cell size in the BPI phase (I4132 symmetry) should correspond to the full pitch length (L) in the N* phase and to the half pitch length (L/2) in the BPII phase (P4232 symmetry) (see Fig. 1). Because the first signal in the BP phase of AZO7 appears at a lower value of q than in the N* phase, the observed blue phase must have I4132 symmetry (BPI). From the position of the main signals observed in the RSoXS pattern of the cubic phase (peaks (110), (002) and (211)), the crystallographic lattice parameter (a) is obtained: a = 201 nm. Except for the (002) peak, the observed peaks are allowed by the symmetry, and they are thus resonantly enhanced. A comparison of the position of the purely resonant (002) signal in the BP phase and the half pitch band signal in the N* phase confirms that, within experimental error, the pitch in the BP phase does not change at the phase transition. In both the BPI and N* phase, the azimuthal position of the signals was strongly sensitive to the polarization of the incoming beam (Fig. 4b and c).
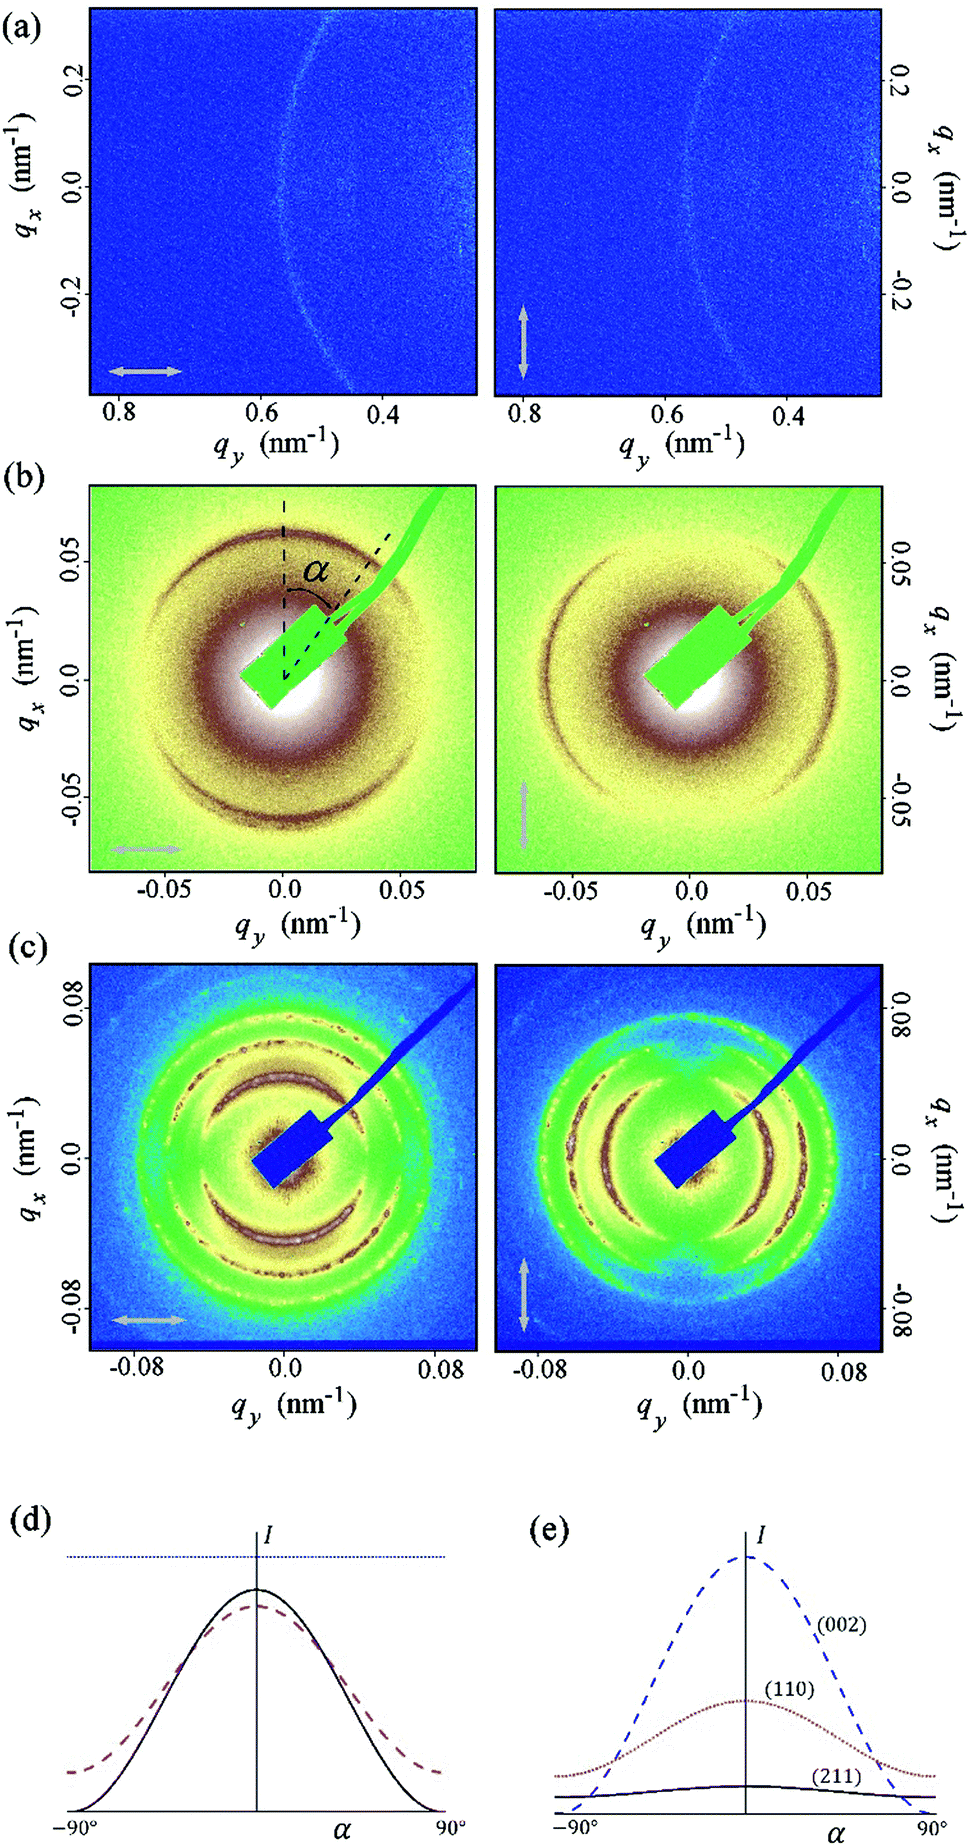 | ||
| Fig. 4 RSoXS patterns of the SB3 compound in NTB phase (a) and AZO7 compound in N* (b) and BPI (c) phases recorded for two perpendicular polarizations of the incident beam. (d) Theoretically calculated intensity in arbitrary units as a function of the azimuthal angle α; 2q0 peak in N* phase (black solid line); 2q0 (magenta dashed line) and q0 (blue dotted line) peak in NTB phase, both calculated at the cone angle θ = 10 deg. To present the results on the same graph, the intensity of the N* peak was divided by 10 and the intensity of the 2q0 peak in the NTB phase was multiplied by 100. (e) The intensities of the three most intensive peaks in the BPI phase. Parameter values: f1/f2 = 0.6, where f1, f2 and −(f1 + f2) are the eigenvalues of the local traceless dispersion correction to the form factor (see ESI†). | ||
For the SB3 material, on cooling, the resonant peak corresponding to the half pitch band (L/2 ≈ 112 nm) is detected in the N* phase temperature range (Fig. S10, ESI†). Upon the transition to the NTB phase, the signal corresponding to 11 nm develops. Interestingly, the periodicity detected by the RSoXS experiment in the NTB phase is much smaller than the one measured by the atomic force microscopy (AFM) method, where a fingerprint texture with lines separated by 50–80 nm was observed.25 The short pitch periodic structure detected by the resonant X-ray method is in line with a large compressibility modulus measured previously.25 Despite many efforts, the long periodicity detected by the AFM measurements (see ESI,† Fig. S13) was not observed by the RSoXS method. It is not obvious, at the moment, what caused the large periodicity structure detected by AFM, but one possibility is that the surface free samples, studied by AFM, have an additional structure induced by chirality, and the surfaces cause its destabilization when a thin cell (∼0.5 μm thick) is used in the X-ray studies reported here. The RSoXS measurements were also repeated for CB7CB, the model NTB material.27 For this compound the resonant peak was also found in the crystal phase: the signal corresponding to the periodicity of 7.8 nm gives the full size of the crystallographic unit cell and corresponds roughly to three molecular distances. Such a signal is forbidden for the P3121 symmetry (the crystal structure was resolved for the CB9CB homologue28) and is thus not observed in the elastic diffraction experiments. The melting of the crystal and the transition to the NTB phase is associated with a sudden jump of the peak position to 8.2 nm (Fig. 5). This clearly shows that the structures of the crystal and NTB phases are closely related and are probably caused by steric interactions28,29 rather than by the elastic24 or flexoelectric23,29–31 effect.
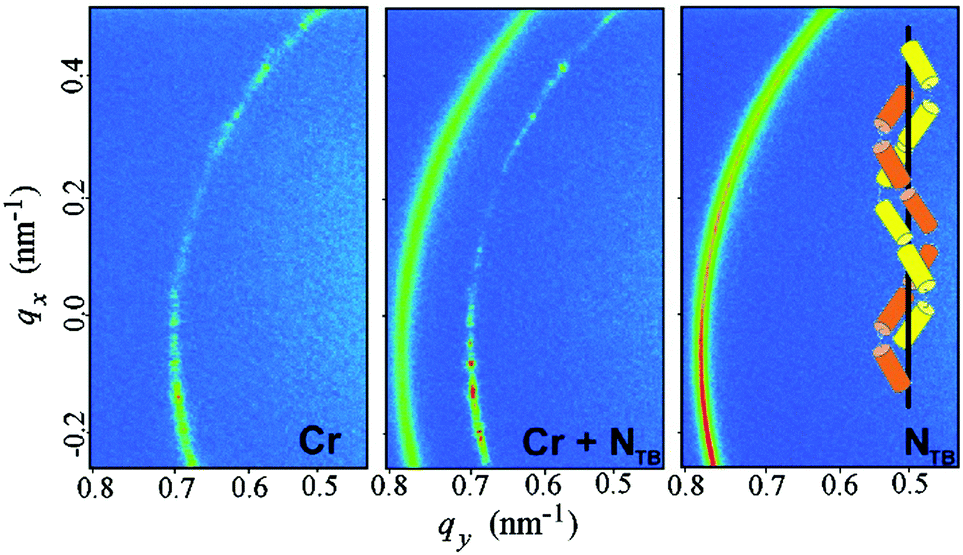 | ||
| Fig. 5 Two dimensional RSoXS patterns for the CB7CB compound in the crystalline (Cr) and twist-bend nematic (NTB) phase and in the temperature range of phase coexistence. The observed signals correspond to the periodicities of 7.8 nm in Cr and 8.2 nm in the NTB phase. In the inset – a simplified model of the NTB phase structure with two interlocked, mutually shifted helices. | ||
Interestingly, the scattering patterns of the N* and BP phases show strong intensity anisotropy, but that of the NTB phase does not. To fully understand the resonant X-ray diffraction pattern, one has to calculate the dispersion correction to the structure factor, which is proportional to the Fourier transform of the spatially dependent structure polarizability.32,33 We obtained the dispersion correction for the LC phases, as shown in Fig. 1, and found the scattered intensity as a function of the polarization direction of the incident beam and biaxiality of the X-ray susceptibility.
Details of the calculations are given in the ESI;† here, we give only the main results. In the N* phase, only the half pitch peak at 2q0 is expected, where q0 = 2π/L is the magnitude of the wave vector of the helical structure and L is the helical pitch. In the N* phase, the 2q0 signal intensity is very sensitive to polarization of the incident X-ray beam, as expected, because the beam with the electric field polarized perpendicular to the helix detects the highest contrast in the director modulation, while the beam polarized along the helix axis detects the uniform structure of the short molecular axes. As a result, for a powder sample in which the helix axis directions are randomly distributed in space, a 2D scattering pattern exhibits anisotropy for the linearly polarized incident X-ray beam. Two complementary parts of the diffraction ring are predicted in the diffraction pattern, if the polarization of the incident beam is rotated by 90 deg. For the NTB and NSB phases, the model predicts two signals, at q0 and 2q0. Interestingly, the q0 and 2q0 signals have a different sensitivity to the polarization of the X-ray beam; the q0 signal is invariant to the polarization direction while for the 2q0 signal in the NTB phase, the dependence is similar to the one observed in the N* phase (ESI,† Fig. S3). Experimentally, only one peak has been found in the NTB phase, which shows no intensity anisotropy, suggesting that the peak is the q0 signal, corresponding to a 360 deg rotation of the molecular director around the helical axis. It should be pointed out that for all of the NTB materials studied so far, the signal corresponding to a half pitch band (2q0) has not been detected. Previous RSoXS experiments at the carbon K-edge on CB7CB,27 as well as measurements performed using X-ray scattering at the selenium K-edge,34 also show a systematic lack of the 2q0 signal in the NTB phase. When analysing the reasons for the lack of the 2q0 signal, let us first point out that the intensity of the 2q0 peak can be much lower than the intensity of the q0 peak, as shown by the theoretical calculations in the ESI.† The ratio of the intensities of these two peaks depends on the ratio of the eigenvalues of the anisotropic part of the molecular polarizability. If this ratio is close to 1, the intensity of the 2q0 peak can be negligibly small (see Fig. S4b in the ESI†). However, based on the measurements performed in the blue phase of a material that also exhibited the NTB phase (AZO7), the ratio between the eigenvalues seemed to be significantly different from 1, and in this material, the intensity of the 2q0 peak in the NTB phase should be comparable to the intensity of the q0 peak. Other possible reasons for the suppression of the 2q0 peak are thermal fluctuations (the Debye–Waller effect), self-absorption and a finite correlation length for helical modulations. If we assume that the amplitude of the thermally induced displacement of helical pitch is lower than 10% of the pitch length, the decrease in intensity of the 2q0 peak compared to the q0 peak would not be more than approximately 30%. Self-absorption in a thin cell and at this angle range would reduce the signal intensity proportionally to the increased optical path length, i.e., by a few %. The effect of the limited correlation length can be excluded as the width of the q0 signal is comparable to the machine resolution, denoting a long-range order. Because of the systematic lack of the 2q0 peak in all the materials studied so far,27,34 we thus propose a more fundamental reason for the absence of the 2q0 signal. We suggest that the structure is actually made of two interlocked helices, which are mutually shifted (Fig. 5). The calculations show that the 2q0 peak is cancelled out for the shift between helices equal to L/4. The shift can be induced by short-range interactions of dimers that favour a local intercalated arrangement of the neighbouring molecules,29 which seems to be quite common for dimeric molecules.34 The tendency for the formation of interlocked helices is probably general for bent dimers, as the crystal structure of the CB9CB homologue28 is also formed of interlocked and shifted helices, which are made of two types of slightly different molecular conformers. Very recently, a duplex double-helical molecular chain was proposed as a building motif of the NTB phase by the Boulder group.35
For the blue phases formed of double twist cylinders, we calculated the positions of the elastic diffraction peaks by building up the structure from infinitely long cylinders. The Fourier transform of the cubic lattice filled with cylinders of a finite width and uniform density formally gives (hkl) diffraction signals if at least one of the Miller indices, h, k or l, is zero (ESI,† Table S1). However, because the cylinders are in contact, the density of the unit cell is practically uniform and none of these peaks is observed in the elastic scattering. If the electron density in the defect regions between the cylinders is different than in the cylinders (Fig. 1), the signals allowed by the P4232 (BPII) or I4132 (BPI) symmetry should be detected. In practice, none of these signals is found by elastic X-ray scattering, confirming that the electron density difference between the cylinders and defect regions is negligible. In order to include the resonant effects, the dispersion correction was calculated due to the helical spatial variation of the director in the direction perpendicular to the cylinder axis and by arranging the cylinders into a proper cubic lattice (Fig. 1). We show that some signals allowed by the symmetry of the BP phases, but not detectable by elastic X-ray diffraction, become visible in resonant X-ray diffraction due to their enhancement by orientation modulations (Table 1). Additionally, purely resonant signals: (001) for P4232 and (002) for I4132, are predicted.
| (hkl) | (001) | (110) | (111) | (002) | (210) | (211) | (220) |
|---|---|---|---|---|---|---|---|
| BPII | ✓ | ✓ | ✓ | ✓ | ✓ | ✓ | ✓ |
| BPI | ✗ | ✓ | ✗ | ✓ | ✗ | ✓ | ✓ |
| (hkl) | (221) | (310) | (311) | (222) | (320) | (321) |
|---|---|---|---|---|---|---|
| BPII | ✓ | ✓ | ✓ | ✗ | ✓ | ✓ |
| BPI | ✗ | ✗ | ✗ | ✓ | ✗ | ✓ |
In the BPI phase, the intensities of all the signals are sensitive to the polarization of the incident X-ray beam. For a powder sample, the two most intensive signals, (110) and (002), have the same polarization dependence as the half pitch band signal in the N* phase and the complementary parts of the diffraction rings are predicted for the incident beams polarized in perpendicular directions. The polarization dependence of the (211) signal is defined by the biaxiality of the susceptibility. For strongly biaxial molecules, such as bent dimers, the dependence is similar to that observed for the (110) and (002) signals.
Conclusions
We have shown that comparison between the RSoXS signals in the blue phases and N* phase enables a straightforward determination of the type of the blue phase. We have also shown that the modulation pitch in the NTB phase is of the same order of magnitude for both chiral and achiral materials. However, the structure of the twist-bend nematic phase seems to be more complex than commonly accepted. The theoretical model shows that, in the case of the heliconical structure, RSoXS signals corresponding to the full and half pitch band should both be present and they should have a very different polarization dependence. Experimentally, only one signal was found, with the intensity independent of the beam polarization; it was thus unambiguously identified as the full pitch band. The lack of the half pitch band strongly suggests that the NTB structure is made of two interlocked and shifted helices.Conflicts of interest
There are no conflicts of interest to declare.Acknowledgements
MS acknowledges the support of the U.S. National Science Foundation I2CAM International Materials Institute Award, Grant DMR-1411344 and NSF grant DMR-1307674. NV acknowledges the financial support from the Slovenian Research Agency (research core funding no. P1-0055). EG and DP acknowledge the support of the National Science Centre (Poland) under grant no. 2016/22/A/ST5/00319. The authors acknowledge the important technical help and discussions from Dr A. Kilcoyne, Dr M. Brady, Dr G. Su and Dr A. Hexemer at the ALS LBNL and the synthesis of the studied materials by A. Zep. The beam line 11.0.1.2 at the Advanced Light Source is supported by the Director of the Office of Science, Office of Basic Energy Sciences, of the U.S. Department of Energy under Contract No. DE-AC02-05CH11231. The authors thank the referees for the fruitful discussion through the refereeing process regarding both the theoretical model and interpretation of experimental results.Notes and references
- Chirality in Liquid Crystals, ed. H. Kitzerow and C. Bahr, Springer-Verlag, New York, 2001 Search PubMed.
- C. Tschierske and G. Ungar, ChemPhysChem, 2016, 17, 9–26 CrossRef CAS PubMed.
- C. Zhu, C. Wang, A. Young, F. Liu, I. Gunkel, D. Chen, D. Walba, J. Maclennan, N. A. Clark and A. Hexemer, Nano Lett., 2015, 15, 3420–3424 CrossRef CAS PubMed.
- L. E. Hough, H. T. Jung, D. Krüerke, M. S. Heberling, M. Nakata, C. D. Jones, D. Chen, D. R. Link, J. Zasadzinski, G. Heppke, J. P. Rabe, W. Stocker, E. Körblova, D. M. Walba, M. A. Glaser and N. A. Clark, Science, 2009, 325, 456–460 CrossRef CAS PubMed.
- J. Matraszek, N. Topnani, N. Vaupotič, H. Takezoe, J. Mieczkowski, D. Pociecha and E. Gorecka, Angew. Chem., Int. Ed., 2016, 55, 3468–3472 CrossRef CAS PubMed.
- L. E. Hough, M. Spannuth, M. Nakata, D. A. Coleman, C. D. Jones, G. Dantlgraber and N. A. Clark, Science, 2009, 325, 452–456 CrossRef CAS PubMed.
- G. Pelzl, A. Eremin, S. Diele, H. Kresse and W. Weisflog, J. Mater. Chem., 2002, 12, 2591–2593 RSC.
- M. Cestari, S. Diez-Berart, D. A. Dunmur, A. Ferrarini, M. R. de la Fuente, D. J. B. Jackson, D. O. Lopez, G. R. Luckhurst, M. A. Perez-Jubindo, R. M. Richardson, J. Salud, B. A. Timimi and H. Zimmermann, Phys. Rev. E: Stat., Nonlinear, Soft Matter Phys., 2011, 84, 031704 CrossRef CAS PubMed.
- C. Meyer, G. R. Luckhurst and I. Dozov, Phys. Rev. Lett., 2013, 111, 067801 CrossRef CAS PubMed.
- D. Chen, J. H. Porada, J. B. Hooper, A. Klittnick, Y. Shen, M. R. Tuchband, E. Korblova, D. Bedrov, D. M. Walba, M. A. Glaser, J. E. Maclennan and N. A. Clark, Proc. Natl. Acad. Sci. U. S. A., 2013, 110, 15931–15936 CrossRef CAS PubMed.
- V. Borshch, Y.-K. Kim, J. Xiang, M. Gao, A. Jakli, V. P. Panov, J. K. Vij, C. T. Imrie, M. G. Tamba, G. H. Mehl and O. D. Lavrentovich, Nat. Commun., 2013, 4, 1–8 Search PubMed.
- D. Chen, M. Nakata, R. Shao, M. R. Tuchband, M. Shuai, U. Baumeister, W. Weissflog, D. M. Walba, M. A. Glaser, J. E. Maclennan and N. A. Clark, Phys. Rev. E: Stat., Nonlinear, Soft Matter Phys., 2014, 89, 022506 CrossRef PubMed.
- E. Górecka, M. Salamończyk, A. Zep, D. Pociecha, C. Welch, Z. Ahmed and G. H. Mehl, Liq. Cryst., 2015, 42, 1–7 CrossRef.
- A. Zep, S. Aya, K. Aihara, K. Ema, D. Pociecha, K. Madrak, P. Bernatowicz, H. Takezoe and E. Gorecka, J. Mater. Chem. C, 2013, 1, 46 RSC.
- P. Mach, R. Pindak, A.-M. Levelut, P. Barois, H. Nguyen, C. Huang and L. Furenlid, Phys. Rev. Lett., 1998, 81, 1015–1018 CrossRef CAS.
- P. Fernandes, P. Barois, S. T. Wang, Z. Q. Liu, B. K. McCoy, C. C. Huang, R. Pindak, W. Caliebe and H. T. Nguyen, Phys. Rev. Lett., 2007, 99, 1–4 CrossRef PubMed.
- C. L. Folcia, J. Ortega, J. Etxebarria, S. Rodríguez-Conde, G. Sanz-Enguita, K. Geese, C. Tschierske, V. Ponsinet, P. Barois, R. Pindak, L.-D. Pan, Z. Q. Liu, B. K. McCoy and C. C. Huang, Soft Matter, 2014, 10, 196–205 RSC.
- H. F. Gleeson and L. S. Hirst, ChemPhysChem, 2006, 7, 321–328 CrossRef CAS PubMed.
- C. Wang, D. H. Lee, A. Hexemer, M. I. Kim, W. Zhao, H. Hasegawa, H. Ade and T. P. Russell, Nano Lett., 2011, 11, 3906–3911 CrossRef CAS PubMed.
- J. M. Virgili, Y. F. Tao, J. B. Kortright, N. P. Balsara and R. a. Segalman, Macromolecules, 2007, 40, 2092–2099 CrossRef CAS.
- J. R. Tumbleston, B. a. Collins, L. Yang, A. C. Stuart, E. Gann, W. Ma, W. You and H. Ade, Nat. Photonics, 2014, 8, 385–391 CrossRef CAS.
- D. C. Wright and N. D. Mermin, Rev. Mod. Phys., 1989, 61, 385–432 CrossRef CAS.
- R. B. Meyer, in Structural Problems in Liquid Crystal Physics, ed. R. Balian and G. Weil, Les Houches Summer School in Theoretical Physics, 1973 Search PubMed; R. B. Meyer, Molecular Fluids, Gordon and Breach, New York, 1976, pp. 273–373 Search PubMed.
- I. Dozov, Europhys. Lett., 2007, 56, 247–253 CrossRef.
- E. Gorecka, N. Vaupotič, A. Zep, D. Pociecha, J. Yoshioka, J. Yamamoto and H. Takezoe, Angew. Chem., Int. Ed., 2015, 54, 10155–10159 CrossRef CAS PubMed.
- H. J. Coles and M. N. Pivnenko, Nature, 2005, 436, 997–1000 CrossRef CAS PubMed.
- C. Zhu, M. R. Tuchband, A. Young, M. Shuai, A. Scarbrough, D. M. Walba, J. E. Maclennan, C. Wang, A. Hexemer and N. A. Clark, Phys. Rev. Lett., 2016, 116, 147803 CrossRef PubMed.
- K. Hori, M. Iimuro, A. Nakao and H. Toriumi, J. Mol. Struct., 2004, 699, 23–29 CrossRef CAS.
- N. Vaupotič, S. Curk, M. A. Osipov, M. Čepič, H. Takezoe and E. Gorecka, Phys. Rev. E: Stat., Nonlinear, Soft Matter Phys., 2016, 93, 22704 CrossRef PubMed.
- S. M. Shamid, S. Dhakal and J. V. Selinger, Phys. Rev. E: Stat., Nonlinear, Soft Matter Phys., 2013, 87, 052503 CrossRef PubMed.
- N. Vaupotič, M. Čepič, M. A. Osipov and E. Gorecka, Phys. Rev. E: Stat., Nonlinear, Soft Matter Phys., 2014, 89, 030501(R) CrossRef PubMed.
- D. H. Templeton and L. K. Templeton, Acta Crystallogr., Sect. A: Cryst. Phys., Diffr., Theor. Gen. Crystallogr., 1980, 36, 237–241 CrossRef.
- V. E. Dmitrienko, Acta Crystallogr., Sect. A: Cryst. Phys., Diffr., Theor. Gen. Crystallogr., 1983, 39, 29–35 CrossRef.
- W. D. Stevenson, Z. Ahmed, X. B. Zeng, C. Welch, G. Ungar and G. H. Mehl, 2016, arXiv:1612.01180.
- M. R. Tuchband, M. Shuai, K. A. Graber, D. Chen, C. Zhu, L. Radzihovsky, A. Klittnick, L. M. Foley, A. Scarbrough, J. H. Porada, M. Moran, J. Yelk, D. Bedrov, E. Korblova, D. M. Walba, A. Hexemer, J. E. Maclennan, M. A. Glaser and N. A. Clark, 2017, arXiv:1703.10787.
Footnote |
| † Electronic supplementary information (ESI) available: Details of the theoretical model, materials, experimental methods and additional results. See DOI: 10.1039/c7sm00967d |
| This journal is © The Royal Society of Chemistry 2017 |