 Open Access Article
Creative Commons Attribution 3.0 Unported Licence
Diverse configurations of columnar liquid crystals in cylindrical nano- and micropores†
Rui-bin
Zhang
ab,
Goran
Ungar
 *ab,
Xiangbing
Zeng
 b and
Zhihao
Shen
 c
c
aDepartment of Physics, Zhejiang Sci-Tech University, Xiasha College Park, Hangzhou 310018, China. E-mail: g.ungar@zstu.edu.cn
bDepartment of Materials Science and Engineering, University of Sheffield, Sheffield S1 3JD, UK. E-mail: g.ungar@sheffield.ac.uk
cKey Laboratory of Polymer Chemistry and Physics of Ministry of Education, Center for Soft Matter Science and Engineering, and College of Chemistry and Molecular Engineering, Peking University, Beijing 100871, China
First published on 26th May 2017
Abstract
Using 2D X-ray diffraction and AFM we studied the configuration, in cylindrical confinement, of hexagonal columnar phases that anchor homeotropically, i.e. with the columns normal to the pore wall. A wide range of pore diameters, from 20 nm to 100 μm, were explored by employing anodic alumina membranes and glass capillaries. The compounds used were a small discotic, hexakis(hexyloxy)triphenylene (HAT6), a large discotic hexa-peri-hexabenzocoronene (HBC), and a T-shaped bolaamphiphile, forming a honeycomb-type columnar phase. It was found that in pores up to tens of μm in diameter the columns adopt the “logpile” configuration with parallel columns crossing the pore perpendicular to its axis. Starting with 20 nm pores, with increasing pore diameter up to 5 different configurations are observed, the sequence being the same for all three compounds in spite of their structural diversity. One of the {100} planes of the hexagonal logpile starts from being parallel to the pore axis, then rotates by 90° as the pore size increases, and eventually becomes tilted to the pore axis by (8.5 ± 1)° as the pore widens further. Finally, in glass capillaries of tens of μm and beyond, the columns become axially oriented, parallel to the capillary axis. This latter finding was particularly unexpected as common sense would suggest axial columns to be favoured by planar anchoring, where in fact, it was shown to be hard to achieve. The present findings should help in the design of low-dimensional semiconductor or ionic conductor devices based on oriented columnar phases.
Introduction
Liquid crystals (LCs) confined in spherical and cylindrical geometries have attracted much interest because of the richness of physical phenomena displayed, particularly the intriguing topologies, and because of existing and potential applications, such as in polymer-dispersed LC panels, LC aerogels, photonic crystals, waveguides, etc.1,2 Due to the large specific interface area, micro- and nanoconfined LCs experience strong distortion and interfacial interaction, which profoundly affect their ordering and orientation. In contrast to the case of nematic and smectic phases of rod-like mesogens, there have been relatively few studies concerning the effects of confinement on columnar LC phases, i.e. phases with a 2D long-range order. Molecular columns, particularly those of aromatic discotic molecules forming stacks with overlapping π-orbitals, are of considerable interest as 1-D semiconductors for sensing, light harvesting or emission, and for molecular electronic components.3–7 Achieving desired orientation of such functional materials is vital, and nanoconfinement is one method of achieving it. For example, after dissolving the template, individual molecular wires could be prepared, having a particular molecular orientation.8Steinhart and co-workers9–12 studied the orientation of discotic liquid crystals in nanoporous anodic aluminium oxide (AAO) templates based on θ/2θ X-ray diffraction (XRD) scans and proposed a core–shell configuration in which columns are homeotropic (perpendicular) at the wall and axial close to the centre. However, the information obtained by a 1D θ/2θ scan is limited, and 2D13 or even 3D14 diffraction patterns give more reliable information. Later studies by others involving neutron scattering,15 optical polarimetry16 and dielectric studies17 suggested that the LC columns are perpendicular to the pore axis and may be in radial configuration. In certain aspects these observations are in agreement with our own previous study on the homeotropic honeycomb-type columnar phase formed by a T-shaped bolaamphiphile.14 However, we have shown that the columns arrange in parallel stacks (“logpiles”) stretching straight across the pore rather than orienting radially, and bend and splay only very close to the wall. Our other previous studies also showed that the type of surface anchoring is crucial for determining the configuration of the columns;18 circular orientation and, in exceptional cases, axial orientation were observed for columns with planar (i.e. parallel to the surface) anchoring.
The aim of this study is to clarify the general orientation behaviour of confined columnar phases under homeotropic anchoring conditions. In addition to bolaamphiphiles, we study two classic discotic compounds, a small and the other a large aromatic disk. By exploring cylindrical pores over a very wide range of diameters, from 20 nm to 150 μm, we show that even if the LCs are very different in nature, the arrangement of their columnar phase follows a surprisingly similar pattern with increasing pore size in almost every detail, with several configurational transitions along the way.
Experimental section
Materials
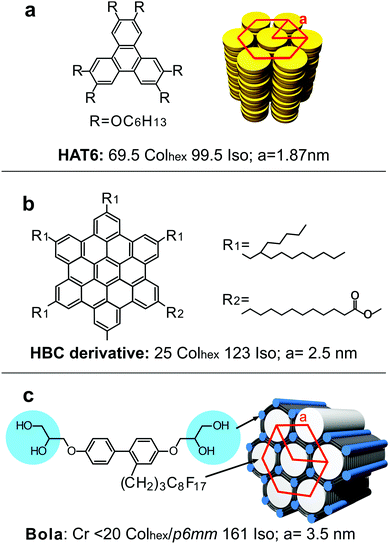
The three compounds used in this work are shown in Fig. 1, together with their transition temperatures. The synthesis is described elsewhere: HAT6,19HBC,20 and Bola.21 The small and large core discotics are 2,3,6,7,10,11-hexakis(hexyloxy)triphenylene (HAT6) (Fig. 1a) and a hexa-peri-hexabenzocoronene (HBC) derivative (Fig. 1b). They both form the hexagonal columnar (Colhex) phase. The bolaamphiphile (Bola) is a T-shaped molecule with a rod-like biphenyl core having a H-bonding glycerol group at each end and with a semiperfluorinated alkyl side-chain (Fig. 1c). Bola forms a hexagonal honeycomb where the biphenyl walls are connected at the edges by glycerol H-bonded columns (blue columns); the cells are filled with the side-chains (white columns). Compound HBC was synthesised at Peking University in the group of Z.S. Compound HAT6 was kindly provided by Prof. Richard Bushby of Leeds University, and the bolaamphiphile compound Bola by Prof. Carsten Tschierske of University of Halle.Preparation of confined LCs
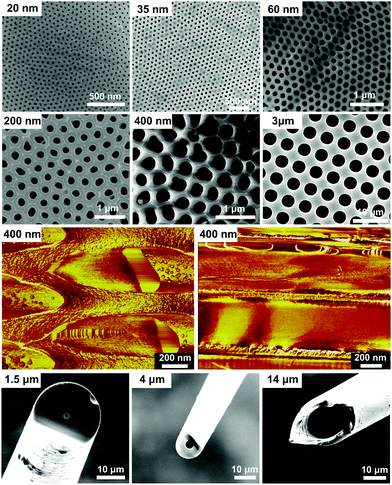
For nanoscale confinement, ordered porous AAO membranes with pore diameters of 20, 35, 60, 200 and 400 nm and a pore depth of 100 μm were used. The membranes were prepared according to the procedures reported elsewhere,22 and were kindly provided by Dr Kyusoon Shin of Dongjin Semichem Co., South Korea. The pores were circular and the diameter varied by approximately ±10%, as determined by SEM (Fig. 2, 1st and 2nd row) and by AFM of cracked membranes (Fig. 2, 3rd row). The 50, 100 and 150 μm ID glass capillaries were purchased from CM Scientific Ltd, while thinner ones were produced by pulling the 50 μm capillaries. Silicon wafer with 3 μm circular pores was fabricated by deep reactive ion etching (DRIE) using the Bosch method, and was donated by Prof. Qinghui Jin of Shanghai Institute of Microsystem and Information Technology. The infiltration of the sample was performed from the melt. All samples were slowly cooled from isotropic temperature into the columnar phase at 0.1 K min−1 before further investigation.2-D X-ray diffraction
The 2D X-ray diffraction patterns were recorded using an X-ray system consisting of a Rigaku MicroMax 007 micro-focus copper rotating anode generator running at 40 kV, 20 mA and confocal multilayer optics. The AAO plate was mounted vertically on a motorized 3-axis goniometer and rotated about the vertical axis (see Fig. 3). The temperature was controlled using an Oxford Cryosystems Cryostream 700 jet. The detector was a MarResearch MAR345 image plate system. 2D X-ray diffraction patterns at different rotation angles Φ were recorded. The capillaries with the samples were mounted horizontally and perpendicular to the incident beam. The capillary tubes were well aligned so that their long axis was co-linear with the rotation axis of the goniometer. Capillaries were rotated around their long axis and diffraction patterns were taken at different rotation angles α, as well as at different displacements x of the capillary along its axis.Determination of coherence length
For the coherence length measurement, X-ray diffraction was carried out using the synchrotron beam at station I22, diamond light source. The coherence length ξ of HAT6 in 35 and 60 nm pores was calculated using the Scherrer equation after instrumental broadening was corrected. The detailed description is in the first section of the ESI.†Microscopy
An Olympus BX-50 transmitted-light polarizing microscope equipped with a Mettler FP82 hotstage and a Coolsnap-Pro digital camera was used to observe the texture of the LCs. Tapping mode AFM imaging was performed at 40 °C on a Cypher ES AFM, Asylum Research – Oxford Instruments.Results and discussion
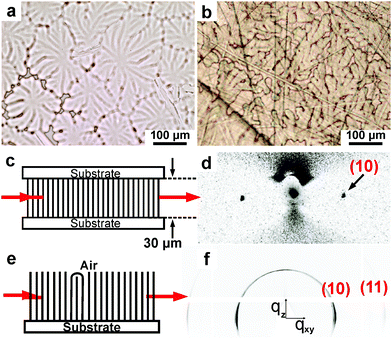
The anchoring manner of these columnar phases on both glass and flat oxidisedaluminium substrates was determined by polarized optical microscopy and grazing incidence small angle X-ray scattering (GISAXS). All compounds show a non-birefringent dendritic texture on both types of substrates (see Fig. 4a and b), which indicates homeotropic anchoring of the LC columns. In the experiment depicted in Fig. 4c the X-ray beam was applied along a film of Bola sandwiched between two surface-oxidized Si wafers. Fig. 4d shows two sharp (100) diffraction spots created by the evanescent X-ray wave travelling along the film surface. Their equatorial location confirms that the columns were well oriented perpendicular to the surface. For Bola on the aluminium plate, all Bragg reflections have their maximum intensity on the equator, consistent with the homeotropic alignment. The low-intensity azimuthal spread is likely to come from “tumbling” defects at the LC-air interface (Fig. 4e; see also note on intensity weighting in Fig. 4 legend).HAT6
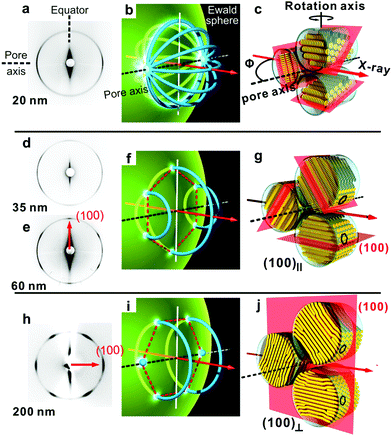
The dominant {100} reflections of the hexagonal columnar phase of HAT6 correspond to a {100} d-spacing of 16.2 Å. While the {001} peaks represent the intra-columnar disc-to-disc spacing of 3.41 Å. For the template sample with a 20 nm pore diameter, the intensity is spread uniformly around the {100} small-angle diffraction ring when Φ ≅ 0, i.e. when the beam is parallel to the nanopore axis (the diffraction pattern is not shown). This is because the {100} ring in reciprocal space touches the Ewald sphere of diffraction uniformly as the axis of the ring coincides with the X-ray beam. However, when Φ increases to 80°, the intensity increases near the meridian (horizontal), as shown in Fig. 5a (the meridian and the equator are defined here as parallel and perpendicular to the long axis of the nanopores). The corresponding reciprocal space, actually drawn for Φ = 90°, is shown in Fig. 5b. We did not record diffraction for Φ = 90° because of the problems with the absorption of X-rays in the AAO plate. On the equator (top and bottom of the ring in Fig. 5a) the diffraction intensity comes only from the reciprocal ring tangential to the Ewald sphere, which in turn comes from those pores in which the columns happen to lie parallel to the X-ray beam. In the model where columns traverse the AAO pores perpendicular to the pore axis but in a different direction in each pore (Fig. 5c), each pore contributes a meridional {100} ring in reciprocal space. As all meridians meet at the poles, ignoring absorption effects, the highest diffraction intensity would thus be seen if the Ewald sphere was cutting through the poles, which would occur at Φ = 90°. In our case, since Φ is 80°, the Ewald sphere crosses the {100} rings near, but not at the poles. Still where it does cross the maximum number of rings the intensity is highest, and that is on the horizontal (meridional) line in Fig. 5a. Note that in the current discussion, we treat the Ewald sphere as being locally flat, a reasonable approximation for low-angle diffraction.As already mentioned, we apply a model where columns traverse the pores normal to the pore axis but in different directions in different pores, as drawn in Fig. 5c. This “logpile” model14 is related to the planar polar model in cylindrically confined nematic LCs,23,24 but without any significant splay. Considering that surface anchoring is homeotropic, the only alternative model, also consistent with the observed diffraction patterns, has the columns spreading radialy from the centre of each pore. It will be shown below that the logpile rather than the radial model is the correct one.
It is also important to note here that in the template with the narrowest 20 nm pores the xy plane of the hexagonal lattice in different pores is oriented randomly about the column axis (Fig. 5c). That is, while the columns are perpendicular to the pore axis, there is no preference for any [hk0] direction of the hexagonal lattice to lie parallel to that axis.
For the 35 nm template, six azimuthally spread intensity maxima show up (Fig. 5d), which indicates that the xy plane, or the (001) plane, of the hexagonal lattice of the columnar phase becomes slightly oriented, with one of the {100} plane sets preferentially parallel to the long axis of the pore ((100)∥ orientation). In 60 nm pores the (100)∥ orientation becomes more pronounced (Fig. 5e). The preferred orientation of a lattice plane means that each reciprocal space ring in Fig. 5b condenses into six spots which, after cylindrical averaging around the pore axis, join up into three rings, as shown in Fig. 5f. They are then intersected by the Ewald sphere in six points, producing the six maxima in Fig. 5e. We shall refer to the establishment of the (100)∥ orientation, occurring between the pore diameters of 20 and 35 nm, as the orientational transition I.
One method to distinguish between the radial and logpile arrangement of the columns is to compare the size of ordered domains of the hexagonal lattice. Using the Scherrer equation, and after instrumental broadening had been deconvoluted (ESI,† Section S1), the size of coherently diffracting domains (ξ) in the tangential direction for the 35 and 60 nm samples was calculated as 31.2 and 58.3 nm, respectively. It can be seen that the ξ values are rather high and are compatible with the logpile configuration. In this arrangement the columns are straight and parallel, and well ordered in most of the pore volume, with curvature and defects confined only to the surface layer closest to the pore wall (Fig. 5j and 6e, h). In this model, the main diffraction comes from those pores where the columns are in the correct orientation, nearly parallel to the X-ray beam in the central bulk volume (shaded blue in Fig. 6e). We note that, had the columns been radial, the angle between neighbouring columns in the 20 nm pores would have been as high as 12°, which means that no sharp diffraction would have been seen at all. Further support for the logpile model comes from AFM imaging (see further below).
Interestingly, an orientational transition (transition II) occurs as the pore diameter increases from 60 to 200 nm. In 200 nm pores (Fig. 5h) the orientation of the hexagonal diffraction pattern is rotated by 90° compared to that of the 35 and 60 nm pores, indicating that one of the {100} planes is now perpendicular rather than parallel to the pore axis ((100)⊥ orientation), as drawn in Fig. 5j. In this scenario, there are only two {100} rings and two spots in reciprocal space (Fig. 5i). The same orientation was also observed in 400 nm pores.
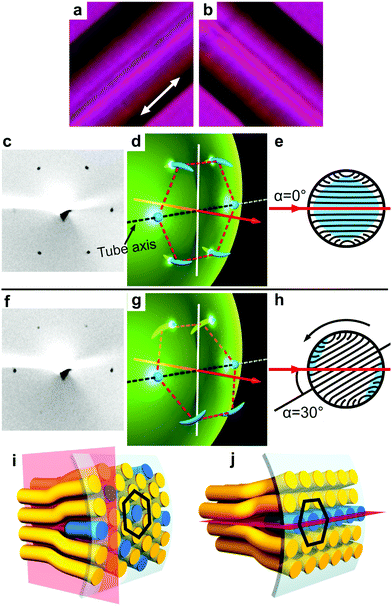
To explore the effect of a further increase in pore size, a thin glass capillary with a 1.5 μm internal diameter was employed. The capillary was filled with HAT6. We first check wheather the columns are parallel (axial) or perpendicular to the capillary axis. Optical images taken with the capillary between crossed polarizers (Fig. 6a and b) show that when a 1λ retarder plate is inserted before the analyzer, the sample appears to be blue when the tube is parallel to the slow axis of the compensator, and orange when turned by 90°. This means that the slow axis of the sample is parallel to the capillary axis. Since the slow axis of a discotic column is perpendicular to the column axis, we can conclude that the LC columns are perpendicular to the tube, consistent with the situation described above for HAT6 in nanopores.
For the SAXS experiment, α = 0° is arbitrarily assigned to the angle at which the full hexagonal diffraction pattern appears. The hexagonal SAXS pattern in Fig. 6c is generated in the bulk interior of the capillary (blue area in Fig. 6e), showing the (100)⊥ orientation as observed also in the 200 and 400 nm pores. However, as α increases the four off-meridional {100} intensity maxima gradually fade away and disappear when α reaches about 30° (Fig. 6f). The corresponding reciprocal space is schematically drawn in Fig. 5d and 6g, where the banana-shaped features replace the rings in Fig. 6i. The observed behaviour provides direct evidence for the logpile configuration of the columns. The banana-shaped reciprocal motifs indicate that the logpile monodomain inside the capillary contains a small amount of misorientation about the capillary axis. This somewhat misoriented columnar fraction is believed to be mainly confined to the splay-bend regions close to the capillary wall, shaded blue in Fig. 6h.
As shown above, the (100)∥ orientation appears only in narrow nanopores, up to 60 nm, while for diameters between 200 nm and 1.5 μm the (100)⊥ orientation is seen. In our previous study we have already observed the (100)∥ orientation of the Bola compound in 400 nm AAO pores and speculated that it is determined by how the hexagonal array of column ends tiles the curved wall surface.14 This preferred orientation is consistent with the report of tiling of the hexagonal lattice of positively charged polymer particles at the curved oil–glycerol interface.25 In order to explain the switch from (100)∥ to (100)⊥ orientation with increasing pore diameter we consider other factors at play, the most important being splay and bend near the pore walls required for the columns to impinge on the wall at the right angle. Of the three standard elastic deformation modes in liquid crystals, i.e. splay, bend and twist, twist and particularly splay have higher energy than bend in columnar phases.26 Splay must occur by insertion of new columns and we propose that this takes place in the close-packed (100) planes, now lying perpendicular to the pore axis (Fig. 6i). The (100)⊥ orientation allows this to occur in each plane almost independent of neighbouring planes. Such splay may also occur via the formation of screw dislocations, with the slip along the (100)⊥. In this way insertion of new columns, required for splay, can occur at different locations in different (100)⊥ planes. In the alternative scenario of (100)∥ orientation, this would not be possible as such a slip would have to take place along the zigzag of the vertical (110) plane. In the case of (100)∥ orientation the splay could be envisaged to occur via edge dislocations as shown in Fig. 6j, but at the price of significantly lower entropy due to the cooperativity of column insertion along an edge dislocation. The conclusion that the splay is favoured to occur within the {100} planes and that this is the dominant factor determining the orientation of the columnar lattice is also supported by the findings on 100 μm capillaries described further below.
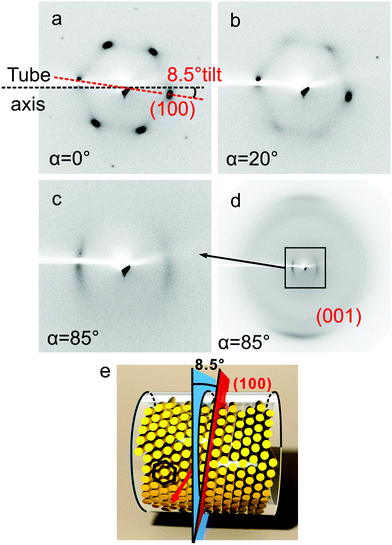
Diffraction patterns similar to those in Fig. 5h and 6f were recorded also with pores larger than 10 μm (Fig. 7), except that the {100} diffraction hexagon is now rotated by about 8.5°, i.e. the (100)⊥ plane now becomes tilted to the pore axis normal (referred hereafter to as “tilted orientation”). This orientation remains in pores up to 50 μm. Curiously, this effect is also seen with other column-forming liquid crystals, and the tilt angle is always around 8.5°. We refer to the 8.5° rotation of the hexagonal lattice as orientational transition III. The cause of this transition is not clear. Perhaps it could be associated with the anisotropic thermal contraction upon cooling the bulk while maintaining surface attachment of the columns established at the nucleation stage. Alternatively, it could be a result of packing energy minimization. We are not aware of the theoretical studies of columns in cylindrical cavities, but equivalent studies of spheres within cylinders have shown a variety of packing modes as a function of a sphere-to-cylinder radius ratio, most of them chiral and with tilted axes.27
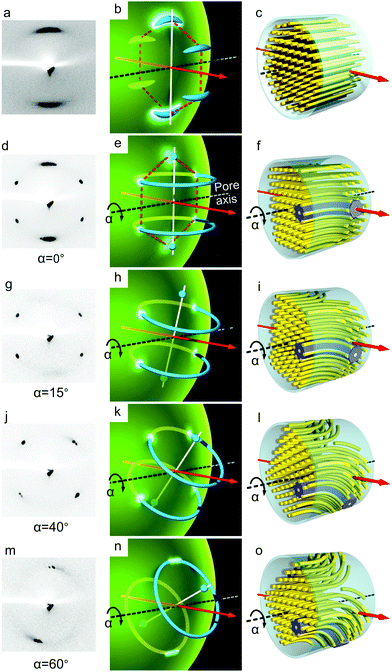
As the pore diameter increases to 100 μm, the diffraction pattern changes again profoundly, indicating that another transition in column orientation had taken place (transition IV). Diffraction was recorded as the capillary was translated along its axis by x and rotated by α. For the most part two {100} reflections were seen on the equator (top and bottom) – see Fig. 8a. As the capillary was rotated around its axis the intensity of these reflections oscillated, with maxima every 60°. This behaviour indicates axial orientation of a columnar monodomain – see model in Fig. 8c and the associated reciprocal space depiction in Fig. 8b. In reciprocal space there are six {100} points, or arcs, on a hexagon in a plane normal to the tube axis, and with changing α these periodically intersect the Ewald sphere into two equatorial points. In addition to the {100} reflections, a rather broad (001) diffraction streak is seen on the meridian (horizontal) in the wide angle region, corresponding to the 0.34 nm π–π stacking distance between the aromatic rings (see Fig. S5 in the ESI†).
Often, however, with the 100 μm capillary, additional weaker off-equatorial {100} spots are seen, indicating that a small fraction of the material has the columns oriented perpendicular to the capillary axis. These are believed to represent homeotropic domains near the capillary surface. On a few occasions we observed what seem to be local transversely oriented logpile domains with a smooth transition between the axial and the transverse orientation through a columnar director bending by +90° and −90° at either side of the tube, with bifurcation in the middle of the tube (see models in Fig. 8f, i, l and o). The proposed model is based on the following observations. At a given position x along the capillary and a given rotation angle α = 0°, six {100} reflections are seen on a regular hexagon, with the two equatorial ones (top and bottom) stronger and more streaky than the other four (Fig. 8d). As the tube rotates, the intensities on the equator gradually fade away (Fig. 8g and j); meanwhile the four off-equatorial spots move toward the equator and finally, at around α = 60°, they merge on the equator (Fig. 8m). These observations are consistent with the reciprocal space containing two complete {100} rings and two {100} points, similar to those in Fig. 5i but with the axis perpendicular rather than parallel to the pore (Fig. 8e, h, k and n). Upon capillary rotation, the merger of the four diffraction spots into two equatorial ones in Fig. 8m mark the Ewald sphere just touching rather than crossing the two {100} reciprocal rings.
We note that in the above example splay is clearly confined to a {100} plane, consistent with the conclusion derived above (Fig. 8i). We also note that, although axial column orientation develops upon cooling from the isotropic phase in all cases in wide capillaries, monodomains develop only upon slow cooling, while polydomains, cylindrically randomized about the capillary axis, are observed in rapidly cooled samples.
HBC and Bola
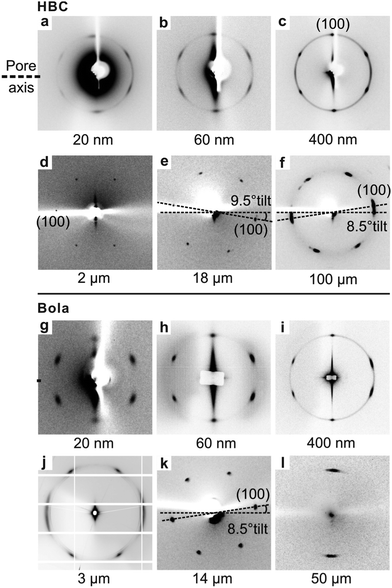
Compared to HAT6, the diffraction patterns of HBC show similar evolution sequence, even though the columns of HBC are more rigid than those of HAT6 due to the larger size of the aromatic core (Fig. 1b). As in HAT6, the columns are also perpendicular to the pore axis. However there is a slight difference regarding pore size dependence. While in HAT6 in 20 nm pores the orientation of the xy plane of the hexagonal lattice is randomized around the column axis, in HBC the hexagonal lattice shows a well-defined (100)∥ orientation even in 20 nm pores as indicated by the hexagonal pattern in Fig. 9a. While in HAT6 the orientation switches to (100)⊥ already between 35 and 60 nm pore diameters, in HBC the (100)∥ orientation remains even in 400 nm pores (Fig. 9c), and only changes to (100)⊥ in the 2 μm ID capillary (Fig. 9d). This difference between HAT6 and HBC in the onset of orientational transition II could perhaps be understood in terms of the larger persistence length of the HBC columns, which are therefore able to bend less and splay in narrow pores. As suggested above, the switch to the (100)⊥ orientation is mediated by those two distortions.For the capillary samples only SAXS patterns at α = 0° are shown here, while those recorded at other rotation angles are similar to those of HAT6. They prove that HBC columns also arrange in the logpile configuration. As the pore size increases beyond 2 μm, the (100)⊥ orientation is replaced by the one where the hexagonal lattice is rotated by a small angle about the logpile axis (transition III, Fig. 6e and 9e). This tilted orientation remains even as the diameter reaches 100 μm (Fig. 9e). Interestingly, the tilt angle is also around 8.5°, as in HAT6. The tilted orientation becomes weak in a 150 μm pore and multidomains with a random powder-like orientation are seen in the 200 μm capillary.
The bolaamphiphile compound Bola is not a discotic liquid crystal, and its columnar phase is a honeycomb, i.e. of a type very different from that of HAT6 and HBC (Fig. 1c). Nevertheless and quite remarkably, its behaviour is very similar to that of HBC in every detail, as shown in the bottom part of Fig. 9. The hexagonal lattice remains in the (100)∥ orientation for pore diameters up to and including 400 nm (Fig. 9i) and it switches to the (100)⊥ orientation (transition II, Fig. 9j) in the 3 μm circular pores in silicon wafer produced by the DRIE process – see Fig. 3. In pores larger than 10 μm, the hexagonal lattice also orients with its transverse (100) plane rotated by 8.5° away from the pore normal (transition III, Fig. 9k).
Furthermore, in a 50 μm capillary Bola shows only two equatorial (vertical) SAXS reflections at certain α angles (Fig. 9l), indicating that the transition to axial orientation (transition IV) had taken place. When the tube was moved along its long axis, the diffraction pattern remained unchanged, which indicates that the columns were axially oriented along the entire length of the tube. When the tube was rotated around its long-axis, the two spots showed up at 60° intervals in α (Fig. S6, ESI†), which shows that the columnar LC is a single domain. This is similar to what is described in Fig. 6a–c. Bola also shows axial orientation in the 100 μm capillary, except that in this case the orientation is a cylindrically randomized multi-domain.
The paradox of axial orientation
It appears to be paradoxical that for columnar LCs with planar anchoring, i.e. where columns lie parallel to the AAO surface, the axial orientation can only be obtained in narrow pores, of the order of 20 nm, and only in special compounds that form highly rigid columns, which excludes e.g.HAT6.18 Yet here we find that all three compounds, whose columns prefer to attach normal to the surface, invariably adopt axial columnar orientation in large pores (tens of μm and above). How do we explain this apparent contradiction? As we discussed in our previous work, in most cases of planar anchoring the columns form concentric circles (CC) in the plane normal to the pore axis. The reluctance to adopt axial alignment was attributed to the associated high energy penalty of distortion of the 2D lattice due to the mismatch between the polygonal (e.g. hexagonal) lattice and the circular pore wall. Planar anchoring energy in a columnar phase is negative only if the substrate is parallel to a densely packed crystallographic plane, such as {100}. To comply with the curvature of the wall the 2D lattice must either be highly distorted, or face the wall with a high-index high-energy contact plane like (110), (210) etc. In most cases the low bend energy of the columns and the ability of a {100} plane to maintain contact with the circular wall mean that the CC configuration is preferred. Since the bulk lattice distortion energy increases steeper than the integral bend energy with increasing pore radius,18 axial orientation is seen only in small pores, and only in compounds with stiff columns. In the limiting case of wide capillaries (e.g. 100 μm) planar anchoring columns simply lose any in-plane preferred orientation while remaining parallel to the glass wall; the low curvature of the wall is then evidently insufficient to direct the in-plane orientation of the columns.So why do columns with homeotropic anchoring end up axially oriented in wide pores? It is clear that in the case of homeotropic anchoring, lattice distortion does not play a part since the edge (hk0) planes of the axial columnar lattice do not come in contact with the curved pore wall in any case. It seems likely that axial orientation in wide pores is related to the “escape in the third dimension”, a solution of the problem of radial configuration that is observed in confined nematic LCs.23,28 While in narrow pores the columns that nucleate at a point on the pore wall grow to reach the opposite wall uninterrupted, creating the logpile configuration, in wide pores nucleation is likely to occur at several places around the rim of the pore. We propose that, rather than leaving grain boundaries between the impinged logpile domains, the columns coming from different nuclei bend toward the pore axis. The columns then converge in a single domain or in multiple axial domains, as indicated above, depending on the cooling rate and nucleation density. Thus, although the pore may be wide, the clash between simultaneously growing domains still occurs near the pore central axis, the escape into coherent axial growth still providing the lowest energy solution. The convergence into axial configuration can be imperfect, as illustrated by the transverse logpile and splay-bend defects in the case of HAT6 in the 100 μm capillary (Fig. 8). In contrast to the case of homeotropic anchoring, for columnar compounds with planar anchoring, there is no obvious driving force for adopting axial orientation in large pores.
Logpile morphology by AFM
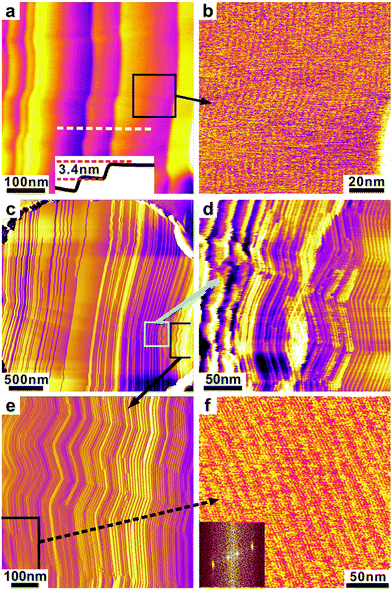
In our previous study14 using AFM of fractured 400 nm AAO templates filled with Bola, we have observed directly that one of the (100) planes of the columnar phase was parallel to the pore axis. For our AFM experiments here we use smooth-surface Si wafers with well-defined 3 μm diameter pores etched by DRIE. This allows imaging with higher resolution. Fig. 10 shows the AFM phase images obtained from such a circular hole. It can be seen in Fig. 10c that the pore was filled by the compound to the very top of the entrance, which facilitates scanning.Vertical lines can be seen on the surface of the confined compound, as shown in Fig. 10c. They are straight in the centre and slightly curved (concave) on each side. These lines are edges of layers, as shown in the zoomed-in image in Fig. 10a. The layer thickness was measured as 3.4 nm from the height profile along the white dashed line in Fig. 10a. Considering the 3.0 nm {100} d-spacing of the hexagonal lattice, this implies that each step is a single layer of columns and that the (100) plane is perpendicular to the pore axis. Indeed, individual columns parallel to those edges can be seen in the high magnification image in Fig. 10b. Thus the edges of the steps observed in Fig. 10c show that the columns are packed parallel straight across the pore width, which represents the logpile configuration. On the two sides of the pore, the lines are no longer perpendicular to the wall, indicating that the columns deviate from homeotropic anchoring.
Very narrow steps can be seen near the side of the pore, as shown in Fig. 10d and e. The step density reflects the slope of the LC meniscus at the pore entrance. The Fourier transformed pattern inserted in Fig. 10f shows the 3.5 nm spacing of the columns and the 15 nm spacing of the steps. The observed zigzagging of the columns (Fig. 10d and e) is attributed to the possible tilt of the molecules in the columns upon cooling, common in columnar LCs. Such zigzagging, on a μm scale, is often observed in polarized optical images of cooled columnar developable domains, or “spherulites”, where it appears in the form of radial striations.
Conclusions
We have performed a systematic study of orientational configurations of a homeotropically anchored hexagonal columnar phase formed by a small disc (HAT6), a large disc (HBC), and T-shaped amphiphilic (Bola) mesogens in cylindrical confinement. Although these columnar phases are formed by different kinds of molecules, the evolution of column arrangement with increasing pore size is remarkably similar, suggesting a universal nature of the observed behaviour. Five types of arrangements are identified – see Fig. 11, of which the first four (a–d) are of the logpile type, with parallel columns traversing the pores normal to the pore axis; in the fifth (e), observed only in capillaries tens of microns or more in width, the columns are axial. The configuration with random in-plane orientation of the hexagonal lattice (Fig. 11a) is seen only with HAT6 and only in the narrowest pores. With increasing pore diameter (transition I) all compounds first display the (100)∥ orientation (b), then (transition II) the (100)⊥ orientation (c), followed by (transition III) a 8.5° rotation of the xy plane (tilted orientation, d), followed finally (transition IV) by reorientation of the columns from transverse to axial (e). The observed behaviour may be considered general for a confined columnar phase under homeotropic anchoring. This work is complementary to our previous study of planar columns in confinement. A practical implication is that the axial orientation, which is desirable for organic electronic applications, is achievable in small pores under planar anchoring or, unexpectedly and more easily, in large pores under homeotropic anchoring.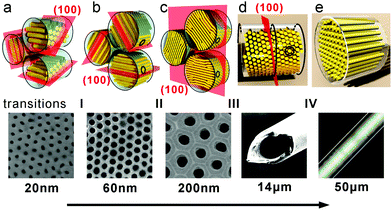 | ||
| Fig. 11 Summary of the five configurations of homeotropically anchoring columns in cylindrical pores of increasing diameter described in this work. | ||
Acknowledgements
We thank Prof. Richard Bushby for supplying HAT6, Prof. Carsten Tschierske for supplying the Bola compound, Dr Kyusoon Shin for supplying the AAO templates and Prof. Qinghui Jin and Miss Chunyan Wu for the DRIE treated Si wafer. For help with the off-line and the synchrotron X-ray experiments we thank, respectively, Dr P. Baker at Sheffield and Dr Olga Shebanova and Prof. N. Terrill, beamline I22, Diamond Light Source. Financial support from NSF-EPSRC PIRE program, project “RENEW” (EP-K034308), and the 1000 Talents Program of P. R. China (GU) for funding this work.References
-
G. Crawford and S. Zumer, Liquid Crystals in Complex Geometries, Taylor and Francis, London, England, 1996 Search PubMed
.
- A. V. Kityk, M. Wolff, K. Knorr, D. Morineau, R. Lefort and P. Huber, Phys. Rev. Lett., 2008, 101, 187801 CrossRef PubMed
.
- T. Woehrle, I. Wurzbach, J. Kirres, A. Kostidou, N. Kapernaum, J. Litterscheidt, J. C. Haenle, P. Staffeld, A. Baro, F. Giesselmann and S. Laschat, Chem. Rev., 2016, 116, 1139–1241 CrossRef CAS PubMed
.
- W. Pisula, M. Zorn, J. Y. Chang, K. Müllen and R. Zentel, Macromol. Rapid Commun., 2009, 30, 1179–1202 CrossRef CAS PubMed
.
- M. O’Neill and S. M. Kelly, Adv. Mater., 2011, 23, 566–584 CrossRef PubMed
.
- M. Funahashi, J. Mater. Chem. C, 2014, 2, 7451–7459 RSC
.
- T. Kato, M. Yoshio, T. Ichikawa, B. Soberats, H. Ohno and M. Funahashi, Nat. Rev. Mater., 2017, 2 Search PubMed
, in press.
- M. Kastler, W. Pisula, R. J. Davies, T. Gorelik, U. Kolb and K. Muellen, Small, 2007, 3, 1438–1444 CrossRef CAS PubMed
.
- M. Steinhart, S. Zimmermann, P. Göring, A. K. Schaper, U. Gosele, C. Weder and J. H. Wendorff, Nano Lett., 2005, 5, 429–434 CrossRef CAS PubMed
.
- C. Stillings, E. Martin, M. Steinhart, R. Pettau, J. Paraknowitsch, M. Geuss, J. Schmidt, G. Germano, H. W. Schmidt, U. Gösele and J. H. Wendorff, Mol. Cryst. Liq. Cryst., 2008, 495, 285–293 CAS
.
- C. Stillings, M. Steinhart, E. Martin, B. Brandl, G. Germano, U. Gösele and J. H. Wendorff, Eur. Phys. J. E: Soft Matter Biol. Phys., 2009, 28, 305–313 CrossRef PubMed
.
- H. Duran, B. H. Azanza, M. Steinhart, D. Gehrig, F. Laquai, X. L. Feng, K. Müllen, H. J. Butt and G. Floudas, ACS Nano., 2012, 6, 9359–9365 CrossRef CAS PubMed
.
- P. Huber, J. Phys.: Condens. Matter, 2015, 27, 103102 CrossRef PubMed
.
- R. B. Zhang, X. B. Zeng, M. Prehm, F. Liu, S. Grimm, M. Geuss, M. Steinhart, C. Tschierske and G. Ungar, ACS Nano, 2014, 8, 4500–4509 CrossRef CAS PubMed
.
- C. V. Cerclier, M. Ndao, R. Busselez, R. Lefort, E. Grelet, P. Huber, A. V. Kityk, L. Noirez, A. Schönhals and D. Morineau, J. Phys. Chem. C, 2012, 116, 18990–18998 CAS
.
- A. V. Kityk, M. Busch, D. Rau, S. Calus, C. V. Cerclier, R. Lefort, D. Morineau, E. Grelet, C. Krause, A. Schönhals, B. Frick and P. Huber, Soft Matter, 2014, 10, 4522–4534 RSC
.
- S. Całus, A. V. Kityk and L. Borowik, Phys. Rev. E: Stat., Nonlinear, Soft Matter Phys., 2015, 92, 012503 CrossRef PubMed
.
- R. B. Zhang, X. B. Zeng, B. Kim, R. J. Bushby, K. Shin, P. J. Baker, V. Percec, P. Leowanawat and G. Ungar, ACS Nano, 2015, 9, 1759–1766 CrossRef CAS PubMed
.
- N. Boden, R. C. Borner, R. J. Bushby, A. N. Cammidge and M. V. Jesudason, Liq. Cryst., 1993, 15, 851–858 CrossRef CAS
.
- Y. Zhou, M. Y. Zhang, K. H. Gu, Y. F. Zhu, X. H. Fan and Z. H. Shen, Asian J. Org. Chem., 2015, 4, 746–755 CrossRef CAS
.
- X. H. Cheng, M. Prehm, M. K. Das, J. Kain, U. Baumeister, S. Diele, D. Leine, A. Blume and C. Tschierske, J. Am. Chem. Soc., 2003, 125, 0977–10996 Search PubMed
.
-
(a) H. Masuda and K. Fukuda, Science, 1995, 268, 1466–1468 CAS
; (b) H. Masuda, K. Yada and A. Osaka, Jpn. J. Appl. Phys., Part 2, 1998, 37, L1340–L1342 CrossRef
.
- P. E. Cladis and M. Kleman, J. Phys., 1972, 33, 591–598 CAS
.
- R. B. Meyer, Philos. Mag., 1972, 27, 405–424 CrossRef
.
- W. Irvine, V. Vitelli and P. Chaikin, Nature, 2010, 468, 947–951 CrossRef CAS PubMed
.
- J. V. Selinger and R. F. Bruinsma, Phys. Rev. A: At., Mol., Opt. Phys., 1991, 43, 2910–2921 CrossRef
.
- L. Fu, W. Steinhardt, H. Zhao, J. E. S. Socolar and P. Charbonneau, Soft Matter, 2016, 12, 2505–2514 RSC
.
- G. P. Crawford, M. Vilfan and J. W. Doane, Phys. Rev. A: At., Mol., Opt. Phys., 1991, 43, 835–843 CrossRef CAS
.
Footnote |
| † Electronic supplementary information (ESI) available: Calculation of correlation length; wide-angle X-ray diffraction patterns; SAXS patterns and models of Bola. See DOI: 10.1039/c7sm00620a |
| This journal is © The Royal Society of Chemistry 2017 |

