
 Open Access Article
 This Open Access Article is licensed under a
 Creative Commons Attribution 3.0 Unported Licence
Structural studies of the bond-orientational order and hexatic–smectic transition in liquid crystals of various compositions
I. A.
Zaluzhnyy
ab,
R. P.
Kurta
c,
E. A.
Sulyanova
d,
O. Yu.
Gorobtsov
a,
A. G.
Shabalin†
a,
A. V.
Zozulya‡
a,
A. P.
Menushenkov
b,
M.
Sprung
a,
A.
Krówczyński
e,
E.
Górecka
e,
B. I.
Ostrovskii
*df and
I. A.
Vartanyants
 *ab
*ab
aDeutsches Elektronen-Synchrotron DESY, Notkestrasse 85, D-22607 Hamburg, Germany. E-mail: ivan.vartaniants@desy.de
bNational Research Nuclear University MEPhI (Moscow Engineering Physics Institute), Kashirskoe shosse 31, 115409 Moscow, Russia
cEuropean XFEL GmbH, Holzkoppel 4, D-22869 Schenefeld, Germany
dFSRC “Crystallography and Photonics”, Russian Academy of Sciences, Leninskii prospect 59, 119333 Moscow, Russia. E-mail: ostrenator@gmail.com
eDepartment of Chemistry, University of Warsaw, Zwirki I Wigury 101, 02-089, Warsaw, Poland
fLandau Institute for Theoretical Physics, Russian Academy of Sciences, prospect akademika Semenova 1-A, 142432 Chernogolovka, Russia
First published on 5th April 2017
Abstract
We report on the X-ray studies of freely suspended hexatic films of three different liquid crystal compounds. By applying angular X-ray cross-correlation analysis (XCCA) to the measured diffraction patterns the parameters of the bond-orientational (BO) order in the hexatic phase were directly determined. The temperature evolution of the BO order parameters was analyzed on the basis of the multicritical scaling theory (MCST). Our results confirmed the validity of the MCST in the whole temperature range of the existence of the hexatic phase for all three compounds. The temperature dependence of the BO order parameters in the vicinity of the hexatic–smectic transition was fitted by a conventional power law with a critical exponent β ≈ 0.1 of extremely small value. We found that the temperature dependence of higher order harmonics of the BO order scales as the powers of the first harmonic, with an exponent equal to the harmonic number. This indicates a nonlinear coupling of the BO order parameters of different order. We demonstrate that compounds of various compositions, possessing different phase sequences at low temperatures, display the same thermodynamic behavior in the hexatic phase and in the vicinity of the smectic–hexatic phase transition.
1 Introduction
The hexatic phase was first predicted as an intermediate state between a crystal and a liquid in the theory of two-dimensional (2D) melting.1,2 The 2D hexatic phase is characterized by a sixfold quasi-long-range bond-orientational (BO) order, while the positional order is short range. Phases with a 2D hexatic order have been found in different systems, such as polymer colloids,3–5 electrons at the surface of helium,6 superconducting vortices7,8 and smectic liquid crystals9–11 (LCs). In the latter case the hexatic phase was experimentally observed in a three-dimensional (3D) stack of parallel molecular layers.9 The formation of the hexatic ordering in 3D has been hardly understood – according to the Halperin and Nelson theory1 the hexatic phase arises as a consequence of the broken translational symmetry of a 2D crystal, induced by dissociation of thermally excited dislocation pairs. The transition to an isotropic liquid occurs only after a subsequent unbinding of the disclination pairs. Such a defect-mediated mechanism clearly does not work in 3D crystals due to the difference in defect formation energies in the 2D and 3D cases. Fortunately, the hexatic phase in LCs can be fully described on the basis of symmetry considerations, which does not imply any specific melting mechanism. For example, the quantitative characterization of the BO order in 2D and 3D hexatic LCs can be made using the multicritical scaling theory (MCST) developed by Aharony et al.12The critical behavior of liquid crystals at the smectic–hexatic phase transition remains a challenging problem that is still not well understood. In the following we consider the smectic and hexatic phases in which elongated molecules are oriented perpendicular to the layers (Sm-A and Hex-B, respectively13). The BO order in the Hex-B phase is characterized by a sixfold rotational symmetry and is described by the local ordering field
| ψ(r) = |ψ(r)|exp[i6θ(r)], | (1) |
The structure of hexatics is traditionally studied by means of X-ray or electron diffraction in a single-domain area of a hexatic film.9,10 Within such an approach the BO order parameters are determined by fitting the measured azimuthal intensity distribution with the Fourier cosine series. In our previous X-ray studies22,23 we have applied the angular X-ray cross-correlation analysis (XCCA) to study the BO order in single-domain Hex-B films. Angular XCCA has been developed to investigate the structure of partially ordered systems to detect hidden symmetries and weak angular correlations.24–29 These include various complex fluids, polymers, colloids, suspensions of biological molecules, block copolymers and liquid crystals. In relation to the hexatic phase, XCCA enabled a direct determination of the sixfold BO order parameters from the ensemble of measured diffraction patterns.22,23 The application of XCCA allowed us to avoid the uncertainty of a fitting procedure and determine multiple harmonics of the BO order with great accuracy. Furthermore, with the values of the BO order parameters one can reconstruct the angular resolved pair distribution function (PDF) and observe the formation of the hexatic phase in real space.30
In the present work we investigated the structure of three different LC compounds, prepared as thick freely suspended hexatic films, which are truly 3D systems. There are several motivations for this study. First, we wanted to make sure that the character of the BO ordering in the Hex-B phase is the same for LC molecules of different compositions and various phase sequences. Two of our LC materials, 75OBC and 3(10)OBC, studied earlier,22,23,51 belong to the homologous series nmOBC and show a low-temperature 3D crystalline phase with a rectangular in-plane lattice possessing a herringbone order13,31 (so-called Cr-E phase). The third compound, PIRO6, possesses a very different chemical structure (with hydrogen bonds) and shows a low-temperature crystalline phase with a hexagonal in-plane lattice32 (Cr-B). The latter is especially important on account of speculations on the possible influence of a low-temperature herringbone order on the properties of hexatics.33 Second, we studied the temperature dependence of the BO order parameters in the vicinity of the Sm-A–Hex-B phase transition that allowed us to obtain and compare the values of the critical exponent β for different compounds. And finally, we performed an analysis of the BO order parameters in the framework of the MCST and proved the validity of this theory for the studied compounds.
This work is organized in the following way. In the next section we discuss various theoretical approaches to describe the 2D and 3D hexatic ordering in LCs. In the third section the basics of the angular X-ray cross-correlation are presented. The fourth section contains the description of the experiment and properties of the studied compounds. In the fifth section we present the analysis of the positional order and the results of the spatially resolved studies of the single-domain formation in hexatic films. Then we show the data on the BO order parameters and the results of application of the MCST to all three LC compounds. The section completes with the analysis of the critical behavior of the BO order parameters in the vicinity of the Sm-A–Hex-B transition. The final section gives the concluding discussion.
2 Theoretical aspects of the hexatic ordering
2.1 Stacked hexatic phase
The in-plane structure in the Sm-A phase is liquid-like with the positional correlations between molecules decaying exponentially. Upon decreasing the temperature a transition into the Hex-B phase, which displays the BO order, may occur. This means that within smectic layers orientations of local hexagons persist over macroscopic distances, even in the absence of the positional order. For smectic layers this leads to a sixfold rotational symmetry and BO correlations are described in terms of the two-component ordering field introduced in the preceding section. The above picture applies to the individual smectic layers that are 2D hexatics in nature. It was experimentally confirmed that hexatic films consisting of one or two molecular layers represent true 2D systems.34–37 Birgeneau and Litster38 suggested that some of the ordered smectic phases might actually be the 3D analogues of the hexatic phase described by Halperin and Nelson.1 In such case the coupling of layers in the third dimension introduces additional angular correlations from layer to layer. Here the mean-square fluctuations of the bond angles remain finite in contrast to the situation in two dimensions, so a 3D (or stacked) hexatic phase exhibits a true long-range BO order. At the same time the in-plane positional correlations remain short-range and decay exponentially with a distance.The in-plane structure factor in the Sm-A phase has the form of a broad ring due to the short-range positional correlations between molecules. The presence of the BO order in the hexatic phase breaks the angular isotropy of the structure factor and leads to a sixfold modulation of the in-plane scattering. A Fourier expansion of the azimuthal scattering profile gives10
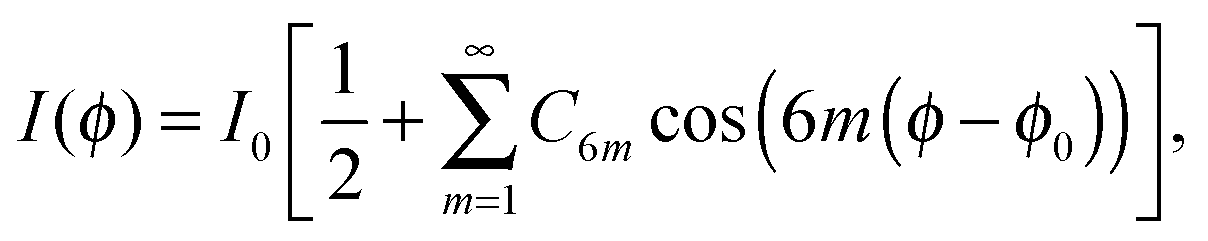 | (2) |
2.2 In-plane positional order in hexatics
Due to the interplay between the liquid density fluctuations and the BO order parameters analysis of the radial intensity profiles in the hexatic phase is a complicated task.39,40 The X-ray scattering technique measures the Fourier-transformed density–density autocorrelation function. In fact, the measurement of the evolution of the BO order is possible only due to coupling between the liquid density fluctuations and the hexatic order parameters. The change in the liquid structure factor (LSF) in the vicinity of the hexatic–smectic transition was studied in the framework of the phenomenological XY model by Aeppli and Bruinsma.39 The authors have shown that the form of LSF (measured as a radial scan through one of the sixfold diffraction maxima) depends strongly on the mean square amplitude of fluctuations of the BO order parameters. In the Sm-A phase at high temperatures and in the Hex-B phase at low temperatures far away from the phase transition temperature TC the LSF can be described by the Lorentzian profile with a half-width γ | (3) |
 , where a is the average lateral molecular separation. In this case the positional correlations decay as ∼r−1/2
![[thin space (1/6-em)]](https://www.rsc.org/images/entities/char_2009.gif) exp(−γr) for 2D systems at large distances.13
exp(−γr) for 2D systems at large distances.13
The most interesting behavior occurs in the vicinity of the smectic–hexatic transition, where the fluctuations of the BO field dominate. According to the theoretical predictions39 the LSF is well approximated in this region by the square root of a Lorentzian (SRL)
 | (4) |
exp(−γr). In this work we defined the positional correlation length that characterizes the exponential decay of positional correlations between the molecules as ξ = 1/Δq, where Δq is the half width at half maximum (HWHM) of the diffraction peak in the radial direction. If the diffraction peak is approximated by the Lorentzian function, ξ = 1/γ, and in the case of the SRL function, 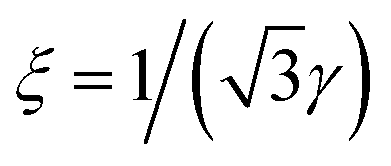 .
.
As a consequence of a functional dependence of the diffraction peak shape on the mean square amplitude 〈|ψ|2〉, the correlation length at the smectic–hexatic transition starts to grow in the high temperature smectic phase, shows the maximum of the derivative dξ/dT at the phase transition point TC, and then nearly saturates deep in the hexatic phase. This corresponds to the presence of an inflection point on the temperature dependence of the correlation length ξ at the phase transition temperature TC. Interestingly, a similar temperature dependence with the inflection point at TC is predicted39 also for the peaks’ maximum position q0. Such behavior has been observed experimentally for many hexatic LCs.13,22,41 The temperature width of the region where the BO order fluctuations are really strong has not been evaluated in the theory.39 From the X-ray experiments it can be estimated as a few degrees, in accordance with the range of the divergent behavior of the specific-heat at the Hex-B–Sm-A phase transition.16–19
2.3 Multicritical scaling theory
In the absence of a microscopic theory of the hexatic ordering in the stacked (3D) smectics we consistently use phenomenological theories, which are based on symmetry considerations and do not rely on any melting mechanism.12,39 The ordering field of the Sm-A–Hex-B transition is a two-component BO order parameter. This places this transition in the XY universality class and allows it to be continuous in 3D. General thermodynamic arguments allow reconstruction of the topology of the hexatic phase diagram in the vicinity of the Sm-A–Sm-B–Cr-B triple point. A generic phase diagram suggested by Aharony et al.12 is shown in Fig. 1. The Sm-A–Cr-B transition in three dimensions is always first-order due to the long-range positional order and the presence of a cubic term in the free-energy expansion in powers of the Fourier coefficients of the density.42 The same cubic term is present for a Hex-B–Cr-B transition and gives rise to a first-order transition in 3D. These two first-order lines meet at a triple point with different slopes, since the coupling between the BO order parameter and the amplitudes of the density waves shifts the transition Hex-B–Cr-B relative to the continuation of the Sm-A–Cr-B line. Such discontinuity in the slope at the triple point causes the Sm-A–Hex-B transition to become first-order in its vicinity.12 This introduces a tricritical point on the Sm-A–Hex-B phase transition line. There are also other interactions which potentially can shift the Sm-A–Hex-B phase transition to the tricritical region. These include the coupling of the BO order with the short-range herringbone molecular packing,33 interaction of BO order with in-plane positional strains,17 and coupling between the hexatic order and layer displacement fluctuations.43 The precise adiabatic scanning calorimetry study of the hexatic compound 65OBC by Van Roie et al.18 has proved that the Hex-B–Sm-A transition is indeed very weakly first-order.17,19 The latent heat at the transition was found to be as small as ΔH ≈ 0.04 J g−1.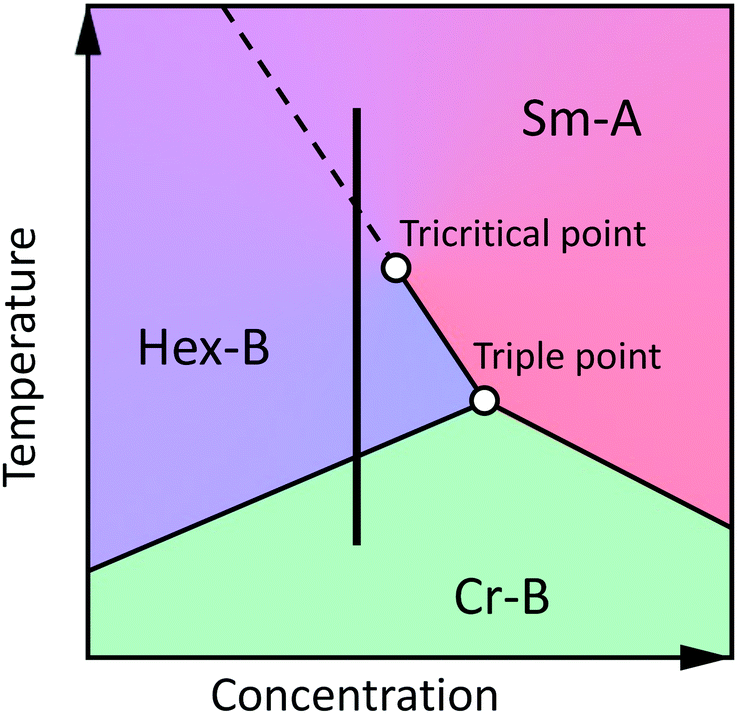 | ||
| Fig. 1 Generic temperature–concentration phase diagram, representing phase transitions between Sm-A, Hex-B and Cr-B phases of LCs. Solid lines denotes first-order transition and dashed line corresponds to second-order transition. Black vertical line represents the phase sequence for certain compounds. | ||
Assuming that the Sm-A–Hex-B phase transition lies in a crossover region between the mean field (tricritial behavior) and 3D XY universality class, Aharony et al.10,12 have shown that the BO parameters C6m defined in eqn (2) in the frame of the MCST satisfy the following scaling law
| C6m = (C6)σm, | (5) |
| σm = m + xm·m·(m − 1). | (6) |
| xm ≃ λ − μm + νm2 −… | (7) |
3 X-ray cross-correlation analysis
XCCA allows one to study the BO order by analysing the angular correlations of the scattered intensity.22,25,29,46 A two-point angular cross-correlation function (CCF) of intensity is defined as| G(q,Δ) = 〈I(q,ϕ)I(q,ϕ + Δ)〉ϕ. | (8) |
 | (9) |
 | (10) |
| Gn(q) = |In(q)|2, | (11) |
 | (12) |
 | ||
| Fig. 2 Scheme of the experimental setup. An X-ray beam focused by CRLs is incoming perpendicular to the surface of a freely suspended LC film. The diffraction pattern in transmission geometry is measured by a 2D detector positioned behind a sample. In the inset the arrangement of elongated LC molecules in the smectic (hexatic) planes is shown. In this geometry the measured diffraction pattern corresponds to the in-layer structure of LC. | ||
A significant advantage of using the FCs Gn(q) is that they can be averaged over all measured diffraction patterns
 | (13) |
| 〈Gn(q) 〉P = |In(q)|2, | (14) |
4 Experiments
4.1 Samples
We have used three different LC compounds that exhibit the Hex-B phase within a certain temperature range. At higher temperatures all compounds show the Sm-A phase. The chemical structure and the transition temperatures for LC compounds under investigation are shown in Table 1. Two LC materials 75OBC and 3(10)OBC belong to the homologous series13,31 nmOBC. 75OBC exhibits the Hex-B phase in the range22,31,47 of 59–63.8 °C, while 3(10)OBC shows the Hex-B phase in a much wider range of temperatures23,48 54–66.3 °C. Both mesogens exhibit a low-temperature crystalline phase with a rectangular in-plane lattice possessing a herringbone order (Cr-E phase13,31,47). The third compound, PIRO6, possesses a very different chemical structure: its aromatic part consists of three rings, the central of which contains a weak hydrogen bond (see Table 1). The Hex-B phase exists in PIRO6 in the temperature range from 85 to 92.6 °C; contrary to the first two mesogens PIRO6 shows a low-temperature crystalline phase with a hexagonal in-plane lattice32 (Cr-B). Below we use relative temperature Δt = T − TC, where TC is the temperature of the Sm-A–Hex-B phase transition for a given LC compound.| Compound | Chemical structure | Sm-A–Hex-B | Hex-B–Cr |
|---|---|---|---|
| 3(10)OBC |
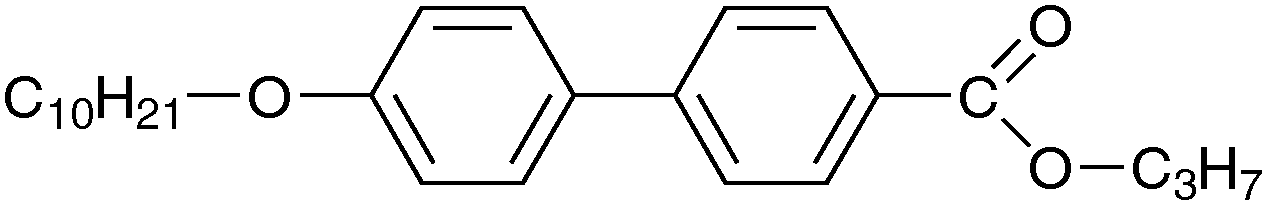
|
||
| n-Propyl-4′-n-decyloxybiphenyl-4-carboxylate | T C ≈ 66.3 °C |
T
Cr ≈ 54.0 °C
Cr-E (orthorhombic) |
|
| 75OBC |

|
||
| n-Heptyl-4′-n-pentyloxybiphenyl-4-carboxylate | T C ≈ 63.8 °C |
T
Cr ≈ 59.0 °C
Cr-E (orthorhombic) |
|
| PIRO6 |

|
||
| 1-(4′ Pirydyl)-3-(4-hexyloxyphyenyloamine)-prop-2-en-1-on | T C ≈ 92.6 °C |
T
Cr ≈ 85.0 °C
Cr-B (hexagonal) |
4.2 Experimental setup
The experiments were conducted at the coherence beamline P10 of the PETRA III synchrotron source at DESY. The experimental setup is schematically shown in Fig. 2. The energy of incident X-ray photons was 13 keV, which corresponds to the wavelength of λ = 0.0954 nm. The X-ray beam was focused by the set of compound refractive lenses (CRLs) to the size of 2 × 3 μm2 (vertical vs. horizontal) at full width at half maximum (FWHM) with a flux of about 3 × 10¹⁰ photons per s. To collect the scattering signal at a diffraction angle 2θ ≈ 12° (q ≈ 14 nm−1, q = (4π/λ)sinθ) the 2D detector Pilatus 1 M (981 × 1043 pixels of 172 × 172 μm2 in size) was positioned perpendicular to the incident beam at a distance of 263 mm downstream from the sample. At each temperature the sample was scanned in the plane perpendicular to the incident beam direction with a 11 μm step size to analyse the spatial variations of the BO order.
In our experiments we have used thick freely suspended hexatic films that are especially suitable for an X-ray scattering study.13 These films have a controlled thickness; the films are not influenced by substrate interactions and their two surfaces induce an almost perfect 2D alignment of the smectic layers. The thickness of the films was measured using an AVANTES fiber optical spectrometer and was in the range of 3–5 μm for 75OBC and 3(10)OBC samples and about 15 μm for the PIRO6 sample (consisting of thousands of molecular layers). Freely suspended LC films were drawn across a circular glass aperture of 2 mm in diameter inside the FS1 temperature stage from INSTEC at about 10 °C above the temperature of the Sm-A–Hex-B phase transition. The sample stage was aligned in such a way that the surfaces of the LC films were perpendicular to the incident beam. During the experiment the sample was gradually cooled with a temperature ramp of 0.05–0.1 °C min−1 to observe structural changes at the Sm-A–Hex-B phase transition point and in the hexatic phase. The temperature was monitored by a mK1000 temperature controller with an accuracy of 0.005 °C. At each temperature a large number of diffraction patterns were collected for better statistics. The exposure time was chosen in the range of 0.5–0.6 s to avoid radiation damage to the samples.
Typical diffraction patterns for PIRO6 and 75OBC samples at different temperatures are shown in Fig. 3(a–f). In the Sm-A phase one can see a uniform ring that corresponds to the liquid-like structure of smectic layers (Fig. 3(a)). Upon cooling the intensity modulation appears along the scattering ring thus indicating the formation of the hexatic order within the layers (Fig. 3(b and c)). At lower temperatures the scattering ring splits into six distinct arcs that correspond to the increase of the BO order (Fig. 3(d)).
 | ||
| Fig. 3 Diffraction patterns collected at different temperatures in PIRO6 and 75OBC samples. (a) Sm-A phase, (b) Sm-A–Hex-B phase transition region, (c and d) Hex-B phase of the PIRO6 sample, and (e and f) Hex-B phase of the 75OBC sample. Black stripes correspond to the detector gaps where no scattering signal was measured. | ||
5 Results and discussion
5.1 The in-plane positional order
In the present work we studied the in-plane positional order in the Sm-A and Hex-B phases using the shape analysis of the radial cross-sections of the diffraction patterns. Since the molecular form factor slowly varies with q, we assumed that the shape of the diffraction peaks is governed by the structure factor. Thus, the intensity distribution I(q) in the radial direction through the maximum of one of the sixfold diffraction peaks in the Hex-B phase was averaged over different positions in the sample and then fitted with the Lorentzian and SRL functions (see Section 2.2). The corresponding intensity profiles for all three compounds in the vicinity of the Sm-A–Hex-B phase transition and at lower temperatures in the Hex-B phase after background subtraction are shown in Fig. 4. In the case of 3(10)OBC and PIRO6 samples the SRL function gives better approximation for I(q) in the temperature interval −0.8 °C ≤ Δt ≤ 0 °C and −2.7 °C ≤ Δt ≤ 0.3 °C, respectively, which is in close vicinity of the Sm-A–Hex-B phase transition temperature (Fig. 4(a and c)). Out of this range the Lorentzian function fits the experimental data better23 (Fig. 4(d and f)). For the 75OBC sample the quality of the data does not allow us to unambiguously distinguish between the Lorentzian and SRL fits (Fig. 4(b and e)). | ||
| Fig. 4 Intensity distribution I(q) along the radial direction through the diffraction peak in the vicinity of the Sm-A–Hex-B phase transition (a–c) and at lower temperatures in the Hex-B phase (d–f) for different compounds. The profiles are shown in semi-logarithmic scale. Black crosses represent the experimental data, solid red and dashed blue lines show fits with the Lorentzian (L) and SRL functions, respectively. | ||
In Fig. 5(a) the positional correlation length ξ = 1/Δq is shown for all three samples as a function of a relative temperature Δt. In the Sm-A phase ξ is about 1–2 nm and does not change with the temperature. On cooling, upon approaching the Hex-B phase the correlation length ξ starts to increase and shows the maximum of the derivative dξ/dT at the phase transition point TC. This indicates a coupling between the spatial density fluctuations and the BO order. The temperature dependence of the positional correlation length differs from one hexatic compound to another due to difference in the value of a coupling constant of the above interaction. Upon cooling, the correlation length ξ either saturates deeper in the Hex-B phase (75OBC) or linearly increases as in 3(10)OBC and PIRO6 hexatic films. Close to the crystallization temperature the in-plane positional correlation length increases by about an order of magnitude (see Table 2). The same trend was observed for other LC compounds, such as41 46OBC or surface hexatic layers in 4O.8 films,49 where ξ reaches the value of about 16 nm and 40 nm, respectively.
 | ||
| Fig. 5 (a) Temperature dependence of the positional correlation length ξ; (b) temperature dependence of the diffraction peak maximum position q0 for three different compounds. | ||
| Parameters | 3(10)OBC | 75OBC | PIRO6 |
|---|---|---|---|
| Max. positional correlation length, ξmax (nm) | 24 ± 1.5 | 6 ± 1 | 13 ± 1 |
| Temperature range of the hexatic phase existence, Δt (°C) | 11 | 5 | 6.6 |
| Max. number of the BO order parameters, mmax | 25 | 7 | 6 |
| MCST parameters, | |||
| λ | 0.31 ± 0.015 | 0.27 ± 0.015 | 0.29 ± 0.015 |
| μ | 0.009 ± 0.001 | — | — |
| ν | ∼10−4 | — | — |
The peak position q0 determined by the average in-plane distance between LC molecules slightly increases as the temperature decreases (Fig. 5(b)). For all three compounds we detected the presence of the inflection point in the peak position q0 temperature dependence at the Sm-A–Hex-B phase transition temperature. This finding is in accordance with the theory of Aeppli and Bruinsma,39 which predicts such behavior as a consequence of growing fluctuations of the BO order parameter.41 These observations indicate that the position of the inflection point on the q0 temperature dependence provides the most reliable determination of the temperature of the Sm-A–Hex-B phase transition.
5.2 Spatially resolved studies
By scanning the sample with the incident X-ray beam, we were able to probe the spatial variation of the BO order within the plane of the Hex-B films.23 To study the BO order we used angular Fourier decomposition of the scattered intensity at each position of the beam: | (15) |
In Fig. 6 the spatial variation of I6(q0) is shown for the 3(10)OBC sample over a large scanning area (300 × 300 μm2) at a relative temperature Δt = −5.3 °C. In this 2D map, the phase of the BO order parameter, i.e. the bond angle θ(r), changes by approximately 7° at a distance of the order of 300 μm, while the magnitude |I6(q0)| is constant. We expect that this is due to the occurrence of large scale hexatic single-domains with different bond angles over the area of the film. The continuous variation of the phases of the BO order parameter within such domains allows the bond angles from different domains to match themselves tangentially. This permits to avoid the formation of the borders between hexatic domains, which costs additional energy. This energy is of the order of KA(∂θ/∂r)2, where KA is the orientational stiffness constant of the hexatic ordering field.44
 | ||
| Fig. 6 Spatially resolved 2D map of the 6th FC for the 3(10)OBC sample at the relative temperature Δt = −5.3 °C. The length of a vector is proportional to the magnitude |I6(q0)| of the BO order parameter; the direction of a vector is associated with the phase ϕ6(q0) of the first harmonic of the BO order. Each vector represents the value of the FC I6(q0) averaged over an area of 20 × 20 μm2. Color represents a relative change of the phase (in degrees). | ||
The formation of large-scale single-domains of this type, as shown in Fig. 6, was typical for the 3(10)OBC and PIRO6 samples where the diffraction peaks have a symmetrical shape in the azimuthal direction (see Fig. 3(a–d)). This means that in all layers, the bond angle θ(r) has the same mean value, and the predominant orientation of intermolecular bonds is preserved in all layers. A single domain with uniform orientation is formed across the whole film. It was not the case for the 75OBC sample, where the diffraction peaks mostly have asymmetrical shape in the azimuthal direction: for example, longer tails in the clockwise direction and steeper tails in the opposite direction (Fig. 3(e–f)). The same asymmetry was observed at different spatial positions in the sample. We attribute an observed asymmetry of the diffraction peaks to a superposition of two or more domains in the illuminated area of the film with a slightly different orientation of the intermolecular bonds. The question arises whether these domains originate from the surface and then penetrate due to angular BO interactions through the whole film, or whether these domains can be formed independently in the interior layers of the thick films.
It is known that in liquid crystals a free surface usually stabilizes a higher-ordered phase which is only observed at lower temperatures in the bulk.13 For example, transmission electron diffraction in thin 4O.8 films50 provided evidence of the following crystallization scenario: the hexagonal crystal grows into the smectic phase in a layer-by-layer fashion involving an intermediate hexatic phase. At the same time, the direction of the hexatic (crystal) axes in the top layers at both sides of the film appear to orient in the same direction, though there are liquid smectic layers in between them. Thus, it is clear that the hexatic domain starts to grow from the surface of the Sm-A film upon approaching the Sm-A–Hex-B transition in bulk. However, the surface epitaxy observed in the thin films might be lost in our thick (thousands layers) films. As a result the bond-orientation of the hexatic domains growing from the top layers at both sides of the film can be different. This necessarily leads to smooth variation of the bond angle θ(r) in the transient area between two surfaces. From the above reasoning the formation of the single hexatic domains in the interior layers of the smectic film is unlikely.
5.3 The bond-orientational order
For the detailed analysis of the BO order we have chosen a single-domain area of 100 × 100 μm2 in our samples. This allowed us to average the CCF over 100 diffraction patterns for the 3(10)OBC and PIRO6 compounds and 25 patterns for 75OBC compound. Due to the sixfold rotational symmetry of the diffraction patterns in the Hex-B phase, only the FCs In(q0) of index n divisible by six should have non-zero values (n = 6, 12, …), and the value of the FCs with n ≠ 6, 12, … should be negligible. Therefore, in the following we use the index m defined as n = 6m in order to enumerate the harmonics of sixfold BO order. The magnitudes of all FCs |In(q0)| are shown in Fig. 7(a–c) as a function of the order number n. It is readily seen, that the values of the FCs of indexes n = 6m are much higher than the values of the FCs for which n ≠ 6m. Thus the latter FCs can be considered as a background. The magnitudes of the FCs with n = 6m monotonically decrease as a function of the harmonic number m. Finally, the components with n = 6m are counted until they reach the background level of FCs with n ≠ 6m. | ||
| Fig. 7 (a–c) Magnitudes of the FCs |In(q0)| as a function of the order number n for 3(10)OBC compound at the relative temperature Δt = −5.3 °C (a), 75OBC compound at Δt = −4.55 °C (b), and PIRO6 compound at Δt = −4.3 °C (c). Red lines show fitting using the MCST. (d–f) Magnitudes of the sixfold FCs of the intensity |I6m(q)| as a function of q for 3(10)OBC (d), 75OBC (e), and PIRO6 (f) compounds at the same temperatures. Only data for m = 1, 3, 5, 7, 9, 11 are shown in panel (d). (g–i) Temperature dependence of the BO order parameters C6m = |I6m(q0)/I0(q0)| for 3(10)OBC (g), 75OBC (h), and PIRO6 (i) compounds. Only data for m = 1, 2, 3, 4, 6, 8, 10, 15, 20, 25 are shown in panel (g). The experimental points are connected with solid lines. The colorbar at the right indicates different values of m. | ||
The q-dependence of the FCs of intensity |I6m(q)| calculated on the basis of eqn (14) is shown for all three LC compounds in Fig. 7(d–f). The analytical expression for the q-dependence of the FCs |I6m(q)| is currently unknown, this remains one of the unresolved issues of the theory. Nevertheless, as a function of q the FCs |I6m(q)| can be satisfactory approximated by the Lorentzian and SRL functions. Our analysis indicated that the low order FCs (m = 1, 2, 3) are better described by the SRL function. For larger values of m (m = 4, 5, …) the corresponding FCs are better fitted by the Lorentzian function. The maxima of the functions |I6m(q)| appear at the same momentum transfer value q = q0 as the maximum value of the total radial intensity I(q) (see Section 5.1). An alternative approach for studying the BO order in the hexatic phase is based on the analysis of the angular shape of the diffraction peaks. Our studies showed that at all temperatures the angular profile of the diffraction peaks in the Hex-B phase can be well described by the Voigt function, which is a convolution of the Lorentzian and Gaussian functions.51
The temperature evolution of the BO order in the Hex-B phase can be described in terms of independent normalized BO order parameters introduced by Brock et al.10,12,23,52,53
 | (16) |
The exceptional high number (mmax = 25) of the successive BO order parameters determined in the Hex-B phase of the 3(10)OBC can be explained by the fact that this compound exhibits the hexatic phase in a wide temperature range of about 11 °C. For comparison in 75OBC and PIRO6 the hexatic phase exists only within the range of about 5 °C and 6.6 °C, respectively (see Table 2). It is clear that a higher degree of the BO order can be achieved in the Hex-B phase before its crystallization if the temperature range of the hexatic phase existence is wider. More importantly, the amount and magnitude of successive BO order parameters are influenced by the strength of interaction between the BO and positional order. For example, in 3(10)OBC a strong correlation between the number of FCs of the BO order and the value of the positional correlation length ξ has been detected.23 This observation indicates strong coupling between the BO and positional order in the hexatic phase of 3(10)OBC.
A quantitative comparison of the BO parameters of different orders in the Hex-B phase was made on the basis of the MCST (see Section 2.3). At each temperature, the values of C6m were fitted by the scaling relations (5)–(7). For the analysis of the experimental data for 3(10)OBC the approximation xm ≈ x(1)m = λ − μm was used for the parameter xm in eqn (7). For other samples the number of non-zero BO order parameters C6m was smaller, so we could not determine the value of the correction parameter μ for them. Thus, for 75OBC and PIRO6 compounds we used the approximation xm ≈ x(0)m = λ. The temperature dependence of the parameter λ for all three samples is shown in Fig. 8(a). On cooling the parameter λ rapidly grows up to the value λ ≈ 0.3 at the Sm-A–Hex-B phase transition and then stays almost constant with the temperature. The experimentally determined values of the parameters λ and μ in the Hex-B phase are in good agreement with the predictions of the MCST for 3D hexatics (see Section 2.3).
 | ||
| Fig. 8 (a) Temperature dependence of the parameter λ, obtained from the fitting of the experimental data with the scaling relations (5)–(7) for different compounds. (b) Temperature averaged values of 〈σm〉T and their fit with eqn (6) and (7) for different compounds. In the inset an enlarged region for m = 1–7 is shown. | ||
Since the exponents σm in the scaling law (5) appear to be almost independent on temperature,12,23 one can calculate the temperature-averaged values 〈σm〉T. In Fig. 8(b) the averaged values 〈σm〉T are shown as a function of the number m for all three compounds. By the fitting of the exponents 〈σm〉T with eqn (5)–(7) we obtained the following values of the MCST parameters: λ = 0.31 and μ = 0.009 for 3(10)OBC, λ = 0.27 for 75OBC and λ = 0.29 for PIRO6 (see values in Table 2). We were even able to determine the magnitude of the next correction term ν ∼ 10−4 for the 3(10)OBC compound (see eqn (7)), for which we observed the largest number of the BO order parameters.23
5.4 Critical behavior at the smectic–hexatic phase transition
The critical behavior at the Sm-A–Hex-B phase transition in LCs has been studied by various techniques for decades, but the problem is still far from being solved. The MCST works for 3D hexatic films surprisingly well.10,23,52,53 This indicates that the initial assumption of the theory12 that the Sm-A–Hex-B transition lies in a crossover region between the mean field (tricritial behavior) and 3D XY universality class might be true.We propose to look at the problem of the critical behavior at the Sm-A–Hex-B transition from a different angle. In Fig. 9 the temperature dependence of the first successive BO order parameters in the vicinity of a Sm-A–Hex-B transition is shown. First, these curves follow the power-law with the exponents increasing with the harmonic number m. Second, the higher order harmonics of the BO order appear at temperatures that are lower than the phase transition temperature TC. Taking these observations into account we fitted the temperature dependence of the BO order parameters C6m by a power-law
 | (17) |
 | ||
| Fig. 9 Temperature dependence of the BO order parameters C6m for compounds 3(10)OBC (a), 75OBC (b), and PIRO6 (c). Solid lines show the fitting of the experimental data by the power law (17). The colorbar at the right indicates different values of m. | ||
| Substance | 3(10)OBC | 75OBC | PIRO6 | ||||||
|---|---|---|---|---|---|---|---|---|---|
| Parameters | A m | T C,m, °C | β m | A m | T C,m, °C | β m | A m | T C,m, °C | β m |
| m = 1 | 1.06 | 66.11 | 0.09 | 0.92 | 63.25 | 0.09 | 1.12 | 92.40 | 0.10 |
| m = 2 | 1.29 | 66.11 | 0.19 | 1.07 | 63.24 | 0.22 | 1.19 | 92.40 | 0.23 |
| m = 3 | 1.45 | 65.71 | 0.27 | 0.91 | 62.84 | 0.26 | 1.45 | 92.40 | 0.29 |
| m = 4 | 1.81 | 65.44 | 0.40 | ||||||
| m = 5 | 2.00 | 64.86 | 0.48 | ||||||
The behavior of critical exponents of higher order can be qualitatively understood in the frame of the Landau theory with nonlinear coupling between the BO order parameters of different orders. The excess of free energy density can be expanded in the vicinity of the Sm-A–Hex-B transition in powers of the first two hexatic order parameters C6 and C12 as
| f = ½A1C62 + ½A2C122 + ¼B1C64 + ¼B2C124 − DC62C12, | (18) |
Minimization of eqn (18) with respect to C12 gives the following equation
 | (19) |
 | (20) |
The small value of the critical exponent β1 ≈ 0.1 rules out the 3D XY model, which should apply to a Sm-A–Hex-B phase transition from basic symmetry considerations. The proximity to a tricritical point, where α = 1/2 and β = 1/4, is also inconsistent with our results. The fact that the critical exponent for specific heat α is not so far from 0.5 (α = 0.6–0.65 for 65OBC) might indicate that the Sm-A–Hex-B transition occurs in the vicinity of a tricritical point as it was initially suggested by Aharony et al.12 In this case, a crossover behavior can be observed, similar to the situation near the nematic – Sm-A tricritical point.55 Interestingly, our results for β1 together with the measured specific heat critical exponent α ≈ 0.65 in 65OBC conform with the 2D four-state Potts model56 with α = 2/3 and β = 1/12, which corresponds to a strongly fluctuating system – three-spin model on the triangular lattice.57 What might be common between the 2D four-state Potts model and the hexatic BO ordering, which is described by a two-component order parameter, is currently unclear.
Let us discuss the values of the critical exponents at the Sm-A–Hex-B transition in more detail. Bruinsma and Aeppli33 proposed a theory based on the coupling of BO order with a short-range herringbone orientational order. Due to this theory the continuous Sm-A–Hex-B transition can be driven to first order with an appearance of the tricritical point at the transition line. Such an approach might be relevant to the hexatics possessing low temperature Cr-E phase of the type of nmOBC series. However, this explanation does not work for PIRO6 with a Cr-B low-temperature phase, where the short-range herringbone order is absent.15
There are some other theoretical models, which introduce a tricritical point at the Sm-A–Hex-B phase transition line. Besides the general theory proposed by Aharony et al.12 (see Section 2.3) there are theories by Selinger,43 who suggested coupling between the BO order and layer displacement fluctuations, and by Haga et al.,17 where the interaction of the BO order with the in-plane positional strain is considered. The latter represents some variant of a compressible XY model, which allows fluctuations of the in-plane strain for weakly first-order transitions, if the material contracts on ordering (see also compressible n-vector model58,59). In principle, the renormalization of the critical exponents in the vicinity of such a tricritical point can lead to very unusual values of the effective critical indexes. However, it is not clear how this model can be implemented to the case of the Sm-A–Hex-B transition.
Finally, in recently published work by Kats et al.,60 the authors have made an assumption that the translational (positional) correlation length ξ is much larger than the hexatic correlation length ξh. The above inequality is violated only in the narrow vicinity of the Sm-A–Hex-B transition temperature, where the critical behavior characteristic of the superfluid phase transition is conserved. As a result the singular part of the heat capacity represents a sum of two terms: the first with a small critical exponent α ≈ −0.01 characteristic of the 3D XY universality class and the second term with the exponent α ≈ 1 which originates from the interaction of the BO order parameter with density fluctuations. Thus, the heat capacity critical exponent16–19α = 0.6–0.65 is based on a single, but not universal, power-law fitting of the experimental data, which reflects a crossover behavior between the two regimes described above.60
6 Conclusions
The important result of our study is that LC compounds of various compositions, possessing different types of low temperature crystal phase (Cr-B or Cr-E) and different range of existence of the Hex-B phase display similar thermodynamic behavior in the hexatic phase and in the vicinity of the Sm-A–Hex-B phase transition. For example, PIRO6, which possesses an internal (and possibly external) hydrogen bonding shows essentially the same temperature dependence of the positional correlation length, similar MCST characteristics and the same critical behavior as the 3(10)OBC compound.Utilizing a micron-sized X-ray beam we were able to study spatial variations of the BO order parameter and to construct 2D maps of the bonds orientations. We observed formation of large domains (more than 100 μm) with uniform orientation of the intermolecular bonds across the whole 3(10)OBC and PIRO6 films. The bond angle in these domains shows continuous change over the whole area, which allows the bond angles from different domains to match themselves tangentially. This situation reminds of the formation of large scale orientational domains in nematic LCs. For the 75OBC compound the situation is different because the average bond-orientation of the hexatic domains growing from the opposite sides of the film deviate from each other. This leads to a smooth variation of the bond angle θ(r) in the transient area between the surface domains with different bond orientations.
In addition, we studied the temperature dependence of the positional correlation length, which is coupled to the BO order parameters, and investigated the shape of the diffraction peaks in the radial direction. The shape is affected by large-scale BO fluctuations in the vicinity of the phase transition. Our results support the validity of the MCST for all three compounds under study. We have confirmed experimentally the value of the first order correction term in the scaling relation of the BO order parameters that was predicted by the MCST. We have shown that the number and magnitude of successive BO order parameters in the Hex-B phase are determined not only by the temperature range of the Hex-B phase, but primarily by the strength of interaction between the BO and positional order.
The temperature dependence of the BO order parameters in the vicinity of the Sm-A–Hex-B transition enables direct determination of the critical exponent β for the successive FCs. The values of β1 for the first harmonic of the BO order in all three compounds were found to be of the order of β1 ≈ 0.1. This value of the critical exponent β together with the large value of the heat capacity critical exponent α = 0.6–0.65 are in contradiction with the conventional 3D XY model. The proximity to a tricritical point is also inconsistent with our results. The higher order harmonics of the BO order scale as the powers of the first harmonic, with the exponent equal to the harmonic number. This indicates the nonlinear coupling of the BO order parameters of different orders. Currently none of the existing theories can describe the full set of experimental data related to the Sm-A–Hex-B transition in LCs.
Our experiments indicate that smectic liquid crystals provide definite examples of a 3D hexatic phase with the BO order. Despite the considerable theoretical effort, there is no full understanding yet regarding the mechanism of the crystal-Hex-B–Sm-A phase transitions. Thus, the development of a microscopic theory of the hexatic phase in LCs, which necessary includes the angular ordering of the pairs of molecules forming the sides of local hexagons (molecular bonds), is in high demand.
Acknowledgements
We acknowledge support to this project and discussions with E. Weckert. We are grateful to W. H. de Jeu and C. C. Huang for supplying us with the hexatic samples and fruitful discussions. Special thanks are due to E. I. Kats and V. E. Podnek for pointing our attention to Landau theory with nonlinear coupling of order parameters and useful discussions. We thank V. V. Lebedev, A. R. Muratov, E. S. Pikina and V. M. Kaganer for stimulating theoretical discussions. We are thankful to J. Thoen for his comments on the specific heat measurements in 65OBC liquid crystal. We acknowledge a careful reading of the manuscript by R. Gehrke. This work was partially supported by the Virtual Institute VH-VI-403 of the Helmholtz Association. The work of I. A. Z. and B. I. O. was partially supported by the Russian Science Foundation (Grant No. 14-12-00475).References
- B. I. Halperin and D. R. Nelson, Phys. Rev. Lett., 1978, 41, 121–124 CrossRef CAS.
- D. R. Nelson, Defects and Geometry in Condensed Matter Physics, Cambridge University Press, Cambrige, 2002 Search PubMed.
- C. A. Murray and D. H. Van Winkle, Phys. Rev. Lett., 1987, 58, 1200–1203 CrossRef CAS PubMed.
- R. E. Kusner, J. A. Mann, J. Kerins and A. J. Dahm, Phys. Rev. Lett., 1994, 73, 3113–3116 CrossRef CAS PubMed.
- P. Keim, G. Maret and H. H. von Grünberg, Phys. Rev. E: Stat., Nonlinear, Soft Matter Phys., 2007, 75, 031402 CrossRef CAS PubMed.
- D. C. Glattli, E. Y. Andrei and F. I. B. Williams, Phys. Rev. Lett., 1988, 60, 420–423 CrossRef CAS PubMed.
- C. A. Murray, P. L. Gammel, D. J. Bishop, D. B. Mitzi and A. Kapitulnik, Phys. Rev. Lett., 1990, 64, 2312–2315 CrossRef CAS PubMed.
- I. Guillamon, H. Suderow, A. Fernandez-Pacheco, J. Sese, R. Cordoba, J. M. De Teresa, M. R. Ibarra and S. Vieira, Nat. Phys., 2009, 5, 651–655 CrossRef CAS.
- R. Pindak, D. E. Moncton, S. C. Davey and J. W. Goodby, Phys. Rev. Lett., 1981, 46, 1135–1138 CrossRef CAS.
- J. D. Brock, A. Aharony, R. J. Birgeneau, K. W. Evans-Lutterodt, J. D. Litster, P. M. Horn, G. B. Stephenson and A. R. Tajbakhsh, Phys. Rev. Lett., 1986, 57, 98–101 CrossRef CAS PubMed.
- T. Stoebe, A. J. Jin, P. Mach and C. C. Huang, Int. J. Thermophys., 1995, 16, 33–43 CrossRef CAS.
- A. Aharony, R. J. Birgeneau, J. D. Brock and J. D. Litster, Phys. Rev. Lett., 1986, 57, 1012–1015 CrossRef CAS PubMed.
- W. H. de Jeu, B. I. Ostrovskii and A. N. Shalaginov, Rev. Mod. Phys., 2003, 75, 181–235 CrossRef CAS.
- C. Rosenblatt and J. T. Ho, Phys. Rev. A: At., Mol., Opt. Phys., 1982, 26, 2293–2296 CrossRef CAS.
- E. Górecka, L. Chen, W. Pyżuk, A. Krówczyński and S. Kumar, Phys. Rev. E: Stat. Phys., Plasmas, Fluids, Relat. Interdiscip. Top., 1994, 50, 2863–2867 CrossRef.
- C. C. Huang, J. M. Viner, R. Pindak and J. W. Goodby, Phys. Rev. Lett., 1981, 46, 1289–1292 CrossRef CAS.
- H. Haga, Z. Kutnjak, G. S. Iannacchione, S. Qian, D. Finotello and C. W. Garland, Phys. Rev. E: Stat. Phys., Plasmas, Fluids, Relat. Interdiscip. Top., 1997, 56, 1808–1818 CrossRef CAS.
- B. Van Roie, K. Denolf, G. Pitsi and J. Thoen, Eur. Phys. J. E: Soft Matter Biol. Phys., 2005, 16, 361–364 CrossRef CAS PubMed.
- F. Mercuri, S. Paoloni, M. Marinelli, R. Pizzoferrato and U. Zammit, J. Chem. Phys., 2013, 138, 07490 CrossRef PubMed.
- H. E. Stanley, Introduction to Phase Transitions and Critical Phenomena, Oxford University Press, New York, 1987 Search PubMed.
- A. Pelissetto and E. Vicari, Phys. Rep., 2002, 368, 549–727 CrossRef CAS.
- R. P. Kurta, B. I. Ostrovskii, A. Singer, O. Y. Gorobtsov, A. Shabalin, D. Dzhigaev, O. M. Yefanov, A. V. Zozulya, M. Sprung and I. A. Vartanyants, Phys. Rev. E: Stat., Nonlinear, Soft Matter Phys., 2013, 88, 044501 CrossRef CAS PubMed.
- I. A. Zaluzhnyy, R. P. Kurta, E. A. Sulyanova, O. Y. Gorobtsov, A. G. Shabalin, A. V. Zozulya, A. P. Menushenkov, M. Sprung, B. I. Ostrovskii and I. A. Vartanyants, Phys. Rev. E: Stat., Nonlinear, Soft Matter Phys., 2015, 91, 042506 CrossRef CAS PubMed.
- P. Wochner, C. Gutt, T. Autenrieth, T. Demmer, V. Bugaev, A. D. Ortiz, A. Duri, F. Zontone, G. Grübel and H. Dosch, Proc. Natl. Acad. Sci. U. S. A., 2009, 106, 11511–11514 CrossRef CAS PubMed.
- M. Altarelli, R. P. Kurta and I. A. Vartanyants, Phys. Rev. B: Condens. Matter Mater. Phys., 2010, 82, 104207 CrossRef.
- R. P. Kurta, M. Altarelli and I. A. Vartanyants, Adv. Condens. Matter Phys., 2013, 2013, 959835 Search PubMed.
- R. P. Kurta, L. Grodd, E. Mikayelyan, O. Y. Gorobtsov, I. A. Zaluzhnyy, I. Fratoddi, I. Venditti, M. V. Russo, M. Sprung, I. A. Vartanyants and S. Grigorian, Phys. Chem. Chem. Phys., 2015, 17, 7404–7410 RSC.
- M. A. Schroer, C. Gutt, F. Lehmkühler, B. Fischer, I. Steinke, F. Westermeier, M. Sprung and G. Grübel, Soft Matter, 2015, 11, 5465–5472 RSC.
- R. P. Kurta, M. Altarelli and I. A. Vartanyants, Adv. Chem. Phys., John Wiley & Sons, Inc., 2016, vol. 161, ch. 1, pp. 1–39 Search PubMed.
- I. A. Zaluzhnyy, R. P. Kurta, A. P. Menushenkov, B. I. Ostrovskii and I. A. Vartanyants, Phys. Rev. E, 2016, 94, 030701(R) CrossRef PubMed.
- R. Geer, T. Stoebe and C. C. Huang, Phys. Rev. E: Stat. Phys., Plasmas, Fluids, Relat. Interdiscip. Top., 1993, 48, 408–427 CrossRef CAS.
- W. Pyżuk, A. Krówczyński, J. Szydłsowska and E. Górecka, Liq. Cryst., 1995, 19, 85–91 CrossRef.
- R. Bruinsma and G. Aeppli, Phys. Rev. Lett., 1982, 48, 1625–1628 CrossRef CAS.
- M. Cheng, J. T. Ho, S. W. Hui and R. Pindak, Phys. Rev. Lett., 1988, 61, 550–553 CrossRef CAS PubMed.
- C.-F. Chou, J. T. Ho, S. W. Hui and V. Surendranath, Phys. Rev. Lett., 1996, 76, 4556–4559 CrossRef CAS PubMed.
- C.-F. Chou, J. T. Ho and S. W. Hui, Phys. Rev. E: Stat. Phys., Plasmas, Fluids, Relat. Interdiscip. Top., 1997, 56, 592–594 CrossRef CAS.
- M. Veum, C. C. Huang, C. F. Chou and V. Surendranath, Phys. Rev. E: Stat. Phys., Plasmas, Fluids, Relat. Interdiscip. Top., 1997, 56, 2298–2301 CrossRef CAS.
- R. J. Birgeneau and J. D. Litster, J. Phys., Lett., 1978, 39, 399–402 CrossRef CAS.
- G. Aeppli and R. Bruinsma, Phys. Rev. Lett., 1984, 53, 2133–2136 CrossRef CAS.
- R. Bruinsma and D. R. Nelson, Phys. Rev. B: Condens. Matter Mater. Phys., 1981, 23, 402–410 CrossRef CAS.
- S. C. Davey, J. Budai, J. W. Goodby, R. Pindak and D. E. Moncton, Phys. Rev. Lett., 1984, 53, 2129–2132 CrossRef CAS.
- T. Stoebe and C. C. Huang, Int. J. Mod. Phys. B, 1995, 9, 2285–2319 CrossRef CAS.
- J. V. Selinger and D. R. Nelson, Phys. Rev. Lett., 1988, 61, 416–419 CrossRef PubMed.
- A. Aharony and M. Kardar, Phys. Rev. Lett., 1988, 61, 2855–2858 CrossRef PubMed.
- M. Paczuski and M. Kardar, Phys. Rev. Lett., 1988, 60, 861 CrossRef CAS PubMed.
- R. P. Kurta, M. Altarelli, E. Weckert and I. A. Vartanyants, Phys. Rev. B: Condens. Matter Mater. Phys., 2012, 85, 184204 CrossRef.
- R. Geer, T. Stoebe, C. C. Huang, R. Pindak, G. Srajer, J. W. Goodby, M. Cheng, J. T. Ho and S. W. Hui, Phys. Rev. Lett., 1991, 66, 1322–1325 CrossRef CAS PubMed.
- T. Stoebe, R. Geer, C. C. Huang and J. W. Goodby, Phys. Rev. Lett., 1992, 69, 2090–2093 CrossRef CAS PubMed.
- W. H. de Jeu, A. Fera, O. Konovalov and B. I. Ostrovskii, Phys. Rev. E: Stat., Nonlinear, Soft Matter Phys., 2003, 67, 020701 CrossRef PubMed.
- C.-Y. Chao, C.-F. Chou, J. T. Ho, S. W. Hui, A. Jin and C. C. Huang, Phys. Rev. Lett., 1996, 77, 2750–2753 CrossRef CAS PubMed.
- I. A. Zaluzhnyy, R. P. Kurta, A. P. Menushenkov, B. I. Ostrovskii and I. A. Vartanyants, Mol. Cryst. Liq. Cryst., 2017 DOI:10.1080/15421406.2017.1289582.
- J. Brock, D. Noh, B. McClain, J. Litster, R. Birgeneau, A. Aharony, P. Horn and J. Liang, Z. Phys. B: Condens. Matter, 1989, 74, 197–213 CrossRef CAS.
- J. D. Brock, R. J. Birgeneau, D. Litster and A. Aharony, Contemp. Phys., 1989, 30, 321–335 CrossRef CAS.
- Private communication with V. Podnek and E. Kats.
- M. A. Anisimov, P. E. Cladis, E. E. Gorodetskii, D. A. Huse, V. E. Podneks, V. G. Taratuta, W. van Saarloos and V. P. Voronov, Phys. Rev. A: At., Mol., Opt. Phys., 1990, 41, 6749–6762 CrossRef CAS.
- F. Y. Wu, Rev. Mod. Phys., 1982, 54, 235–268 CrossRef.
- R. J. Baxter, Exactly Solved Models in Statistical Mechanics, Academic Press, London, 1982 Search PubMed.
- D. J. Bergman and B. I. Halperin, Phys. Rev. B: Solid State, 1976, 13, 2145–2175 CrossRef.
- M. A. de Moura, T. C. Lubensky, Y. Imry and A. Aharony, Phys. Rev. B: Solid State, 1976, 13, 2176–2185 CrossRef.
- E. I. Kats, V. V. Lebedev and A. R. Muratov, Phys. Rev. E, 2016, 93, 062707 CrossRef CAS PubMed.
Footnotes |
| † Present address: Department of Physics, University of California-San Diego, La Jolla, California 92093-0319, USA. |
| ‡ Present address: European XFEL GmbH, Holzkoppel 4, D-22869 Schenefeld, Germany. |
| This journal is © The Royal Society of Chemistry 2017 |