 Open Access Article
Creative Commons Attribution 3.0 Unported Licence
Oil-in-water microfluidics on the colloidal scale: new routes to self-assembly and glassy packings
Max
Meissner
 *ab,
Jun
Dong
ab,
Jens
Eggers
c,
Annela M.
Seddon
abd and
C. Patrick
Royall
abef
aH.H. Wills Physics Laboratory, University of Bristol, Bristol, BS8 1TL, UK. E-mail: M.Meissner@Bristol.ac.uk
bCentre for Nanoscience and Quantum Information, Tyndall Avenue, Bristol, BS8 1FD, UK
cMathematics Department, University of Bristol, BS8 1TW, Bristol, UK
dBristol Centre for Functional Nanomaterials, University of Bristol, Bristol, BS8 1TL, UK
eChemistry Department, University of Bristol, Bristol, BS8 1TS, UK
fDepartment of Chemical Engineering, Kyoto University, Kyoto 615-8510, Japan
First published on 22nd December 2016
Abstract
We have developed norland optical adhesive (NOA) flow focusing devices, making use of the excellent solvent compatibility and surface properties of NOA to generate micron scale oil-in-water emulsions with polydispersities as low as 5%. While current work on microfluidic oil-in-water emulsification largely concerns the production of droplets with sizes on the order of 10s of micrometres, large enough that Brownian motion is negligible, our NOA devices can produce droplets with radii ranging from 2 μm to 12 μm. To demonstrate the utility of these emulsions as colloidal model systems we produce fluorescently labelled polydimethylsiloxane droplets suitable for particle resolved studies with confocal microscopy. We analyse the structure of the resulting emulsion in 3D using coordinate tracking and the topological cluster classification and reveal a new mono-disperse thermal system.
1 Introduction
The vast majority of work on colloidal systems concerns itself either with the study of solid particles, for example solid colloidal spheres, or with emulsions, where an oil phase is dispersed in an aqueous medium or vice versa.1 Emulsions, with their multitude of fundamental science, as well as industrial applications in the fields of food, care product, and petrochemical products,2,3 are a system of great scientific and industrial interest. For solid colloidal spheres, unsurprisingly, the ratio of particle viscosity to the suspending fluid viscosity, λ = ηo/ηi, will tend towards infinity. On the other hand emulsions are much “softer” with viscosity ratios λ much closer to 1. This allows emulsion droplets to function as exciting new colloidal model systems, with examples relevant to our interests including work done by Scheffold et al.4 and Zhang et al.5 showing excellent agreement of emulsions with simulations of glassy systems. Additionally, emulsion droplets have negligible friction at their surfaces with intriguing consequences for the jamming-glass crossover,6,7 alternatively, while the ease of adsorption of lipids or polymers onto droplets opens new and exciting directions in self-assembly.8–12Given the considerable amount of interest in emulsions, it should come as no surprise that the formation of emulsions is a well explored field with a huge range of emulsification techniques available. These methods include such techniques as mechanical milling, blending, high pressure homogenization, or shear mixing. While powerful, these techniques tend to produce large emulsion droplets, or emulsions with a broad size distribution. Microemulsions on the other hand, while extremely versatile due to their self assembly behaviour, have sizes in the range of 10–100 nm, and are thereby far too small for real space imaging and coordinate tracking.13 An emulsion that combines the best of both worlds possessing both an average droplet size in the range of a few microns, with a narrow size distribution, would open up a wide range of new possibilities.
An alternative to the aforementioned methods is microchannel emulsification, a versatile technique where two or more distinct fluid phases are flowed through a microscale channel and interfacial stresses are induced to generate droplets with very narrow size distributions.14 Currently microfluidic emulsification techniques remain focussed primarily on the formation of water-in-oil emulsions, usually with the viscosity ratio λ below 1.
In order to develop the desired colloidal model system we must first consider the behaviour of a droplet in solution using the Peclet number Pe = τB/τsed. Here this dimensionless parameter is the ratio between the time it takes for a particle to diffuse its own radius, τB = σ3πη/8kBT, where σ is the particle diameter η is the solution viscosity and T is the temperature, and the time the particle takes to sediment by its diameter, τsed = σ/vsed, where vsed is the sedimentation velocity vsed = δmg/3πησH, where δm is the bouyant mass and σH the hydrodynamic diameter. A Peclet number of around one is generally seen as the dividing line between a colloidal system and an athermal granular system.15 As the Peclet number scales with both particle diameter, and particle-solution density difference, a colloidal emulsion can be achieved either by producing droplets of a sufficiently small diameter or by using liquids with similar densities.16 As such, it is vital that a microfluidic system for the production of colloidal oil-in-water emulsions is capable of both producing droplets which are suitably small and uniform, but also to be solvent-compatible enough to produce emulsions from a range of component materials.
Microfluidic droplet generation can be realised with three types of device: T-junction devices where a slug of the dispersed phase is extruded into a flowing fluid until the dispersed phase fluid breaks up into droplets,17 co-flowing devices where an outer continous phase fluid flows parallel to and surrounding an inner dispersed phase fluid until droplet generation occurs via stretching of the interface between the two fluids,18 and flow-focusing devices, where co-flowing streams are forced through a narrow aperture causing droplet breakup.19 Here we consider flow-focusing devices, as these provide the best system for producing droplets with sizes smaller than those of the channel dimensions.
However, producing suitable oil-in-water emulsions via microfluidic methods remains challenging. The vast majority of microfluidic emulsification systems are manufactured using polydimethylsiloxane (PDMS). While PDMS is an excellent material for water-in-oil microfluidics20 offering good solvent compatibility, good optical transmittivity, high flexibility and great durability, it is also strongly hydrophobic, preventing the stable formation of oil-in-water droplets.21 Although techniques for making PDMS devices hydrophilic and thereby allowing stable droplet generation exist, these are either short lived such as plasma treatment22 or involve sequential surface coatings23 which are impractical for use with devices small enough to easily generate micron scale droplets.
Norland optical adhesives provide a viable alternative to PDMS for oil-in-water microfluidics24,25 allowing rapid templating of complex microchannels.26 Their rapid curing speed, alongside their durability, makes them ideal for pattern transfer from PDMS molds. Additionally, while natively more hydrophilic than PDMS, exposure to an Oxygen plasma forms a long-lasting hydrophilic surface, ideal for the formation of oil-in-water droplets.24 Here we introduce a microfluidic flow focussing system based on the use of NOA microfluidics for the generation of monodisperse oil in water emulsions which can produce droplets on the micron scale with polydispersities of below 5%. To demonstrate the utility of this technique, we use the topological cluster classification to investigate the higher order structure of a polydimethylsiloxane oil emulsion, and compare this to a simulated hard sphere system.
This paper is organised as follows. In Section 2 first we describe the micro-fabrication and polymer casting process of the Norland flow-focusing devices used. In the same section we briefly describe the flow focusing process used to generate micron scale emulsions and the confocal microscopy and coordinate tracking techniques. The topological cluster classification algorithm is used to analyse the structure of the resulting packings.27 In Section 3 we describe the droplets produced and demonstrate the excellent size selectivity of this method by varying flow rates at various viscosity ratios. We then describe the structural insights obtained from using the topological cluster classification algorithm for probing the structure of an emulsion, and our results are compared to a simulated hard sphere system. Finally, we briefly summarise our work and the scientific implications thereof in Section 4.
2 Materials and methods
2.1 Imaging
Microfluidic droplet formation was imaged using a Leica DMI 3000B Brightfield microscope. High speed droplet production was imaged using exposure times of 250 μs. Confocal microscopy15,28,29 was employed to obtain 3-dimensional images of an emulsion filled glass capillary. The imaged region consisted of N ≈ 3 × 10³ polydimethylsiloxane (PDMS) droplets within an area of cross section 129 μm by 129 μm with a vertical height of 60 μm. The entire region was imaged with a LEICA SP8 confocal microscope with an excitation wavelength of 485 nm.2.2 Microfluidic device fabrication
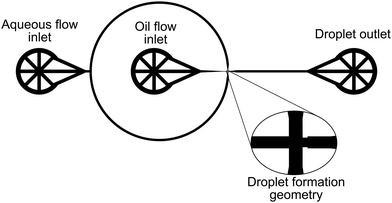
Device patterns shown in Fig. 1 were etched on to silicon wafers using standard photolithographic methods. Etched wafers were treated with trichloro(1H,1H,2H,2H-perfluorooctyl) silane to allow easy siloxane lift-off. Sylgard 184 Silicone elastomer was poured on the silicon wafers, degassed under vacuum, and heat cured at 60 °C for 6 hours. PDMS layers were removed from the silicon wafer, thoroughly cleaned with deionised water and ethanol. Norland optical adhesive (NOA) 81 was poured onto the prepared PDMS pattern and cured under 365 nm UV radiation for 30 minutes. Tubing connections were drilled into the NOA chips, and the drilled chips were cleaned with ethanol and deionised water. NOA channels were made hydrophilic by exposing the device layer to a 100 W oxygen plasma for 60 seconds, and the channel geometry was enclosed by sealing the NOA chip with a thin layer of NOA produced by pressing several droplets of NOA between two clean sheets of PDMS and UV curing for 2 minutes. Once enclosed, the microfluidic channels were heat treated for 1 hour at 60 °C, before a final treatment for 2 hours using 365 nm UV radiation.2.3 Droplet formation
Flow rate tests were carried out by connecting the assembled NOA chip to a nitrogen driven pressure pump (Fluigent MFCS) with polyethylene tubing. 16 mmol sodium dodecyl sulphate (SDS) aqueous solution was used as the continuous phase, and pressure and flow rate were controlled using MaesFlo 3.2 software (Fluigent, Paris, France). Flow rates were adjusted until the oil flow was stable and producing droplets. Once stable droplet formation was achieved, flow rate ratios were adjusted throughout the experimental range. Viscosity ratio measurements were carried out by varying both the oil phase used, as well as the viscosity of the aqueous phase. The liquid combinations used were an 80/20 cis-decalin/Cyclohexyl Bromide (CHB) mix with 16 mmol SDS in deionised water, an 80/20 cis-decalin/CHB mix with 16 mmol SDS in a 1![[thin space (1/6-em)]](https://www.rsc.org/images/entities/char_2009.gif) :
:![[thin space (1/6-em)]](https://www.rsc.org/images/entities/char_2009.gif) 1 mix of deionised water and glycerol, and dodecane with 16 mmol SDS deionised water (Table 1).
1 mix of deionised water and glycerol, and dodecane with 16 mmol SDS deionised water (Table 1).
| Oil phase | Aqueous phase | η o/ηi |
|---|---|---|
80![[thin space (1/6-em)]](https://www.rsc.org/images/entities/char_2009.gif) : :![[thin space (1/6-em)]](https://www.rsc.org/images/entities/char_2009.gif) 20 cis-decalin/bromocyclohexane 20 cis-decalin/bromocyclohexane |
Deionised water | 0.3 |
80![[thin space (1/6-em)]](https://www.rsc.org/images/entities/char_2009.gif) : :![[thin space (1/6-em)]](https://www.rsc.org/images/entities/char_2009.gif) 20 cis-decalin/bromocyclohexane 20 cis-decalin/bromocyclohexane |
50![[thin space (1/6-em)]](https://www.rsc.org/images/entities/char_2009.gif) : :![[thin space (1/6-em)]](https://www.rsc.org/images/entities/char_2009.gif) 50 deionised water/glycerol 50 deionised water/glycerol |
1.5 |
| Dodecane | 50![[thin space (1/6-em)]](https://www.rsc.org/images/entities/char_2009.gif) : :![[thin space (1/6-em)]](https://www.rsc.org/images/entities/char_2009.gif) 50 DIW/glycerol 50 DIW/glycerol |
3.8 |
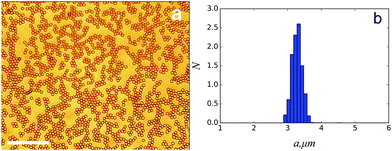
Droplets were subsequently collected by allowing stable droplet collection to proceed long enough to drive the produced emulsion into a 1 ml Eppendorf vial, transferred into a glass capillary and imaged on a Leica brightfield microscope. Droplet sizing was carried out as shown in Fig. 3(a) where the size was taken directly from the image.
For the purpose of analysis using the topological cluster classification (TCC) analysis, droplets were produced as above using a system of 5 cP polydimethylsiloxane oil dyed with Nile red as the oil phase and 32 mmol sodium dodecyl sulfate solution as the aqueous phase. Produced droplets were then collected and diluted with 50% by weight glycerol in order to match refractive indices between the aqueous and non-aqueous phases. The index matched emulsion was filled into a capillary and imaged using confocal laser scanning microscopy on a Leica confocal microscope. A 512 × 512 × 256 pixel image was taken and coordinate tracking was carried out using the Colloids particle tracking package,30 this tracking method identifies particle centres by searching for a Gaussian of the image intensity and produces XYZ coordinates for each detected particle. XYZ coordinates of particle centers were used to calculate a 3D g(r) and the Topological Cluster Classification (TCC) was used to interpret cluster populations.31
2.4 Topological cluster classification
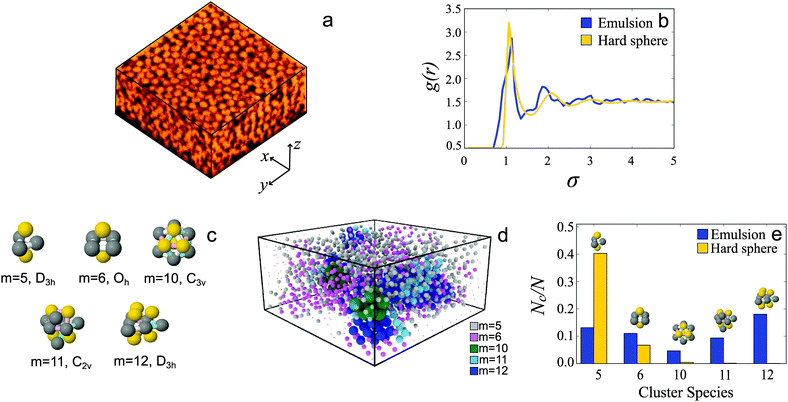
The Topological cluster classification (TCC) algorithm works by searching for a configuration of particles with a bond network identical to that found in a corresponding minimum free energy cluster of up to 15 particles in a bulk assembly of spheres.32 By indentifying clusters related to specific interaction potentials, the TCC provides a direct link between the interactions in the system and any structural ordering found. The algorithm functions as follows: first the neighbors of each particle are identified, then the network of particles and neighbors is searched for rings of 3, 4, and 5 particles. From these rings a set of “basic-clusters” is identified, and distinguished by the number of particles that are common neighbors. Larger clusters are then identified by combining these basic clusters yielding structures with bond networks similar to the minimum energy clusters as pictured in Fig. 6(c).27 The emulsion droplet coordinates were analysed with the topological cluster classification. The resulting higher-order structure obtained in this way is compared against molecular dynamics simulations carried out in DynamO33 using previously established simulation parameters34 in a five-component hard sphere system with a polydispersity of 5%, and volume fraction, ϕ = 0.42.3 Results and discussion
Droplet production was observed and investigated under a range of flow conditions, and a strong size scaling between droplet size and flow rate ratio was observed. This relationship held true for several different solvent systems of varying viscosity ratio λ. Droplet radius and flow rate ratio were compared and two separate droplet production modes, the geometry controlled and the dripping modes, were observed. By tuning the relative flow rates droplets of a desired size and quality were then collected. To demonstrate the utility of our emulsion system as a colloidal model system, coordinate tracking and topological cluster classification analysis was carried out on it. This analysis showed a large fraction of the emulsion droplets were identified in clusters of 11 and 12 particles. This indicates that the emulsion has a higher order structure distinct from structure comparable to a fluid of hard spheres whose higher order structure is comprised of 10 membered defective icosahedra31,34,35 in marked contrast to the similar pair correlation at the same volume fraction.3.1 Droplet production
Droplet formation proceed in a stable manner at values of the flow rate ratios of the outer phase to the inner phase, Qo/Qi, between of 1 to 60, outside of this range droplet formation is inhibited either by dewetting of the outer phase, or by channel filling of the inner phase.Within this range of Qo/Qi the formation of droplets was observed via two distinct mechanisms. Droplet formation in a microfluidic device is governed by three main parameters, the flow rate ratio Qo/Qi, the ratio of the outer and inner fluid viscosities λ = ηo/ηi, and the capillary number Ca = ηoGa0/γ where G is a characteristic deformation rate and ao is the characteristic droplet radius. Of particular importance here is the capillary number, a parameter influenced by the geometry of the device as well as the flow rate of the fluid being considered.36 Depending on the capillary number and thereby the flow rate ratio Qo/Qi, it is possible to select between two separate modes of droplet production. At lower capillary numbers, of order 10−2, geometry controlled droplet formation occurs as shown in Fig. 2(a). In this mode the fluid interface stretches through the aperture and obstructs, leading to a pressure spike followed by droplet breakup. For this mode a weak scaling with flow rate is expected and droplet size is roughly the same as the channel geometry.37 At higher values of the flow rate ratio Qo/Qi, with capillary number of order 10−1 this geometry controlled mode gives way to the dripping mode of droplet formation as shown in Fig. 2(b). The fluid interface in a dripping microfluidic device narrows into a fluid tendril, with the droplet “snap-off” point remaining stationary and within the constricting aperture. This mode of formation yields droplets smaller than the device geometry.38
Once a stable formation regime was established, an emulsion produced at a fixed Qo/Qi value of 40 was collected on the millilitre scale. Droplets produced in this way are shown in Fig. 3 with a polydispersity, here defined as the relative standard deviation, of 5%.
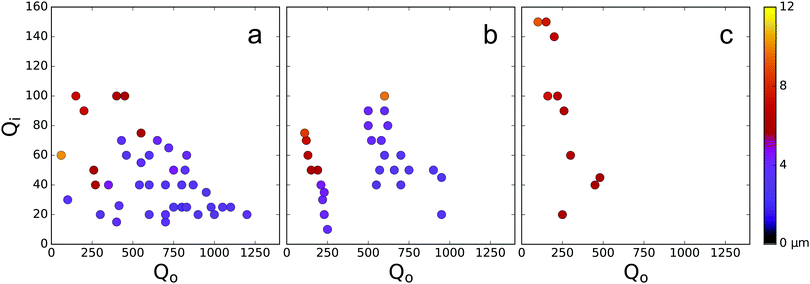
Varying the viscosity ratio of the outer to inner phase, ηo/ηi, lead to some striking differences in droplet production. At a low value ηo/ηi of 0.3, droplet production was stable throughout the largest range of flow rates, with droplet size scaling inversely with flow rate as shown in Fig. 4(a). At a value of ηo/ηi of 1.5, stable droplet formation was found to occur in a much narrower band of Qo/Qi, in particular droplet formation also seemed to proceed via two methods depending on the total net flow rate as shown in Fig. 4(b) this striking difference between two methods of flow seems to suggest a switch between two different modes of droplet behaviour. Finally, at a value of ηo/ηi of 3.8, droplet formation was highly unstable, and droplets produced were twice as large as at lower flow rates, with average radii above 6 μm. Surprisingly we find that droplet formation proceeds in a more stable manner at lower values of Qo/Qi, with only a small trade off in droplet size.
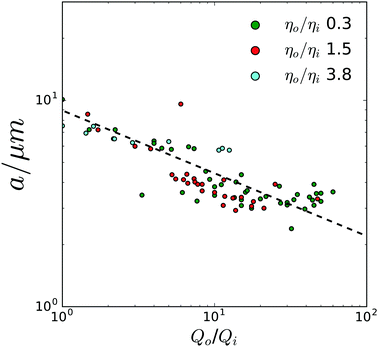
As shown in Fig. 4 and 5 our microfluidic system demonstrates a high degree of versatility in the size of droplets produced. By varying Qo/Qi, a wide range of droplet sizes was produced with excellent size selectivity. Droplets produced ranged in radius from 2 μm to 12 μm and droplet size was observed to be in good agreement with predictions by Garstecki et al.37 as shown by the linear scaling of the log–log plot of droplet diameter, σ and the flow rate ratio Qo/Qi in Fig. 5 suggesting a dripping mode of droplet production.
3.2 Emulsion structure
To characterise the structure of the emulsion we begin by comparing the pair correlation function g(r) of the emulsion system with hard spheres at the same volume fraction, ϕ = 0.42. The hard sphere system has a polydispersity of 5%. We see that both g(r) are similar, indicating that, at the level of two-point correlations, the emulsions are comparable to hard spheres.In the case of higher-order structural measures, beyond the two-point correlations, in a dense assembly of spheres tetrahedra and consequently five membered clusters consisting of two tetrahedra are rapidly formed, with particles arranged as members of these locally favoured structures having lower potential energies and slower dynamics.34,35 The clusters prevalent in our system are shown in Fig. 6(c). In Fig. 6(d) we render droplet coordinates coloured according to the identities of the clusters in which they are found. Organisation of these tetrahedra into larger clusters can be suppressed due to dynamical arrest with the system unable to reach an equilibrated configuration for which the formation of larger clusters is expected. Due to this gels and glasses, as well as athermal granular systems are dominated by tetrahedra, while dense systems which are thermal, and in which reorganisation can occur such as (supercooled liquids) would be dominated by higher membered clusters.39,40 Here the hard spheres have a volume fraction of ϕ = 0.42, which is not sufficiently dense to be supercooled and in fact the most prevalent structures found by the TCC are smaller m = 5, 6 clusters [Fig. 6(e), yellow]. On the other hand, in our emulsion system we see significantly more m = 12 and m = 11 structures, where m is the number of particles in the structure, than m = 5 structures [Fig. 6(e), blue]. Such larger membered clusters suggest that our system is a thermal system analogous to a supercooled liquid.34 This moreover shows that the higher order structure is rather distinct from that of supercooled liquids hard spheres (formed at higher ϕ ≳ 0.56) which are dominated by 10-membered defective icosahedra.31,34,35 This suggests that the emulsion system exhibits an interaction potential very distinct to that of hard spheres. This could arise via two main routes. Firstly, as sodium dodecyl sulphate was used to stabilise the droplets, the emulsion droplets will be charge stabilised. A potential consequence of this charge stabilisation is a higher effective volume fraction, and thereby increased higher order structure in the emulsion. Note in particular that electrostatic effects can lead to slow dynamics at volume fractions that would otherwise be fluid.41,42 Secondly, the increased prevalence of higher order structures could arise through deformation of the droplets allowing rearrangement towards higher order clusters. Due to their small size, the Laplace pressure within the droplets prevents significant deformation, nevertheless, the droplets are intrinsically more deformable than a comparable “hard sphere” system.
4 Conclusions
In this work we have demonstrated a powerful and versatile microfluidic droplet generator for the production of oil-in-water emulsions, and shown that this system produces droplets of a wide range of sizes with very low polydispersity. By utilising the favourable mechanical and surface chemical properties of Norland optical adhesives we open up a new and promising parameter space for studying colloidal systems with carefully tuned chemistry and viscosity ratios. We demonstrate the potential of this system as a colloidal model system by studying the arrangement of emulsion droplets with respect to locally favoured structures and as shown in Fig. 6(e) are able to obtain detailed information as to the local structure of a highly uniform emulsion. By comparing the population of m = 11, 12 clusters with respect to the hard spheres which at this volume fraction are dominated by small m = 5, 6 clusters, there is much more higher-order structure in the emulsion system. Moreover this higher order structure is distinct from the m = 10 defective icosahedra formed in hard spheres even at higher density. Thus the silicone oil emulsion is not dynamically arrested and capable of rearrangement, behaving much like a supercooled liquid with well-developed higher-order structure which is yet distinct from hard sphere supercooled liquids. We believe that this microfluidic system shows great potential as a powerful tool for studying exciting new colloidal behaviour, and in particular by carefully turning the microfluidic flow properties and the relative fluid densities the technique demonstrated here can allow the production of truly colloidal emulsions with tunable size, size distribution, and composition.Acknowledgements
The authors would like to thank Denis Bartolo, Oliver Dauchot, and Francesco Turci for many helpful discussions. M. M. acknowledges the EPSRC Doctoral training allowance EP/L504919/1, CPR acknowledges the Royal Society and Kyoto University SPIRITS fund for financial support, JD and CPR acknowledge the European Research Council (ERC consolidator grant NANOPRS, project number 617266), and JD acknowledges Bayer CropScience AG for financial support.References
- R. J. Hunter, Foundations of colloid science, Oxford University Press, 2001 Search PubMed.
- C. Wibowo and K. M. Ng, AIChE J., 2001, 47, 2746–2767 CrossRef CAS.
- J. Ubbink, Faraday Discuss., 2012, 158, 9 RSC.
- F. Scheffold, F. Cardinaux and T. G. Mason, J. Phys.: Condens. Matter, 2013, 25, 502101 CrossRef CAS PubMed.
- C. Zhang, N. Gnan, T. G. Mason, E. Zaccarelli and F. Scheffold, 2016, arXiv:1605.01917, pp. 1–38.
- P. Charbonneau, J. Kurchan, G. Parisi, P. Urbani and F. Zamponi, Nat. Commun., 2014, 5, 3725 CAS.
- A. J. Liu and S. R. Nagel, Annu. Rev. Condens. Matter Phys., 2010, 1, 347–369 CrossRef.
- T. G. Mason, J. Bibette and D. A. Weitz, Phys. Rev. Lett., 1995, 75, 2051–2054 CrossRef CAS PubMed.
- L. Feng, L.-L. Pontani, R. Dreyfus, P. Chaikin and J. Brujic, Soft Matter, 2013, 9, 9816 RSC.
- S. J. Van Der Meulen and M. E. Leunissen, J. Am. Chem. Soc., 2013, 135, 15129–15134 CrossRef CAS PubMed.
- K. W. Desmond, P. J. Young, D. Chen and E. R. Weeks, Soft Matter, 2013, 9, 3424–3436 RSC.
- C. Zhang, C. B. O'Donovan, E. I. Corwin, F. Cardinaux, T. G. Mason, M. E. Mabius and F. Scheffold, Phys. Rev. E: Stat., Nonlinear, Soft Matter Phys., 2015, 91, 1–6 Search PubMed.
- J. Eastoe, M. H. Hatzopoulos and R. Tabor, Encyclopedia of Colloid and Interface Science, Springer, Berlin Heidelberg, 2013, pp. 688–729 Search PubMed.
- H. A. Stone and S. Kim, AIChE J., 2001, 47, 1250–1254 CrossRef CAS.
- A. Ivlev, H. Löwen, G. Morfill and C. P. Royall, Complex plasmas and colloidal dispersions: particle-resolved studies of classical liquids and solids, World Scientific, 2012, p. 320 Search PubMed.
- A. Wysocki, C. P. Royall, R. G. Winkler, G. Gompper, H. Tanaka, A. Van Blaaderen and H. Löwen, Soft Matter, 2008, 5, 4 Search PubMed.
- T. Thorsen, R. W. Roberts, F. H. Arnold and S. R. Quake, Phys. Rev. Lett., 2001, 86, 4163–4166 CrossRef CAS PubMed.
- A. M. Gañán-Calvo and J. M. Gordillo, Phys. Rev. Lett., 2001, 87, 274501 CrossRef PubMed.
- S. L. Anna, N. Bontoux and H. A. Stone, Appl. Phys. Lett., 2003, 82, 364–366 CrossRef CAS.
- J. C. McDonald and G. M. Whitesides, Acc. Chem. Res., 2002, 35, 491–499 CrossRef CAS PubMed.
- H. Makamba, J. H. Kim, K. Lim, N. Park and J. H. Hahn, Electrophoresis, 2003, 24, 3607–3619 CrossRef CAS PubMed.
- D. Bodas and C. Khan-Malek, Sens. Actuators, B, 2007, 123, 368–373 CrossRef CAS.
- W.-A. C. Bauer, M. Fischlechner, C. Abell and W. T. S. Huck, Lab Chip, 2010, 10, 1814 RSC.
- P. Wägli, A. Homsy and N. de Rooij, Sens. Actuators, B, 2011, 156, 994–1001 CrossRef.
- S. H. Kim, Y. Yang, M. Kim, S.-W. Nam, K.-M. Lee, N. Y. Lee, Y. S. Kim and S. Park, Adv. Funct. Mater., 2007, 17, 3493–3498 CrossRef CAS.
- D. Bartolo, G. Degré, P. Nghe and V. Studer, Lab Chip, 2008, 8, 274–279 RSC.
- A. Malins, J. Eggers, C. P. Royall, S. R. Williams and H. Tanaka, J. Chem. Phys., 2013, 138, 1–13 CrossRef PubMed.
- A. van Blaaderen and P. Wiltzius, Science, 1995, 270, 1177 CAS.
- U. Gasser, E. R. Weeks, A. Schofield, P. N. Pusey and D. A. Weitz, Science, 2001, 292, 258–262 CrossRef CAS PubMed.
- M. Leocmach and H. Tanaka, Soft Matter, 2013, 9, 1447–1457 RSC.
- C. P. Royall, S. R. Williams and H. Tanaka, Soft Condens. Matter, 2014, 12 Search PubMed.
- A. Malins, S. R. Williams, J. Eggers and C. P. Royall, J. Chem. Phys., 2013, 139, 234506 CrossRef PubMed.
- M. N. Bannerman, R. Sargant and L. Lue, J. Comput. Chem., 2011, 32, 3329–3338 CrossRef CAS PubMed.
- C. P. Royall, A. Malins, A. J. Dunleavy and R. Pinney, J. Non-Cryst. Solids, 2015, 407, 34–43 CrossRef CAS.
- C. P. Royall and W. Kob, Locally favoured structures and dynamic length scales in a simple glass-former, 2016 Search PubMed , arXiv:1611.03314.
- S. L. Anna, Annu. Rev. Fluid Mech., 2016, 48, 285–309 CrossRef.
- P. Garstecki, H. A. Stone and G. M. Whitesides, Phys. Rev. Lett., 2005, 94, 164501 CrossRef PubMed.
- S. L. Anna and H. C. Mayer, Phys. Fluids, 2006, 18, 121512 CrossRef.
- C. P. Royall, S. R. Williams, T. Ohtsuka and H. Tanaka, Nat. Mater., 2008, 7, 556–561 CrossRef CAS PubMed.
- J. Taffs, S. R. Williams, H. Tanaka and C. P. Royall, Soft Matter, 2013, 9, 297–305 RSC.
- C. Klix, C. P. Royall and H. Tanaka, Phys. Rev. Lett., 2010, 104, 165702 CrossRef PubMed.
- E. Zaccarelli, S. Andreev, F. Sciortino and D. R. Reichman, Phys. Rev. Lett., 2008, 100, 195701 CrossRef PubMed.
| This journal is © The Royal Society of Chemistry 2017 |

