
 Open Access Article
 This Open Access Article is licensed under a Creative Commons Attribution-Non Commercial 3.0 Unported Licence
Outflow and clogging of shape-anisotropic grains in hoppers with small apertures
A.
Ashour
ab,
S.
Wegner
a,
T.
Trittel
a,
T.
Börzsönyi
c and
R.
Stannarius
 *a
*a
aInstitute of Experimental Physics, Otto von Guericke University, 39106 Magdeburg, Germany. E-mail: ralf.stannarius@ovgu.de
bFaculty of Engineering and Technology, Future University, End of 90 St., New Cairo, Egypt
cInstitute for Solid State Physics and Optics, Wigner Research Center for Physics, Hungarian Academy of Sciences, P. O. Box 49, H-1525 Budapest, Hungary
First published on 16th November 2016
Abstract
Outflow of granular material through a small orifice is a fundamental process in many industrial fields, for example in silo discharge, and in everyday's life. Most experimental studies of the dynamics have been performed so far with monodisperse disks in two-dimensional (2D) hoppers or spherical grains in 3D. We investigate this process for shape-anisotropic grains in 3D hoppers and discuss the role of size and shape parameters on avalanche statistics, clogging states, and mean flow velocities. It is shown that an increasing aspect ratio of the grains leads to lower flow rates and higher clogging probabilities compared to spherical grains. On the other hand, the number of grains forming the clog is larger for elongated grains of comparable volumes, and the long axis of these blocking grains is preferentially aligned towards the center of the orifice. We find a qualitative transition in the hopper discharge behavior for aspect ratios larger than ≈6. At still higher aspect ratios >8–12, the outflowing material leaves long vertical holes in the hopper that penetrate the complete granular bed. This changes the discharge characteristics qualitatively.
I. Introduction
Granular materials, despite their importance in human civilization for millennia, lack a comprehensive physical description even today.1–4 Flowing grains form dissipative non-equilibrium systems that are still insufficiently understood. The study of hopper discharge of granular materials has an extensive history, and still remains an important research area, because the general understanding of that problem is far from being satisfactory. The granulate displays unusual physical properties. This is important particularly in view of the fact that storage, distribution and transport of products in granular form is an ubiquitous process in agriculture, mining, pharmacy and many other industrial branches. Even in everyday life one frequently has to deal with flow of grainy matter through small orifices, and one often has to cope with fluctuating outflow or clogging. Estimation of the container discharge rates from known grain and orifice geometries is possible only for special cases. Quantitative laws that describe such processes are often available only for spherical, some even only for monodisperse particles.The dynamics of granular flow through an orifice at the bottom of a silo has been studied in 2D and 3D, e.g. in ref. 5–57. It is generally established that for sufficiently large orifices, grains flow at a rather constant rate through the outlet. Semi-quantitative equations describe the flow rate (e.g.ref. 5–7 and references therein). However, when the diameter of the orifice is not much larger than the typical grain diameters, the flow will be arrested sooner or later by the formation of an arch (in 2D) or dome (in 3D) blocking the outlet. This process is seldom intended in applications, it is usually very undesired. Spontaneous arch formation,24,32 the preceding kinetics,33 as well as the inherent force distributions58,59 have been analyzed in the literature. Often, for simplicity, 2D or quasi-2D hopper geometries were employed.
To et al.42 studied experimentally the jamming of disks in a 2D hopper, they derived jamming probabilities that depend only on the width of the orifice and size of the grains, regardless of silo width. Spheres were studied by Janda et al.,17 with comparable results. At small orifice sizes (slightly larger than grain diameters), the probability of blocking the outflow is close to one for each particle passing the orifice. Avalanches get jammed after few grains. For large orifices, the jamming probability for each particle was found to approach zero.14,17,42 The term jamming was used in these publications. In the following, we will consistently refer to this process as clogging, since it is caused by local blocking of flow through the outlet. There are techniques to reduce the probability of clogging in 2D silos. An obstacle above the orifice at a specific position60 can increase the flow rate for small outlet sizes noticeably.28 As intuitively expected, vibrations during the discharge may increase the mean avalanche sizes as well.18
The breaking of arches is another process of interest for silo management: in practical grain processing, flow usually has to be restarted with appropriate measures. Mechanical properties of the clogs and methods to break them to reiterate the flow (vibration or tilting the container) were described in the literature (e.g.ref. 42–57).
These studies were performed almost exclusively for spherical (in 3D) or disk-shaped (in 2D) grains. However, it was pointed out earlier that particle shapes may have significant effects for both (i) silo discharge rates and (ii) distribution of particle alignment and clogging properties: the dependence of the silo discharge rate on the aspect ratio of the particles can be characterized using numerical (DEM) methods, as in this case one can easily keep the other parameters (particle volume, surface friction, etc.) the same. The aspect ratio dependence is very complex, as in 2D systems Cleary and Sawley found reduced flow rates for elongated particles with nonzero friction,61,62 while Langston found increased flow rates for elongated particles with zero friction63 compared to the case of circles. In 3D simulations Langston found the same flow rate for sphere and sphero-cylinders with zero friction,63 while Liu found a reduced flow rates for both prolate and oblate ellipsoids with nonzero friction.64 On the other hand, Li reported increased flow rates for oblate ellipsoids with nonzero friction.65.
Orientation effects of non-spherical particles were studied by Kanzaki et al.66 These show special flow structures in the hopper, and characteristic packing structures after partial discharge. Tang and Behringer67 studied the avalanches and clogging of elliptical particles in 2D. They used photoelastic materials and showed that the alignment of ellipses in the shear flow preceding the clog seems to be relevant for the structure of the arch and thus for clogging probabilities. We have recently demonstrated in 3D hopper experiments, employing X-ray tomography, that the shear flow during discharge has substantial impact on particle alignment.68 In that study, clogging was employed only as a precondition for the characterization of the static structures, but the conditions for the formation of clogs as well as the dynamics of the outflow were disregarded.
In the present study we characterize the flow of non-spherical grains of different shapes out of a 3D hopper. Our main goal is the identification of equivalent geometrical parameters that allow to compare flow and clogging properties with equations established for spherical grains. We focus on the influence of the aspect ratio of the grains. Spheres are compared to prolate ellipsoidal and cylindrical particles. We seek suitable definitions for equivalent radii to describe the hopper outflow statistics of anisometric grains. Two fundamental features will be analyzed: the mean flow rate during continuous discharge or during avalanches, and the distribution of avalanche sizes as well as the mean size of avalanches at given geometric parameters. In addition, we characterize the arrangement of the particles that form the blocking layer (dome) above the orifice. When forming a clog, the orientation of anisometric grains is expected to have a considerable influence. Thus, we compare clogs of prolate and spherical particles under the aspect of particle geometry and orientational ordering.
II. Models
Before our experiments are introduced, we recollect shortly the known characteristics of spherical grains: Beverloo6 established an equation for the relation between the diameter D = 2R of the orifice, the diameter d = 2r of spherical particles, and the material flow W out of a hopper: | (1) |
In this equation, k and C are dimensionless constants, ρb is the effective density of the granular material, and g is the gravitational acceleration. For 3D hoppers, n = 2. A fit value of k = 1.4 was given by Beverloo for spheres. For angular particles, it is slightly larger. C is of the order of 0.55…0.65, it represents the packing fraction ϕ of the grains. This relation is generally accepted today, but some refinements have been proposed. For example, the flow rates through small orifices were measured by Mankoc et al.16 They modified Beverloo's equations to fit data both for small and large orifices. More details are laid out in a recent review paper by Mort et al.69
Beverloo's equation is valid for different types of silos at different angles and diameters,27 and the flow rate increases geometrically with the orifice size.8 The equation is valid for continuous flow at large enough orifice sizes, but it also describes the discharge rate during individual avalanches. Thomas and Durian30,37 have confirmed in accurate experiments that for a given material and experimental geometry, the discharge rate can be fitted with the same parameters in the avalanche and free flow regimes. We will return to this issue later.
Another interesting aspect is the avalanche statistics and the mean avalanche size. These features have been studied by Zuriguel et al.,13 who measured avalanche distributions for spherical particles (and an experiment with elongated rice grains), and discussed the experimental data using an empirical fitting curve. The authors employed a power law model and suggested that the mean avalanche size 〈S〉 can be satisfactorily described by an equation
 | (2) |
The most important feature of eqn (2) is the parameter Rc, which has the meaning of a critical ratio of orifice and grain radii, where the mean avalanche sizes diverge. In this description, Rc divides a free flow regime from an avalanche regime. Zuriguel et al. reported a value of Rc ≈ 5 for spherical grains and 6.15 for rice grains. Evidently both k in eqn (1) and Rc in eqn (1) increase with the aspect ratio Q > 1 when particles of identical volumes are compared. Flow becomes slower for longer grains and clogging probabilities increase, two intuitively consistent phenomena. However, an attempt to relate both characteristics, k(Q) and Rc(Q), has not been made so far.
Recently, Thomas and Durian30,37 performed extensive sets of measurements and a critical analysis of the mean avalanche sizes and flow rates. They fitted their data by an exponential relation of the form
 | (3) |
Thomas and Durian also established that the mean flow rate does not change discontinuously during the transition from the free flow to the avalanche regime. Beverloo's equation was applicable in both regimes with the same parameters.
III. Materials, experimental methods and setup
A. Granular material
Typical granulates studied in this project are shown in Fig. 1. The most important parameter here to characterize the deviation from spherical shape is the aspect ratio Q, i.e. the ratio of the extensions of the particle along its rotational axis and perpendicular to it. We also introduce the equivalent radius req of a sphere with the same volume. As we will show below, this quantity may not be an adequate parameter to scale the clogging characteristics, but it may serve as a first approximation.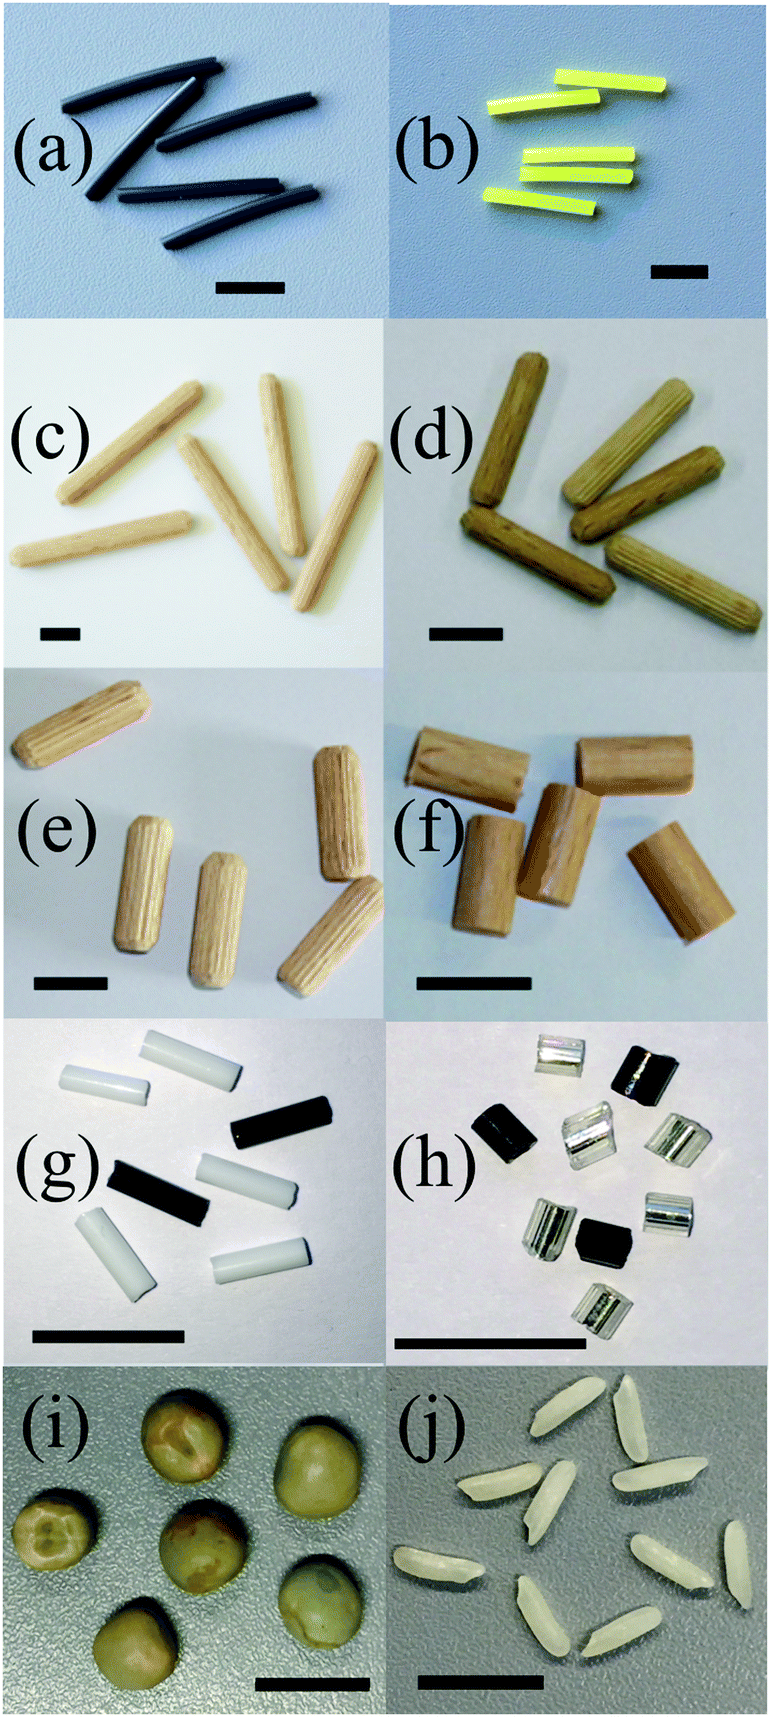 | ||
Fig. 1 Photographs of a selection of particles studied: plastic cylinders with (a) aspect ratio Q = ![[small script l]](https://www.rsc.org/images/entities/char_e146.gif) /d = 12, (b) Q = 8, wooden pegs with (c) Q = 8, (d) Q = 5, (e) Q = 3.3, (f) Q = 2, (g) glass cylinders with Q = 3.5, and (h) Q ≈ 1.2. (i) peas, and (j) rice grains. The horizontal black bars mark 1 cm. /d = 12, (b) Q = 8, wooden pegs with (c) Q = 8, (d) Q = 5, (e) Q = 3.3, (f) Q = 2, (g) glass cylinders with Q = 3.5, and (h) Q ≈ 1.2. (i) peas, and (j) rice grains. The horizontal black bars mark 1 cm. | ||
The following materials were used:
• plastic cylinders with length = 24 mm and diameter d = 2 mm, aspect ratio Q = /d = 12, equivalent radius req = 2.62 mm, (Fig. 1a),
• plastic cylinders with = 19.2 mm and d = 2.4 mm, Q = 8, req = 2.75 mm, (Fig. 1b),
• wooden pegs with cylinder shape and tapered ends, = 40 mm, d = 5 mm, Q = 8, req = 5.7 mm, (Fig. 1c),
• plastic cylinders with = 15 mm and d = 2.4 mm, Q = 6, req = 2.5 mm,
• wooden pegs with cylinder shape and tapered ends, = 25 mm, d = 5 mm, Q = 5, req ≈ 4.8 mm, (Fig. 1d),
• wooden pegs with cylinder shape and tapered ends, = 20 mm, d = 6 mm, Q ≈ 3.3, req ≈ 5.1 mm, (Fig. 1e),
• wooden pegs with cylinder shape, = 10 mm, d = 5 mm, Q = 2, req = 3.6 mm, (Fig. 1f),
• glass rods with cylinder shape, = 6.6 mm, d = 1.9 mm, Q = 3.5, req = 1.65 mm, (Fig. 1g),
• glass rods with cylinder shape, = 1.8…2.4 mm, d = 1.9 mm, Q = 1.2, req = 1.1 mm, (Fig. 1h),
• peas, nearly spherical, slightly polydisperse with mean diameter of 7.6 mm, standard deviation 0.23 mm, req = 3.8 mm, (Fig. 1i),
• rice grains ( ≈ 7.2 mm, d ≈ 2 mm) with aspect ratio Q ≈ 3.6 and req ≈ 1.5 mm, (Fig. 1j),
• perfectly spherical airsoft bullets, d = 2req = 6 mm.
In addition, a few preliminary experiments were performed with ellipsoidal chocolate lentils covered with hard icing (Piasten) with d = 18.5 mm and h = 8.3 mm, Q = 0.45, req = 7.0 mm.
It was technically not possible to use the same types of particles in both dynamical and X-ray studies. The X-ray tomography required larger particles because of limitations in spatial resolution. On the other hand, the flow experiments require large quantities (≈105) of grains that were not available for all materials studied here, and in addition would exceed weight limitations of the setup. Nevertheless, trends in the aspect ratio effects can be compared for different materials of similar aspect ratio.
B. Hopper setup
We use a 3D cylindrical silo with flat bottom (Fig. 2). In the center of the bottom, exchangeable plates with circular openings can be inserted, with radii R selectable in steps of 0.5 mm. We use a fixed silo geometry with a diameter much larger than the dimension of the particles, in order to minimize influences of the silo walls.11 A sufficiently large fill level is maintained during the discharge, to ensure that the flow rate remains constant.13 In the imaging experiments, the container was placed inside an X-ray computed tomograph (Siemens Artis Zeego, STIMULATE-lab, Otto von Guericke University, Magdeburg). For the dynamic and statistical experiments, the container was mounted above an electronic balance that measured the mass outflow vs. time m(t) (Fig. 2).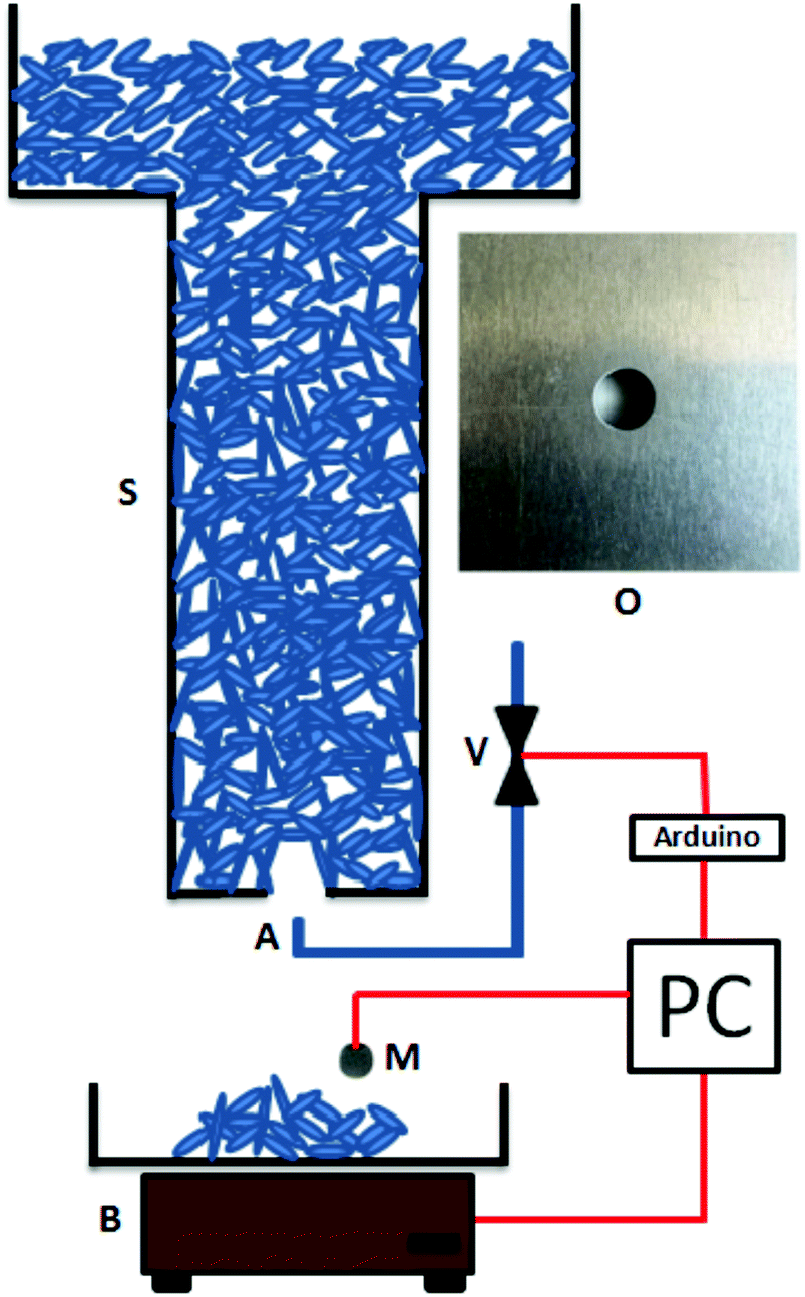 | ||
| Fig. 2 The experimental setup for dynamic and avalanche statistics measurements. S, silo; V, electronic valve; A, air jet; M, microphone; B, balance; O, orifice. | ||
Plateaus in the m(t) curve indicate clogged states. The process of particle outflow between successive clogs is denoted as an avalanche, the mass difference between successive clogged states (as measured by the balance) is the avalanche size. The mean flow rate during an avalanche can be determined from the ratio of avalanche sizes and durations. Problems related to the finite equilibration time of the balance were solved by acoustic detection of the avalanche duration (Appendix A).
After clogging, the next avalanche is triggered automatically. Below the silo, we placed an air pressure tube9 connected to an electronic valve. When the signal of the scale remains constant for 5 seconds, the computer triggers a short air pressure flush that destroys the dome above the orifice, starting the next avalanche.
A similar but less high hopper geometry (bucket of diameter 19 cm and height 21.4 cm, similar insets for variable orifices) was used to determine the structure of the dome by optical inspection (see below). In that case, a transparent container bottom was used. A commercial camera (Canon EOS 550) was positioned directly below the orifice each time after the outflow stopped.
C. X-ray computed tomography and data evaluation
X-ray tomographic experiments were performed with the same bucket as the optical measurements. For the preparation of the experiment, the silo outlet is closed first. Then the container is filled with the grains. The outlet sizes for the individual grain types are selected such that after the bottom hole is opened, the granulate flows out but clogs after a certain time. In this clogged state, an X-ray tomogram of the region around the silo outlet is recorded by means of the X-ray C-arm system Siemens Artis zeego. With a spatial resolution of 2.03 pixel per mm, we can record volumes of 25.2 cm × 25.2 cm × 19 cm. Thereafter, we identify the positions and orientations of the individual grains by means of a procedure described earlier68 from the tomograms. For each combination of apertures and grain types, 30 tomograms are averaged to get a reasonable statistics.IV. Results and discussion
A. Avalanche size distributions and mean sizes
First we consider the avalanche statistics. Avalanche sizes were determined for different orifice radii, where the number of grains S that flew out of the silo in each event was derived from the m(t) curve.For the statistical evaluation, it is necessary to know whether the individual avalanches represent independent events, i.e. whether the size of an avalanche is correlated with the previous event or not. This has been carefully checked by calculating the correlations of successive avalanche sizes Sn, with the result that such correlations can be excluded. This is illustrated in Fig. 3 where we plot the relation of sizes of subsequent avalanches.
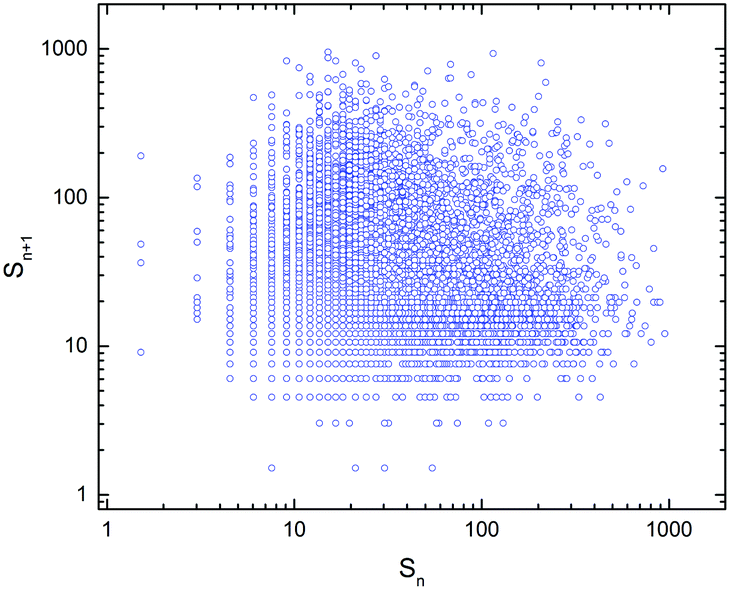 | ||
| Fig. 3 Test of the correlation between sizes of subsequent avalanches, cylindrical glass rods with aspect ratio Q = 3.5 at an orifice radius R = 5.7 mm. | ||
If the avalanches are stopped by a Poisson process, one can expect that the size distribution p(S) follows an exponential decay
| p(S) = (1/S0)·exp − S/S0 | (4) |
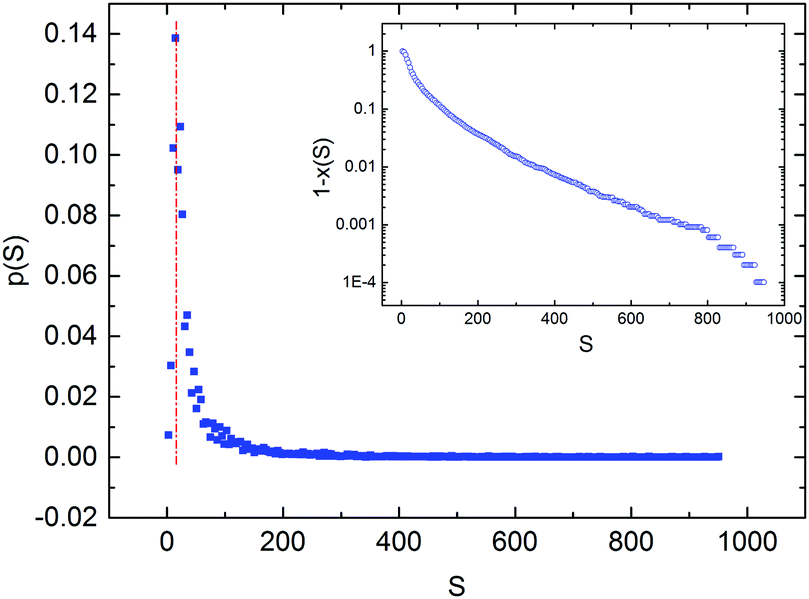 | ||
| Fig. 4 Probability of avalanches with size S for cylindrical glass rods with aspect ratio Q = 3.5 and orifice radius R = 5.7 mm. The inset shows the cumulative distribution of avalanches having larger sizes than S. | ||
One important peculiarity has to be mentioned before discussing the avalanche statistics: a transient behavior of particles with large aspect ratio after fresh filling of the hopper. This is shown exemplarily in Fig. 5. For spheres or grains with aspect ratios close to one, all avalanches recorded after the filling of the hopper are equivalent and can be used to construct the statistics. The figure demonstrates that for airsoft balls, typical m(t) graphs show no peculiarities at the beginning. This is different for long rods. There, the first couple of avalanches are very small, the m(t) curves start with very shallow slopes. The initial avalanches consist of only few grains. The reason is that the material is highly disordered after filling, and clogs are more probable. With progressing discharge, aligned grains flow down and reach the outlet. When the vicinity of the orifice is cleared from disordered material, the mean avalanche sizes increase considerably. In the following characterization of clogs and avalanche statistics, we excluded these transients.
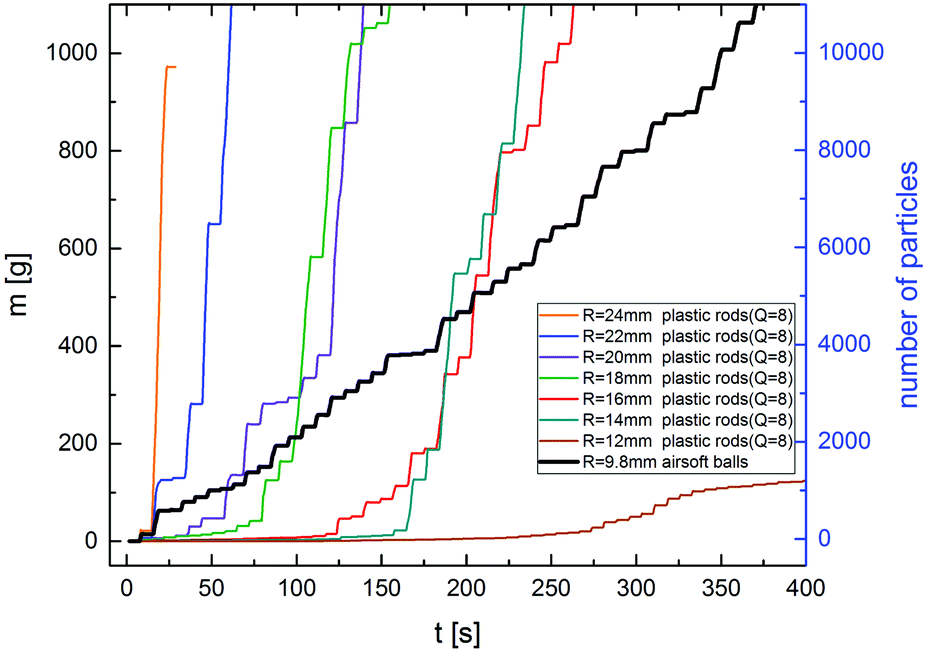 | ||
| Fig. 5 Plot of the cumulative discharged material during the first avalanches after hopper filling (plastic rods with Q = 8). Plateaus mark the clogged states between two avalanches. It is seen that the first avalanches are very small, they are formed by only few grains. Only after a sufficiently large number of grains has left the hopper (here, of the order of 30–50 g, i.e. a few hundred grains), the transient ends and ‘normal’ avalanche statistics set in. For comparison, the thick black curve shows a typical fresh discharge of spherical airsoft bullets, which starts without transient. | ||
After considering these details, we can discuss the mean avalanche size and the potential existence of a critical radius Rc. In a first approximation, we re-scale the radius R of the orifice, dividing it with the equivalent radius req of a sphere that has the same volume as the anisometric particle. Within experimental accuracy, our data can be fitted both by using eqn (2) and (3) satisfactorily, and we cannot discriminate the two models for any of the particles used. Fig. 6 shows a typical experimental data set (Q = 3.5 glass rods) together with the two fit curves. This means that within our study, we cannot discriminate between the two models. In the following, we will nevertheless refer to a ‘critical outlet size’ Rc. In the power law model of eqn (2), it has the meaning of a radius where the mean avalanche size diverges. In the exponential growth model of eqn (3) it corresponds to an orifice size where the mean avalanche size practically exceeds the capacity of our storage, say, the avalanche size reaches 100![[thin space (1/6-em)]](https://www.rsc.org/images/entities/char_2009.gif) 000 particles. The fitting parameters for the two equations are given in Table 1.
000 particles. The fitting parameters for the two equations are given in Table 1.
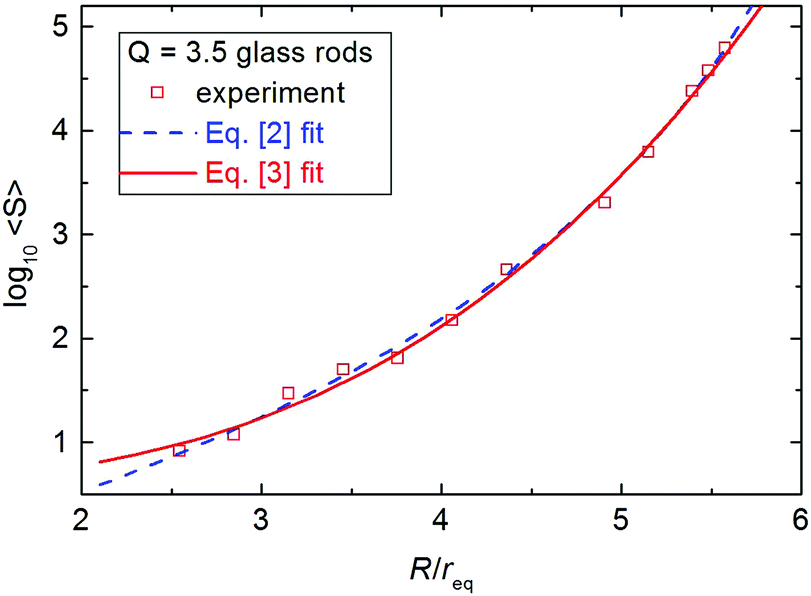 | ||
| Fig. 6 Mean avalanche size 〈S〉 vs. R/req for cylindrical glass rods with aspect ratio Q = 3.5. The blue line is a fit with eqn (2), the red line with eqn (3). Within the statistical accuracy of the data, these two models are indistinguishable. | ||
| Material | Q | R c | lnA |
lnc |
a | χ | Q 1/6 |
|---|---|---|---|---|---|---|---|
| Airsoft balls | 1 | 4.95 | 8.84 | 0.527 | 0.135 | 1 | 1 |
| Glass rods | 1.2 | 5.76 | 10.55 | 0.865 | 0.091 | 1.1 | 1.03 |
| Glass rods | 3.5 | 6.74 | 12.1 | 1.36 | 0.055 | 1.25 | 1.23 |
| Rice grains | 3.6 | 6.51 | 10.85 | 0.40 | 0.062 | 1.28 | 1.24 |
| Plastic rods | 6 | 12.3 | 16.3 | (0.48) | (0.015) | 1.5 | (1.34) |
| Plastic rods | 8 | 14.7 | 17.9 | (0.58) | (0.011) | 1.55 | (1.41) |
| Spheres13 | 1 | 4.94 | |||||
| Pasta13 | 1.05 | 5.03 | |||||
| Rice13 | 3.36 | 6.15 | |||||
The comparison of spherical grains with several cylindrical grain types of different aspect ratio and the more or less ellipsoidal rice grains with similar aspect ratio as one of the cylinders is depicted in Fig. 7.
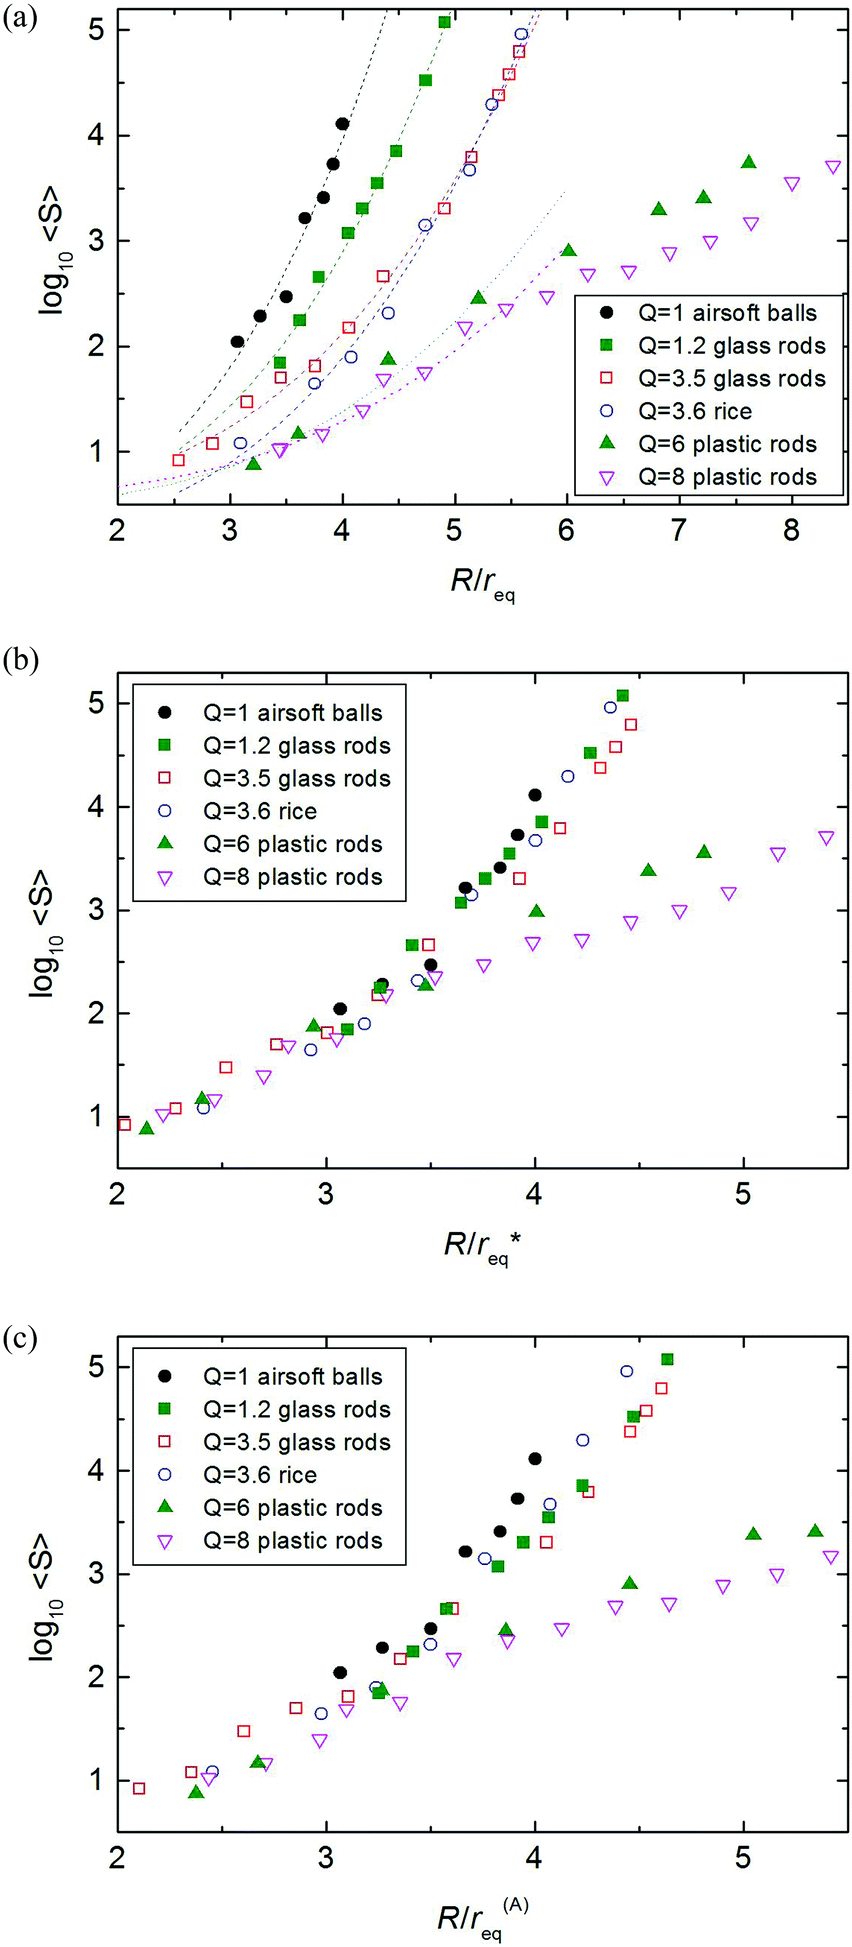 | ||
| Fig. 7 (a) Experimental result log10〈S〉 vs. R/req for particles with different aspect ratio. Dashed curves are fits with the eqn (3). For Q ≥ 6 plastic rods, we have used only the small orifice data up to R/req < 5 for the fit curves (see below). Open symbols are for the spherical airsoft balls. With increasing aspect ratio, the mean avalanche size for given R/req decreases. (b) Same data, with the best rescaled req*. This rescaling works only for not too large Q (short cylinders, rice). (c) Same data scaled with r(A)eq, comparing particles with same cross section areas. | ||
The main results of this figure are: (I) with increasing aspect ratio Q > 1, the mean avalanche size for given R/req decreases, the clogging probability gets larger. The critical radius increases with the aspect ratio (see Fig. 8). This means that the long axis has a stronger influence on the clogging than the two short axes. (II) When different shapes with same aspect ratios are compared, there is only little influence of the particle geometries. The characteristics of the Q = 3.5 glass rods (cylinders with smooth surface) hardly differ from the Q = 3.6 rice data. (III) One can try to scale all characteristics to a master curve by redefining req. This attempt is depicted in Fig. 7b, where we used rescaled req* = χreq on the abscissa, the corresponding factors χ are included in Table 1. Indeed, this procedure works satisfactorily well for the first three materials. For aspect ratios ≥6, it does not yield useful results, one can only try to scale the small orifice data. Then, χ systematically grows with Q. This means that effective particle sizes are increasingly underestimated by our choice of the equivalent radius req with larger aspect ratios. One may try to express χ as a power of Q, the best fit is found with χ = Q0.21±0.02. If we consider only the low Q graphs (Q < 6), 1/6 is a reasonable exponent. Together with the definition of req and Q, one finds that this is compatible with an alternative definition of the equivalent radius r(A)eq ∝ d, i.e. a quantity that characterizes a sphere with the same cross section area as the elongated grains (in a plane containing the rotation axis). Thus, we replotted the same values as in Fig. 7b in subfigure c, with the corresponding scaling r(A)eq. Even though the agreement is not perfect, particularly for large Q, the surprising essence of this image is that when one wants to compare avalanche statistics of particles of different shapes, it is better to compare particles of same cross sections than same volumes.
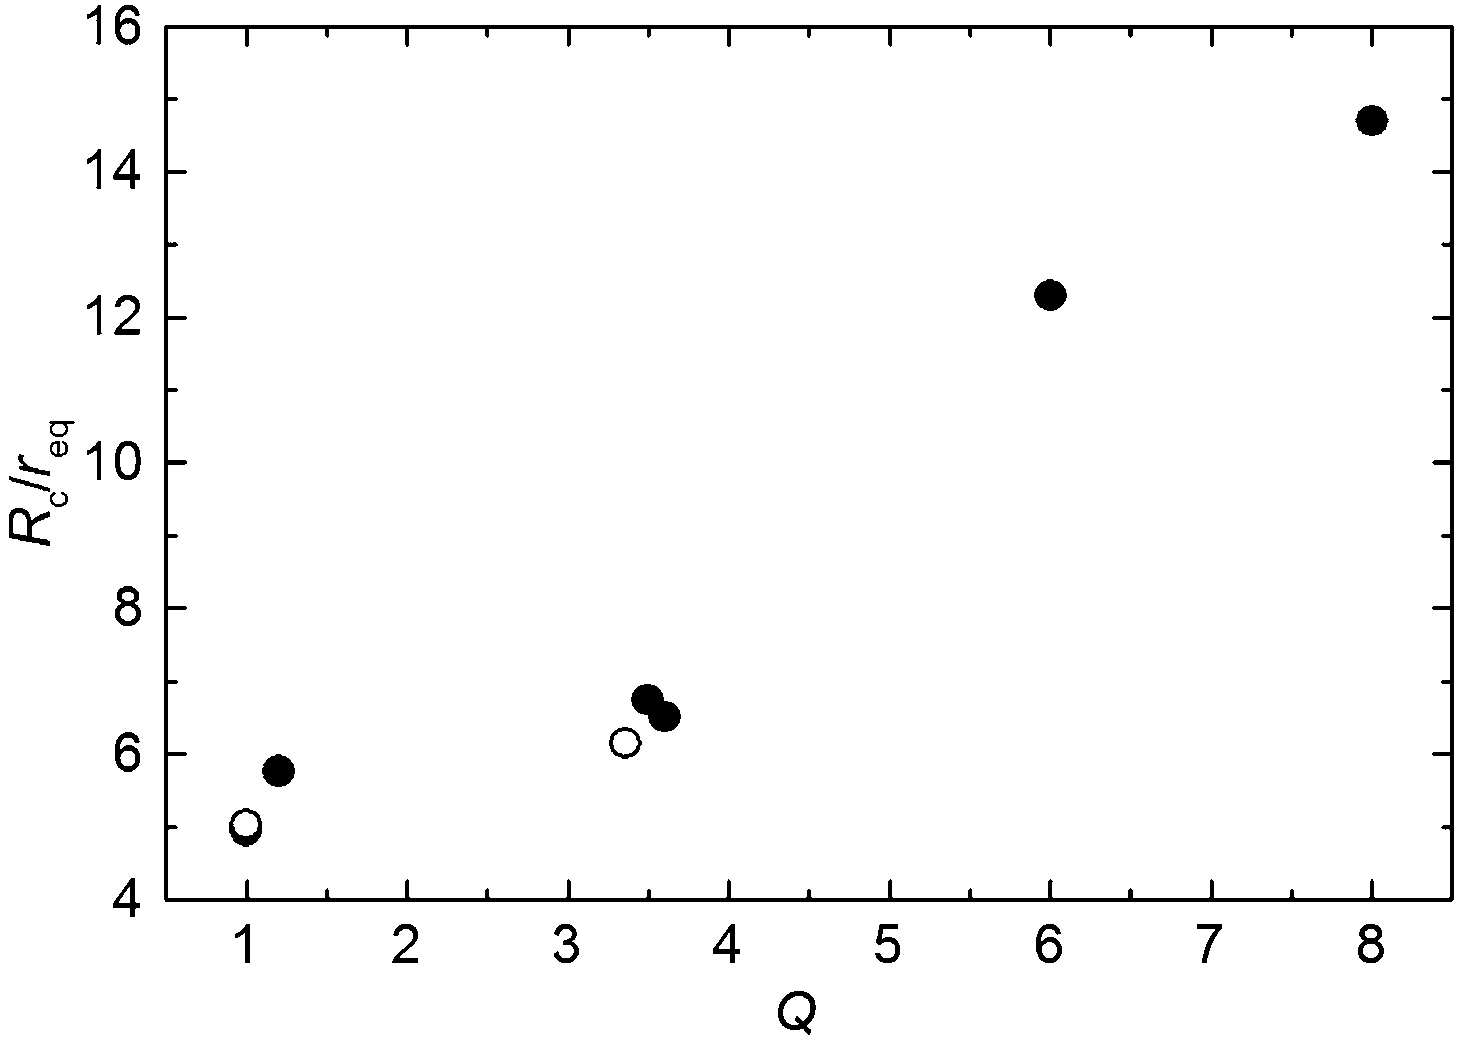 | ||
| Fig. 8 ‘Critical radius’ ratio Rc/req for materials with different aspect ratios Q. All other features of the grains except the aspect ratio are disregarded in this plot. Solid symbols: this work, open symbols: ref. 13. | ||
Not only do we find a different, much weaker dependence of the mean size 〈S〉 from the orifice sizes, but also, another phenomenon influences the dynamics for large aspect ratios. It is particularly evident for the Q = 12 rods, but can occur for Q = 6, Q = 8 in large orifice sizes as well: Fig. 9 shows that the hopper discharge changes qualitatively for Q = 12 grains. There, the dome formed by the particles is not stationary. Initially, small avalanches can be triggered that create a vertical continuously growing chimney-like hole. With the hole height growing, the air pulse becomes less effective. When this “rat-hole” reaches the hopper surface (Fig. 9b), the granular bed remains stable and no avalanches are formed anymore. This effect is comparable to the stabilization of towers of elongated particles as described by Trepanier and Franklin.70 In the hopper outflow situation, the stabilization of vertical (concave) chimney walls obviously takes place at much lower aspect ratios than that of the convex tower walls. It can be assumed that with increasing hole radius, the stability of these vertical hole walls may cease again, but we have not explored this detail here. We find similar vertical holes also with the shorter plastic rods (Q = 6, 8). They change the characteristics of the 〈S〉 (R) graphs in Fig. 7, it becomes flatter for large openings where discharges create rat-holes. The role of the silo walls in rat-hole formation need to be investigated in detail. The effect may be influenced by the limited container diameter.
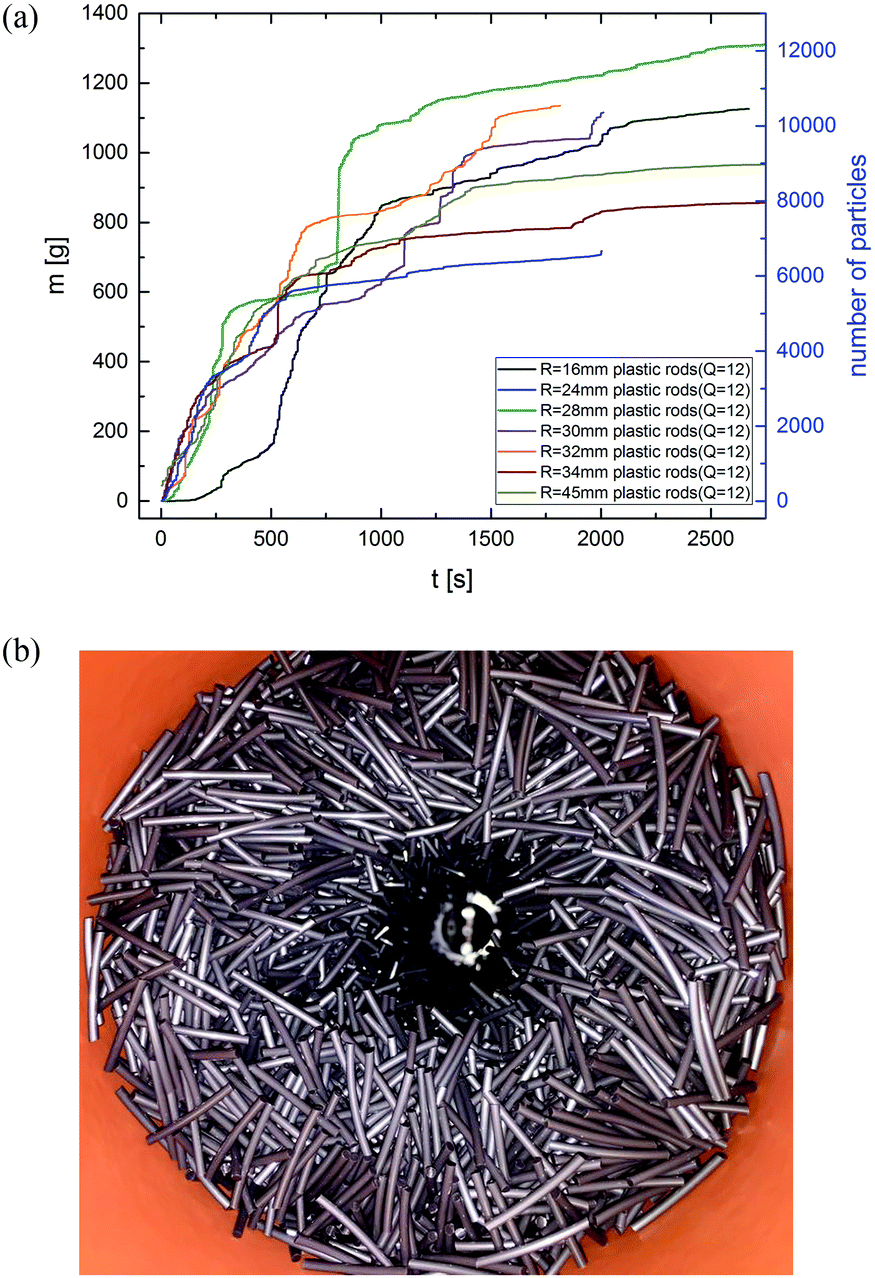 | ||
| Fig. 9 Q = 12 plastic rods: (a) statistics of the first avalanches after hopper filling. The vertical tunnel above the orifice grows with each triggered avalanche. When the “rat-hole” reaches the top surface, hopper outflow ceases completely, even with air pulses. (b) Top view of the hopper with a vertical “rat-hole” penetrating the granular bed, plastic rods of aspect ratio Q = 12, R = 32 mm, bed height 55 cm. | ||
B. Outflow rates
In this part we discuss the measured mass flow rate V from the 3D silo (diameter D = 15 cm, height H = 58 cm). The mass flow is measured in the two regimes, in the avalanche regime and for continuous discharge above Rc, the results are shown in Fig. 10. We find that the Beverloo law,6eqn (1) with exponent 5/2, can be used to satisfactorily fit all measured data, including the elongated particles, in our experiments. The solid lines represent the best fits to the particle flow rate (particles per time) | (5) |
 | (6) |
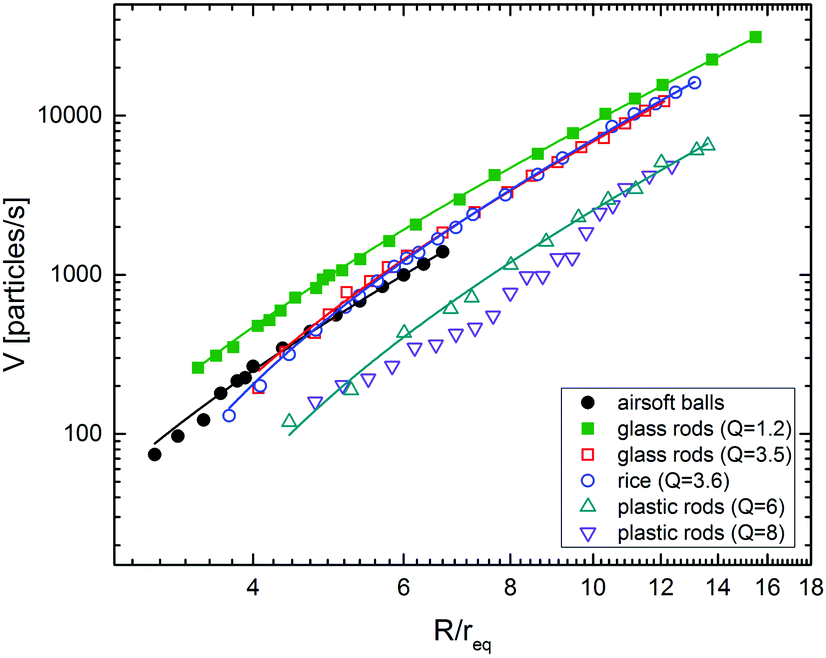 | ||
| Fig. 10 Flow rate vs. radius ratio for different particles in logarithmic scale vs. R/req. The lines are fits using eqn (5). Q = 8 rods cannot be fitted satisfactorily at all. | ||
| Material | Q | C′ (1/s) | k | r eq (mm) | C·ϕ |
|---|---|---|---|---|---|
| Airsoft balls | 1 | 20.7 ± 0.5 | 1.29 ± 0.04 | 3.0 | 0.268 |
| Glass rods | 1.2 | 41.2 ± 0.3 | 1.35 ± 0.04 | 1.1 | 0.325 |
| Glass rods | 3.5 | 36.9 ± 0.8 | 1.91 ± 0.07 | 1.65 | 0.355 |
| Rice grains | 3.6 | 39.9 ± 0.6 | 2.0 ± 0.06 | 1.5 | 0.365 |
| Plastic rods | 6 | 15.5 ± 1.2 | 2.3 ± 0.3 | 2.55 | 0.185 |
| Plastic rods | 8 | 14.1 ± 1.4 | 2.7 ± 0.2 | 2.75 | 0.175 |
It is seen that the coefficient k has a systematic dependence upon the aspect ratio, it tends to increase with increasing aspect ratio. This is equivalent to the statement that in Beverloo's equation, the long axis of the grains has a larger influence than the two short axes. When one is going to substitute d, the sphere diameter, in eqn (1) by an effective parameter of the elongated particles, one needs to choose a value that is larger than the geometric average of the three particle dimensions. It is easy to acknowledge that for Q = 8, the Beverloo equation is not a useful description, even if one redefines the effective radius.
It is also evident that if one groups the graphs for the two shape types separately (ellipsoidal and cylindrical), then there is a systematic trend in both groups, the outflow of the particles with larger aspect ratio is slower than that of the shorter particles, when same equivalent radii are compared.
C. Characterization of the clogged state
The structure of clogs has been studied extensively for circular particles in 2D hoppers before. Even the orientation of non-circular grains in blocking arches has been determined in 2D. Here, we use tomography and optical methods to extend these studies to 3D and to various grain shapes. This task is considerably more complex not only because the observation is more complicated but also because the blocking structures are less well defined than in 2D. In the latter, a continuous force chain from one side of the orifice to the other can be used to identify the particles that form the blocking arch. This is not as evident in 3D. Here, one can only roughly define a first shell of particles forming a blocking layer. Of course, not only the grains in that first layer contribute to the clog, i.e. removal of other particles can also destabilize the blocked state, in 3D as well as in 2D. In our 3D experiments, we roughly define the blocking particles by selecting the minimal number of particles that form a closed shell above the outlet which cannot be penetrated by particles above that layer. A reasonable procedure is to detect all particles in the vicinity of the outlet and to add successively particles that are closest to the center of the outlet until they form a blocking shell. For that purpose, we have employed two alternative methods. X-ray tomography is well suited to characterize the orientational distributions of the blocking particles, and in addition the number of particles in the blocking dome. Fig. 11 shows two typical examples of particle arrangements in the dome detected by X-ray tomography, for spherical and cylindrical grains, respectively. However, a more accurate method to determine their quantity is the evaluation of photos of the dome through the orifice. With the camera close to the orifice, the perspective view allows to map all particles in the clog.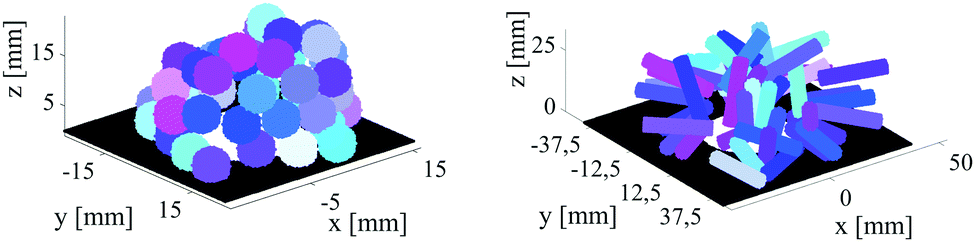 | ||
| Fig. 11 Particles in the blocking layers detected by X-ray tomography, for nearly spherical grains (peas, left) and cylindrical grains (pegs with Q = 5, right). For the pegs, a preferential radial alignment of the grains is evident already from visual inspection. | ||
A reasonable assumption for the mean number N of monodisperse spheres of radius r ≡ req blocking an orifice with radius R can be estimated when one compares the area of a hemisphere (dome) of radius R + req with the cross section area of each grain, πreq2.
 | (7) |
The parameter γ is an area-filling factor which accounts for the fact that the grains are displaced out of the hypothetical hemisphere. One may expect that γ is of the order of one, larger than the maximum packing fraction of circles in a plane, 0.906.
Fig. 12 shows the number of spherical particles identified in the first layer of the clog. It is obvious that particle properties like detailed geometrical shape and friction play only an insignificant role. Data for perfect spherical monodisperse smooth particles (airsoft bullets) and for slightly irregular, not exactly monodisperse peas collapse to the same curve with γ ≈ 1.03. The same characteristics for cylindrical particles with aspect ratio Q = 5 is given in Fig. 13. There are some systematic deviations between X-ray tomogram and optical photography data, the latter appear to be more accurate. In both images, we have drawn vertical lines at the largest orifice sizes that produced clogs. Note that this does not mark Rc, but a considerably smaller radius for each material. The hopper for measurements of the dome shapes contained only a comparably small number of particles (of the order of 10000), much less than that used for the dynamic measurements, thus large avalanches were not observable.
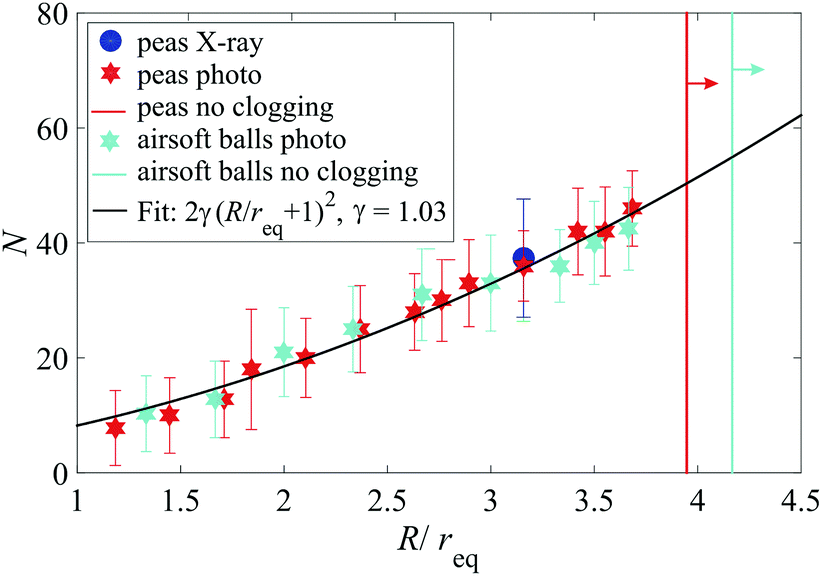 | ||
| Fig. 12 Number of spherical particles forming the blocking dome structure for different ratios of orifice size and particle size. The solid line is a fit with eqn (7) and γ ≈ 1.03. Each datum point is an average of 30 measurements. Vertical lines sketch the largest orifice size where we found clogs, they do not mark Rc (see text). There, the more regular and less frictional airsoft bullets differ noticeably from peas. | ||
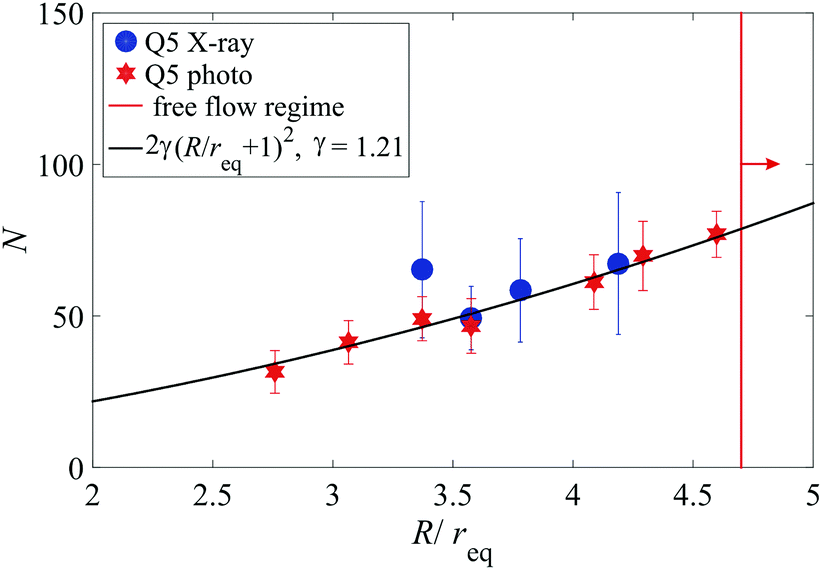 | ||
| Fig. 13 Same as in Fig. 12 for wooden cylinders of aspect ratio 5. A reasonable fit to the optical data is found with γ = 1.21. The vertical line does not mark Rc but the largest orifice size where we found clogs (see text). | ||
The following Fig. 14 compiles the number of particles in the blocking shell for different materials. All individual sets can be fitted with eqn (7) with different parameters γ in the range of 1…1.4. There is a clear trend to larger γ with increasing aspect ratio. This can be interpreted as follows: the grains forming the blocking shell are preferentially oriented such that longer axes are perpendicular to the local shell surface. Thus, the shell is thicker (in units of the equivalent radius) for more anisometric grains, one needs more anisometric grains to form the blocking shell than spheres of the same equivalent radius.
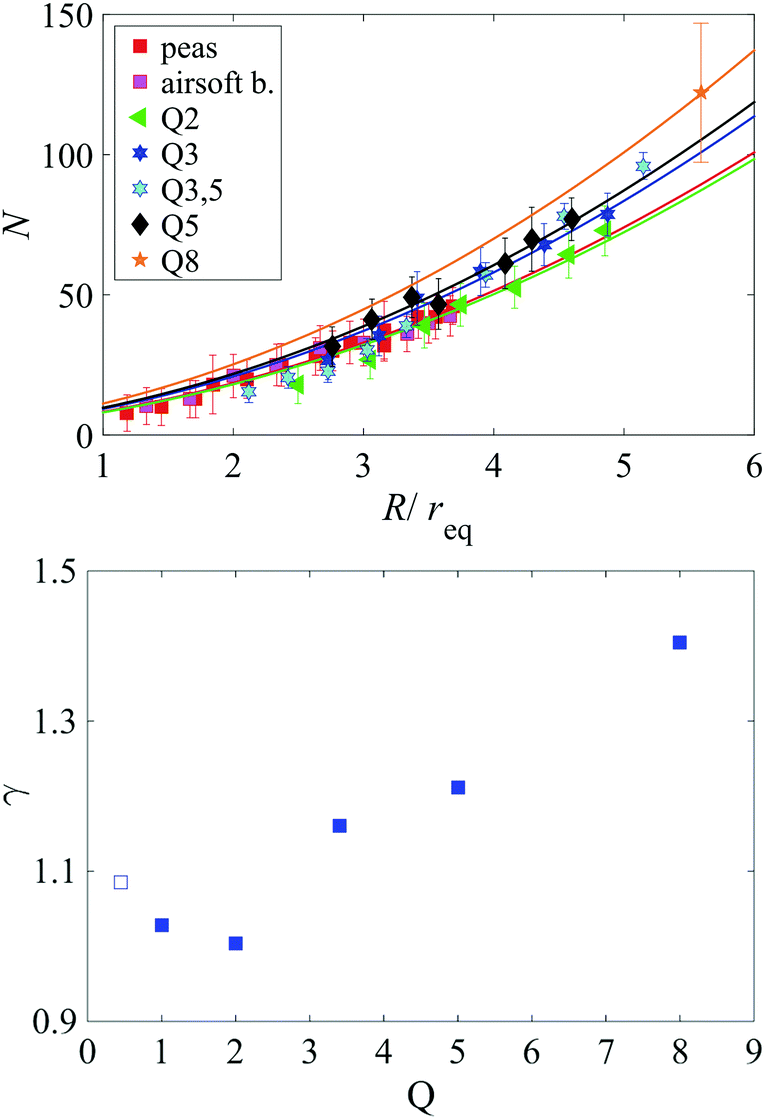 | ||
| Fig. 14 Same as in Fig. 12 for different particle geometries. All sets can be fitted satisfactorily with eqn (7) and the γ values plotted in the bottom graph. | ||
This can be confirmed quantitatively by X-ray tomography. Here, we define an angle ϕ between the particle orientation axis and the direction towards the orifice center (Fig. 15). In case of a random orientation of the particles in the blocking layer, a distribution f(ϕ) ∝ sinϕ would be expected. Fig. 16 shows that this is actually not the case: the long axes of the particles are directed preferentially towards the orifice center. That observation is consistent with the well-known alignment of elongated grains under shear. The consequence, in accordance with Fig. 14, bottom, is that one needs more anisometric grains than spherical grains of identical volume to block a given circular orifice.
 | ||
| Fig. 15 Left: Cross section through a typical X-ray tomogram of wooden pegs (Q = 5) in a hopper with R = 20.5 mm orifice diameter. The preferential radial alignment respective to the center of the orifice is clearly evident. Right: Definition of the angle ϕ between the particle axis and the direction from the orifice center to the particle's center of mass. | ||
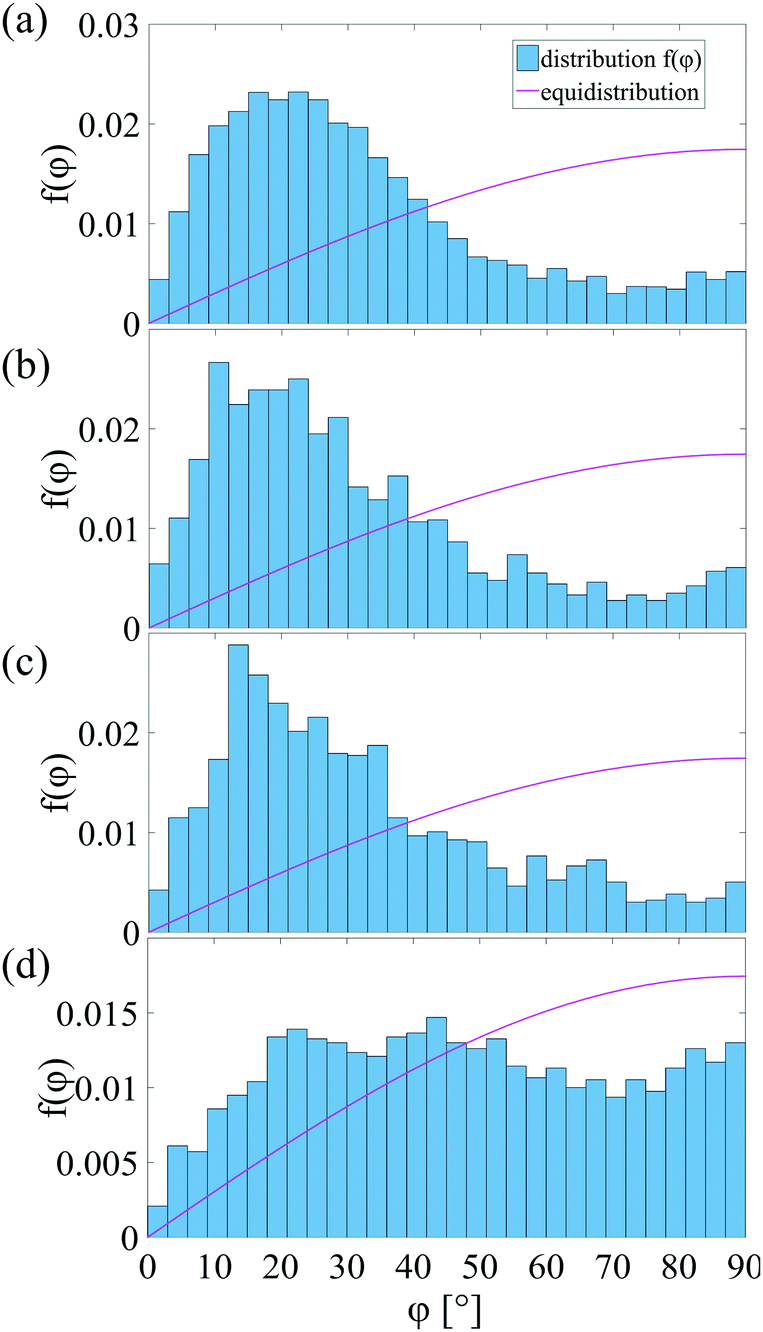 | ||
| Fig. 16 Histograms of the orientational distribution functions of anisometric particles forming the dome (blocking structure) above the circular hopper orifice. (a) Q = 8, R = 32 mm, (b) Q = 5, R = 18.5 mm, (c) Q = 3, R = 18.5 mm, (d) Q = 2, R = 15 mm. In all cases, a clear preference of radial alignment of the long particle axes is identified. | ||
As we have discussed above, with the Q = 12 plastic rods we observed continuous holes that penetrate the complete granular layer up to the surface. Only small orifices are blocked by these grains, for larger orifices no stationary dome shape is formed. Similar elongated holes also occur with shorter (Q = 6, Q = 8) plastic rods, they alter the avalanche statistics for large R (see Fig. 7). Our optical observation technique is, however, inappropriate for the observation of such long holes. One needs to perform more X-ray CT measurements at large orifice sizes to characterize the transition from hemispherical domes to elongated rat-holes. With our setup, it was impossible to study these geometries because the container used in X-ray CT has spatial limitations. It cannot be used in the combination of large pegs and large orifices. For the plastic rods, the X-ray resolution is too poor. Our detection techniques were thus not suited to study the rat-holes in detail, and we have consequently not attempted to characterize the long pegs at large R/req ratios.
V. Conclusions and summary
We presented experimental data on the dynamics of for anisometric granular particles during hopper outflow and analyzed the structure of the clogs created by such particles. Conventional mechanical flow measurements were combined with X-ray CT studies. Flow rates, avalanche statistics and the particle arrangement in the clog were analyzed for materials with different aspect ratios. It is known that elongated grains get ordered in the flowing parts of the silo, they align at a small angle to the shear flow direction. This has been described for the floating region inside the hopper in a previous study,68 and is confirmed by the present analysis of the domes of blocking particles.At first glance, the results of the static and dynamic experiments do not fit together intuitively. Rather, outflow and clogging mechanisms seem to be quite complex when shape anisotropy is involved: the static analysis of the clog reveals that the elongated grains align when they are transported down the hopper towards the orifice. When forming a clog, the orientation of the long axes of the grains is preferentially along the radial direction seen from the orifice center. This has the consequence that for the formation of a complete layer of blocking grains (dome), more elongated grains are needed than spheres of a comparable volume. The ‘shell’ of blocking particles is consequently thicker. Intuitively one would expect that this leads to a smoother outflow of elongated grains and larger avalanche sizes as compared to spheres, but the opposite is the case.
Comparing grains of similar volume, it turns out that the probability of clog formation is substantially increased when the aspect ratio increases (at least up to Q = 8). The critical orifice radius above which there is practically free flow (or, where the typical avalanche sizes exceed the experimental capacity), is much higher for elongated grains, i.e. one has to expect clogging in practice at much larger R/req. There is no contradiction between these observations, but they indicate that clogging of anisometric grains in hoppers is far more complex than it appears on first glance.
The measured characteristics of avalanche statistics suggest that at least for moderate aspect ratios, the comparison of elongated particles with spheres of the same cross section is a reasonable approximation, while the comparison with spheres of the same volume is less successful. It is also evident that for Q ≥ 6 neither the power law eqn (2) nor the exponential law eqn (3) are suitable to describe the 〈S〉 characteristics. At certain orifice diameters, the outflow is much slower than predicted by an extrapolation of the low R curves. Therefore, both models are insufficient for the description of the avalanche sizes. This is obviously connected with a change of the dome structure (see last paragraph).
Since the particle geometry influences both clogging probabilities and discharge rates, it may be interesting to compare the geometry-dependent quantities Rc and k. Fig. 17 shows their relation. There is a more or less evident trend, both parameters increase with increasing aspect ratio Q > 1. On the other hand, the Rc values for large aspect ratios Q ≥ 6 should be treated with some reservation. They are extrapolations of small orifice data, and represent mere fit parameters instead of critical radii where avalanche sizes diverge.
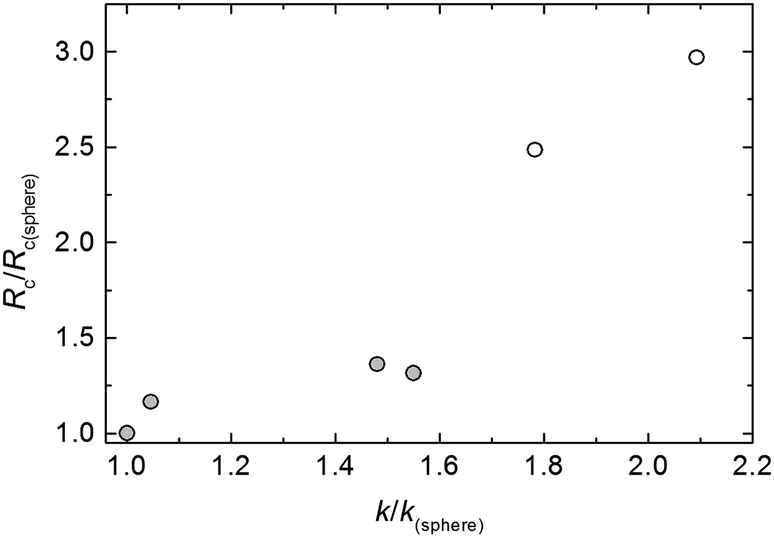 | ||
| Fig. 17 Plot of the scaled critical radius Rc/Rc(sphere)vs. k/k(sphere). There appears to be a qualitative correlation, but a quantitative relation is difficult to establish on the basis of our experimental data. The two bright symbols are data for Q = 6, 8. | ||
One qualitatively new feature in hopper discharge of prolate grains compared to spherical particles is the initial transient. After gravitational filling, the elongated grains are largely disordered, with some preference of horizontal orientation of the grains. This has been discovered in simulations71,73 and confirmed in experiments (see, e.g.ref. 68). The first clogs in a hopper filled with elongated grains are therefore formed by largely disordered particles. Thus the first avalanches are normally small, a stationary avalanche size distribution develops only after some amount of material has flown out. This feature is completely absent with spherical or nearly spherical grains. It becomes more and more evident with higher aspect ratios (cf.Fig. 5). The consequence is that for a representative avalanche statistics one has to discard the first avalanches. It has to be ensured that enough disordered material has flown out of the hopper and made way for shear-flow ordered material. The number of avalanches necessary to achieve this is not relevant, but the outflown amount of material.
For moderately anisometric particles (Q < 4), the discharge rate was found to be little influenced by the aspect ratio. Fig. 10 shows that the number of particles leaving the hopper has no pronounced Q dependence for these grains, the equivalent radius of a sphere of equal volume is a reasonable approximation. For large aspect ratios, the flow rate is much smaller than expected by Beverloo's formula, and it cannot be described satisfactorily by eqn (1) any more. We assume that the influence of alignment of the rods during outflow is changing with different orifice sizes, this leads to an effectively faster outflow (as compared to Beverloo's equation) with increasing orifice size, the V(R) characteristics is no longer described by an (R/req − k)5/2 dependence, instead, it is even slightly convex (V′′(R) > 0) for the Q = 8 material. The experimental limits for the V(R) characteristics are limited number of particles in each avalanche for small R/req, and the formation of unstable domes and rat-holes for large Q an large R/req.
For the cylinders with large aspect ratio (particularly evident for Q = 12), the hopper discharge process differs qualitatively from that of the less anisometric particles. Only small avalanches could be triggered, the dome shape changed continuously to create an elongated chimney and to finally form a continuous ‘rat-hole’ that reached the surface of the granular volume in the hopper. Thereafter, no further avalanches could be triggered, probably vibration of the whole container could break that structure and re-iterate avalanches. A detailed analysis of the shape of the blocking structures for these materials was not within the scope of this work, it requires extensive tomographic imaging resources which were not available to the authors. The role of the limited container size in the formation of such holes is not clear yet, this question requires further attention.
Appendix A
The scale has a finite integration constant of the order of one second. Therefore, the measured apparent m′(t) curves do not reflect the accurate momentary outflow rates m(t) and avalanche times. Any instant change of the load appear as an (approximately exponential) approach to the new value. A mathematical deconvolution with the device characteristics would be needed (see Fig. 18) to retrieve the real m(t) from the balance data. Nevertheless, the balance provides the necessary information on avalanche sizes, i.e. the step heights between the plateaus. For large enough orifice sizes, when the mean avalanche duration is dozens of seconds, the retardation of the balance is not relevant. However, it affects the accurate determination of flow rates at small orifice sizes (the avalanche duration extracted from m′(t) appears longer and the flow rate will have a systematic error).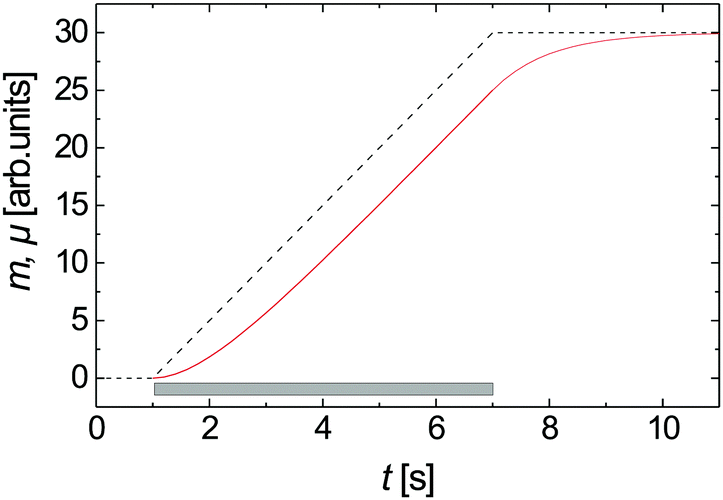 | ||
| Fig. 18 Assumed constant flow rate in an avalanche (dashed line) and measured signal of the balance considering the delayed response function. The bar symbolizes the duration extracted from the microphone soundtrack. | ||
The setup was thus extended by a microphone that records the noise of falling grains. The audio signal is used to extract the precise avalanche durations.16 Mean flow rates are found by dividing the sizes of the avalanches by these correct durations (which we obtain with a precision of 0.1 s).
Acknowledgements
A. A. Acknowledges a scholarship from the Future University, Egypt. Financial support from the DAAD/MÖB researcher exchange program (Grants 57141022/64975) and the Hungarian Scientific Research Fund (Grant OTKA NN 107737) are cordially acknowledged. We thank the STIMULATE lab of Otto von Guericke University for the opportunity to perform X-ray CT measurements.References
- H. M. Jaeger, S. Nagel and R. P. Beringer, Rev. Mod. Phys., 1996, 68, 1259 CrossRef.
- P. G. de Gennes, Rev. Mod. Phys., 1999, 71, S374 CrossRef.
- C. S. Campbell, J. Powder Technol., 2006, 162, 208 CrossRef CAS.
- M. O. Carpinlioglu, Int. J. Chemistry and Chem. Eng. Syst., 2016, 1, 21 Search PubMed.
- F. C. Franklin and L. N. Johanson, Chem. Eng. Sci., 1955, 4, 119–129 CrossRef CAS.
- W. A. Beverloo, H. A. Leniger and J. J. Van de Velde, Chem. Eng. Sci., 1961, 15, 260 CrossRef CAS.
- R. M. Neddermann, U. Tuzun, S. B. Savage and G. T. Houlsby, Chem. Eng. Sci., 1982, 37, 1597–1609 CrossRef.
- C. S. Chang, H. H. Converse and J. L. Steele, Trans. Am. Soc. Agric. Eng., 1991, 34, 1789–1796 CrossRef.
- E. R. Nowak, J. B. Knight, E. Ben-Naim, H. M. Jaeger and S. R. Nagel, Phys. Rev. E: Stat. Phys., Plasmas, Fluids, Relat. Interdiscip. Top., 1998, 57, 1971 CrossRef CAS.
- S. S. Manna and H. J. Herrmann, Eur. Phys. J. E: Soft Matter Biol. Phys., 2000, 1, 341–344 CrossRef CAS.
- D. Hirshfeld and D. C. Rapaport, Eur. Phys. J. E: Soft Matter Biol. Phys., 2001, 4, 193–199 CrossRef CAS.
- I. Zuriguel, L. A. Pugnaloni, A. Garcimartín and D. Maza, Phys. Rev. E: Stat., Nonlinear, Soft Matter Phys., 2003, 68, 030301 CrossRef PubMed.
- I. Zuriguel, A. Garcimartín, D. Maza, L. A. Pugnaloni and J. M. Pastor, Phys. Rev. E: Stat., Nonlinear, Soft Matter Phys., 2005, 71, 051303 CrossRef PubMed.
- K. To, Phys. Rev. E: Stat., Nonlinear, Soft Matter Phys., 2005, 71, 060301 CrossRef PubMed.
- C. Mankoc, A. Janda, R. Arévalo, J. M. Pastor, I. Zuriguel, A. Garcimartín and D. Maza, Granular Matter, 2007, 9, 407–414 CrossRef.
- C. Mankoc, A. Janda, R. Arévalo, J. M. Pastor, I. Zuriguel, A. Garcimartín and D. Maza, Granular Matter, 2007, 9, 407–414 CrossRef.
- A. Janda, I. Zuriguel, A. Garcimartín, L. A. Pugnaloni and D. Maza, EPL, 2008, 84, 44002 CrossRef.
- C. Mankoc, A. Garcimartín, I. Zuriguel and D. Maza, Phys. Rev. E: Stat., Nonlinear, Soft Matter Phys., 2009, 80, 011309 CrossRef PubMed.
- B. Jin, H. Tao and W. Zhong, Chin. J. Chem. Eng., 2010, 18, 931–939 CrossRef CAS.
- H. Tao, B. Jin, W. Zhong, X. Wang, B. Ren, Y. Zhang and R. Xiao, Chem. Eng. Process., 2010, 49, 151–158 CrossRef CAS.
- J. E. Hilton and P. W. Cleary, Phys. Rev. E: Stat., Nonlinear, Soft Matter Phys., 2011, 84, 011307 CrossRef CAS PubMed.
- A. Garcimartín, I. Zuriguel, A. Janda and D. Maza, Phys. Rev. E: Stat., Nonlinear, Soft Matter Phys., 2011, 84, 031309 CrossRef PubMed.
- S. Saraf and S. V. Franklin, Phys. Rev. E: Stat., Nonlinear, Soft Matter Phys., 2011, 83, 030301 CrossRef PubMed.
- J. Tang and R. Behringer, Chaos, 2011, 21, 041107 CAS.
- K. Grudzien, M. Niedostatkiewicz, J. Adrien, J. Tejchman and E. Maire, Chem. Eng. Process., 2011, 50, 59–67 CrossRef CAS.
- R. Unac, A. Vidales and L. Pugnaloni, J. Stat. Mech.: Theory Exp., 2012, 04, P04008 Search PubMed.
- R. O. Unac, A. M. Vidales, O. A. Benegas and I. Ippolito, Powder Technol., 2012, 225, 214–220 CrossRef CAS.
- C. Lozano, A. Janda, A. Garcimartín, D. Maza and I. Zuriguel, Phys. Rev. E: Stat., Nonlinear, Soft Matter Phys., 2012, 86, 031306 CrossRef PubMed.
- S. Dorbolo, L. Maquet, M. Brandenbourger, F. Ludewig, G. Lumay, H. Caps, N. Vandewalle, S. Rondia, M. Mélard, J. van Loon, A. Dowson and S. Vincent-Bonnieu, Granular Matter, 2013, 15, 263–273 CrossRef.
- C. C. Thomas and D. J. Durian, Phys. Rev. E: Stat., Nonlinear, Soft Matter Phys., 2013, 87, 052201 CrossRef CAS PubMed.
- I. Zuriguel, Pap. Phys., 2014, 6, 060014 Search PubMed.
- I. Zuriguel, D. R. Parisi, R. C. Hidalgo1, C. Lozano, A. Janda, P. A. Gago, J. P. Peralta, L. M. Ferrer, L. A. Pugnaloni, E. Clément, D. Maza, I. Pagonabarraga and A. Garcimartín, Sci. Rep., 2014, 4, 7324 CrossRef CAS PubMed.
- S. M. Rubio-Largo, A. Janda, D. Maza, I. Zuriguel and R. C. Hidalgo, Phys. Rev. Lett., 2015, 114, 238002 CrossRef CAS PubMed.
- M. A. Aguirre, R. De Schant and J.-C. Géminard, Phys. Rev. E: Stat., Nonlinear, Soft Matter Phys., 2014, 90, 012203 CrossRef CAS PubMed.
- T. J. Wilson, C. R. Pfeifer, N. Meysingier and D. J. Durian, Pap. Phys., 2014, 6, 060009 Search PubMed.
- Y. Wang, Y. Lu and J. Y. Ooi, Powder Technol., 2015, 282, 43–54 CrossRef CAS.
- C. C. Thomas and D. J. Durian, Phys. Rev. Lett., 2015, 114, 178001 CrossRef CAS PubMed.
- A. Garcimartín, J. M. Pastor, L. M. Ferrer, J. J. Ramos, C. Martín-Gómez and I. Zuriguel, Phys. Rev. E: Stat., Nonlinear, Soft Matter Phys., 2015, 91, 022808 CrossRef PubMed.
- G. Gutiérrez, C. Colonnello, P. Boltenhagen, J. R. Darias, R. Peralta-Fabi, F. Brau and E. Clément, Phys. Rev. Lett., 2015, 114, 018001 CrossRef PubMed.
- M. Benyamine and M. Djermane, Phys. Rev. E: Stat., Nonlinear, Soft Matter Phys., 2014, 90, 032201 CrossRef CAS PubMed.
- R. Arévalo and I. Zuriguel, Soft Matter, 2016, 12, 123 RSC.
- K. To, P. Lai and H. K. Pak, Phys. Rev. Lett., 2001, 86, 71 CrossRef CAS PubMed.
- A. Drescher, A. J. Waters and C. A. Rhoades, Powder Technol., 1995, 84, 177–183 CrossRef CAS.
- C. Mankoc, A. Garcimartín, I. Zuriguel, D. Maza and L. A. Pugnaloni, Phys. Rev. E: Stat., Nonlinear, Soft Matter Phys., 2009, 80, 011309 CrossRef PubMed.
- A. Janda, R. Harich, I. Zuriguel, D. Maza, P. Cixous and A. Garcimartin, Phys. Rev. E: Stat., Nonlinear, Soft Matter Phys., 2009, 79, 031302 CrossRef CAS PubMed.
- A. Janda, D. Maza, A. Garcimartín, E. Kolb, J. Lanuza and E. Clément, Europhys. Lett., 2009, 87, 24002 CrossRef.
- C. Lozano, G. Lumay, I. Zuriguel, R. C. Hidalgo and A. Garcimartín, Phys. Rev. Lett., 2012, 109, 068001 CrossRef PubMed.
- M. L. Hunt, R. C. Weathers, A. T. Lee, C. E. Brennen and C. R. Wassgren, Phys. Fluids, 1999, 11, 1 CrossRef.
- C. R. Wassgren, M. L. Hunt, P. J. Freese, J. Palamara and C. E. Brennen, Phys. Fluids, 2002, 14, 10 CrossRef.
- K. Chen, M. B. Stone, R. Barry, M. Lohr, W. McConville, K. Klein, B. L. Sheu, A. J. Morss, T. Scheidemantel and P. Schiffer, Phys. Rev. E: Stat., Nonlinear, Soft Matter Phys., 2006, 74, 011306 CrossRef CAS PubMed.
- A. Garcimartín, I. Zuriguel, L. A. Pugnaloni and A. Janda1, Phys. Rev. E: Stat., Nonlinear, Soft Matter Phys., 2010, 82, 031306 CrossRef PubMed.
- H. G. Sheldon and D. J. Durian, Granular Matter, 2010, 12, 579–585 CrossRef.
- I. Oldal, I. Keppler, B. Csizmadia and L. Fenyvesi, Adv. Powder Technol., 2012, 23, 290–297 CrossRef.
- R. C. Hidalgo, C. Lozano, I. Zuriguel and A. Garcimartín, Granular Matter, 2013, 15, 841–848 CrossRef.
- R. Arévalo, I. Zuriguel, D. Maza and A. Garcimartín, Phys. Rev. E: Stat., Nonlinear, Soft Matter Phys., 2014, 89, 042205 CrossRef PubMed.
- C. Lozano, I. Zuriguel and A. Garcimartín, Phys. Rev. Lett., 2015, 114, 178002 CrossRef CAS PubMed.
- C. Lozano, I. Zuriguel and A. Garcimartń, Phys. Rev. E: Stat., Nonlinear, Soft Matter Phys., 2015, 91, 062203 CrossRef CAS PubMed.
- R. C. Hidalgo, C. Lozano, I. Zuriguel and A. Garcimartín, Granular Matter, 2013, 15, 841–848 CrossRef.
- F. Vivanco, S. Rica and F. Melo, Granular Matter, 2012, 14, 563–576 CrossRef.
- I. Zuriguel, A. Janda, A. Garcimartín, C. Lozano, R. Arévalo and D. Maza, Phys. Rev. Lett., 2011, 107, 278001 CrossRef PubMed.
- P. W. Cleary, Second International Conference on CFD in the Minerals and Process Industries, 1999, pp. 71-76 Search PubMed.
- P. W. Cleary and M. L. Sawley, Appl. Math. Modelling, 2002, 26, 89–111 CrossRef.
- P. A. Langston, M. A. Al-Awamleh, F. Y. Fraige and B. N. Asmar, Chem. Eng. Sci., 2004, 59, 425–435 CrossRef CAS.
- S. D. Liu, Z. Y. Zhou, R. P. Zou, D. Pinson and A. Yu, Powder Technol, 2014, 253, 70–79 CrossRef CAS.
- J. Li, P. A. Langston, C. Webb and T. Dyakowski, Chem. Eng. Sci., 2004, 59, 5917–5929 CrossRef CAS.
- T. Kanzaki, M. Acevedo, I. Zuriguel, I. Pagonabarraga, D. Maza and R. C. Hidalgo, Eur. Phys. J. E: Soft Matter Biol. Phys., 2011, 34, 133 CrossRef CAS PubMed.
- J. Tang and R. P. Behringer, Europhys. Lett., 2016, 114, 34002 CrossRef.
- T. Börzsönyi, E. Somfai, B. Szabó, S. Wegner, P. Mier, G. Rose and R. Stannarius, New J. Phys., 2016, 18, 093017 CrossRef.
- P. Mort, et al. , Powder Technnol., 2015, 284, 571 CrossRef.
- M. Trepanier and S. V. Franklin, Phys. Rev. E: Stat., Nonlinear, Soft Matter Phys., 2010, 82, 011308 CrossRef CAS PubMed.
- B. J. Buchalter and R. M. Bradley, Europhys. Lett., 1994, 26, 159–164 CrossRef CAS.
- A. P. Philipse, Langmuir, 1996, 12, 1127 CrossRef CAS.
- B. J. Buchalter and R. M. Bradley, Phys. Rev. A: At., Mol., Opt. Phys., 1992, 46, 3046–3056 CrossRef.
| This journal is © The Royal Society of Chemistry 2017 |