 Open Access Article
Creative Commons Attribution 3.0 Unported Licence
Phase transition and aggregation behaviour of an UCST-type copolymer poly(acrylamide-co-acrylonitrile) in water: effect of acrylonitrile content, concentration in solution, copolymer chain length and presence of electrolyte†
Asad
Asadujjaman
a,
Ben
Kent
b and
Annabelle
Bertin
*ac
aFederal Institute for Materials Research and Testing (BAM), Unter den Eichen 87, 12205 Berlin, Germany. E-mail: annabelle.bertin@bam.de
bHelmholtz-Zentrum Berlin (HZB), Hanhn-Meitner-Platz 1, 14109 Berlin, Germany
cFreie Universität Berlin, Institute of Chemistry and Biochemistry–Organic Chemistry, Takustr. 3, 14195 Berlin, Germany
First published on 20th December 2016
Abstract
An UCST-type copolymer of acrylamide (AAm) and acrylonitrile (AN) (poly(AAm-co-AN)) was prepared by reversible addition fragmentation chain transfer (RAFT) polymerization and its temperature-induced phase transition and aggregation behaviour studied by turbidimetry, static and dynamic light scattering, small angle neutron scattering (SANS) and cryo-transmission electron microscopy (cryo-TEM) measurements. The phase transition temperature was found to increase with increasing AN content in the copolymer, concentration of the solutions and copolymer chain length. A significant effect was observed onto the phase transition temperature by addition of different electrolytes into the copolymer solution. The copolymer chains were aggregated below the phase transition temperature and disaggregated above it. The size of the aggregates increases with increasing AN contents and concentration of the copolymer solutions below the phase transition temperature. The copolymer chains were expanded and weekly associated in solution above the phase transition temperature. A model is proposed to explain such association–aggregation behaviour of poly(AAm-co-AN) copolymers depending on AN contents and concentration of the copolymer solutions as a function of temperature.
1 Introduction
The physical properties of smart polymeric materials change according to environmental factors, such as temperature, pH, light, electric and magnetic fields and ionic strength.1 It is the thermoresponsive polymers ability to change their physical properties in response to change to the surrounding temperature that makes them the most interesting materials within this group of smart polymeric materials. This is especially the case in areas such as temperature-triggered drug delivery, diagnostics, tissue engineering, bio-separation, thermally switchable optical devices, and in sensory applications.1–5 Thermoresponsive polymers can exhibit a lower critical solution temperature (LCST)6 and/or an upper critical solution temperature (UCST).7,8 There has been a recent increased interest in UCST polymers. However, to date, only few polymers exhibiting a UCST in water within a relevant temperature range (0 to 100 °C), have been reported, i.e. phase separate from solution upon cooling.9–11 In addition, UCST type polymers based on ionic interactions such as polybetaines,12–15 are difficult to use under physiological conditions (i.e. in the presence of salts etc.), which significantly restricts their potential applications. Therefore, non-ionic based UCST polymers with sharp and robust phase transition in physiological conditions are urgently needed in order to extend the range of applications of this class of polymers.Non-ionic based UCST polymers rely on hydrogen bonding between polymer side groups for the phase transition. With increasing temperature, the hydrogen bonds between polymer side groups are broken in an endothermic process and replaced by hydrogen bonds with water molecules in an exothermic process.16 Examples are poly(N-acryloylglycinamide) (PNAGA), first synthesized by Haas and Schuler,17 and poly(uracilacrylate), synthesized by Brahme and Smith.18 These polymers show a UCST in a relevant temperature range (5–60 °C) in aqueous solutions.10 The UCST behaviour of PNAGA in both pure water and also in electrolyte solution was first reported by Agarwal et al.19 Since then, PNAGA has been studied more extensively than the other non-ionic UCST polymers. However, it has been discovered that the presence of a trace amount of ionic groups during polymerization significantly affects the phase transition or even suppresses its UCST behaviour. Moreover, PNAGA and its derivatives display a significant hysteresis20 and exhibit a slow phase transition,19 preventing their use in many applications where sharp and fast transitions are required. Another example of non-ionic UCST polymer is acrylamide based poly(methylacrylamide) (PMAm).21 However, the UCST behaviour of PMAm is also affected by the presence of ionic groups during synthesis. Acrylamide based copolymers, for example interpenetrating networks and cross-linked gels of poly(acrylamide-co-acrylic acid), exhibit UCST behaviour,22–24 though non-cross-linked copolymers have not been reported yet to show UCST. It is also known that the homopolymer poly(acrylamide) is completely soluble in pure water.
There is growing interest for copolymers based on acrylamide (AAm) and acrylonitrile (AN) (poly(AAm-co-AN)) first reported by Seuring and Agarwal,21 in the field of non-ionic based UCST polymers. Poly(AAm-co-AN) copolymers show a sharp and reversible UCST phase transition in aqueous and electrolyte solutions. The phase transition temperature of this copolymer can be adjusted or tuned by varying the composition of the copolymer and the concentration of the solution.21 Additionally, the UCST type poly(AAm-co-AN) based derivatives show potential applications as microactuators25 and drug delivery systems.26 Very recently Pineda-Contreras et al.27 investigated the pH dependent thermoresponsive behaviour of the poly(AAm-co-AN) in aqueous media. The results showed a high tolerance of UCST properties of poly(AAm-co-AN) under extreme acidic conditions. However, the thermoresponsivity is significantly affected during hydrolysis in basic condition. The report of Hou et al.28 describes the effects of solvent isotopes on the UCST behaviour of poly(AAm-co-AN), as well as the interaction mechanism between the copolymer chains and the solvent molecules. It was shown that the phase transition temperature is almost 10 °C higher in D2O than in H2O solution at the same concentration. Indeed, relatively “free” C![[double bond, length as m-dash]](https://www.rsc.org/images/entities/char_e001.gif) O groups in H2O solutions are believed to be responsible for lowering the UCST in H2O compared to D2O solution. However, the aggregation behaviour of this thermoresponsive polymeric systems above and below the UCST has not been yet described. The pH-induced water solubility switch of poly(AAm-co-AN) and its copolymer with either acrylic acid (AAc) or 4-vinylpyridine (4VP) was investigated by Zhang et al.29 The phase transition temperature of poly(AAm-co-AN) changed slightly (around 2 °C) by increasing pH from 3.0 to 10.0. However, a large drop in the phase transition temperature from 50 °C to 26 °C was observed for the poly(AAm-co-AN-co-AAc) with increasing pH from 2 to 3.5. Moreover, the phase transition temperature of poly(AAm-co-AN-co-4VP) decreased from 75 °C to 15 °C by reducing pH from 4.75 to 3.0. Zhao et al.30 prepared three different types of block copolymers using poly(AAm-co-AN) copolymer coupled with either hydrophobic polystyrene, hydrophilic poly(dimethyl acrylamide) or poly(N,N-dimethylaminoethylmethacrylate) presenting a phase transition temperature around 48, 14 and 20 °C respectively. The authors investigated the thermoresponsivity and aggregation behaviour of the obtained block copolymers and found reversible dispersion/aggregation of micelles, dissolution/formation of micelles, and reversal of the micelle core and corona in either water or buffer solution under varying the temperatures from 5 to 70 °C. In addition, Käfer et al.31 showed that the UCST-type single phase behaviour of poly(AAm-co-AN) can be extended to a double responsive behaviour, i.e. LCST–UCST-type in aqueous media by introduction of a poly(ethylene glycol) (PEG) block. The morphology of the poly(AAm-co-AN)-PEG block copolymer changes from micelles to agglomerates by increasing the surroundings temperature.
O groups in H2O solutions are believed to be responsible for lowering the UCST in H2O compared to D2O solution. However, the aggregation behaviour of this thermoresponsive polymeric systems above and below the UCST has not been yet described. The pH-induced water solubility switch of poly(AAm-co-AN) and its copolymer with either acrylic acid (AAc) or 4-vinylpyridine (4VP) was investigated by Zhang et al.29 The phase transition temperature of poly(AAm-co-AN) changed slightly (around 2 °C) by increasing pH from 3.0 to 10.0. However, a large drop in the phase transition temperature from 50 °C to 26 °C was observed for the poly(AAm-co-AN-co-AAc) with increasing pH from 2 to 3.5. Moreover, the phase transition temperature of poly(AAm-co-AN-co-4VP) decreased from 75 °C to 15 °C by reducing pH from 4.75 to 3.0. Zhao et al.30 prepared three different types of block copolymers using poly(AAm-co-AN) copolymer coupled with either hydrophobic polystyrene, hydrophilic poly(dimethyl acrylamide) or poly(N,N-dimethylaminoethylmethacrylate) presenting a phase transition temperature around 48, 14 and 20 °C respectively. The authors investigated the thermoresponsivity and aggregation behaviour of the obtained block copolymers and found reversible dispersion/aggregation of micelles, dissolution/formation of micelles, and reversal of the micelle core and corona in either water or buffer solution under varying the temperatures from 5 to 70 °C. In addition, Käfer et al.31 showed that the UCST-type single phase behaviour of poly(AAm-co-AN) can be extended to a double responsive behaviour, i.e. LCST–UCST-type in aqueous media by introduction of a poly(ethylene glycol) (PEG) block. The morphology of the poly(AAm-co-AN)-PEG block copolymer changes from micelles to agglomerates by increasing the surroundings temperature.
In this report, poly(AAm-co-AN) copolymers with different AN fractions were synthesized via reversible addition–fragmentation chain transfer (RAFT) polymerization. The temperature-induced phase transition of poly(AAm-co-AN) and the nature of its aggregation behaviour was investigated around the phase transition temperature in pure water and in the presence of electrolytes by turbidimetry, static and dynamic light scattering (SLS and DLS), small angle neutron scattering (SANS), and cryo-transmission electron microscopy (cryo-TEM) measurements. We describe the aggregation behaviour of poly(AAm-co-AN) above and below its phase transition temperature as the size of thermoresponsive polymeric systems is of prime importance for biomedical applications (as size dependent processes take place in the body)32 and is linked to the optical properties of a material that matter in materials science.33 It was observed that poly(AAm-co-AN) copolymer solutions show a UCST-type phase transition behaviour when the hydrophilic–lipophilic balance of the copolymer was adequate. The phase transition temperature was found to increase with increasing AN fraction, concentration of the copolymer solutions and copolymer chain length. The phase transition temperature was also influenced by the addition of different electrolytes into the copolymer solutions. Below the phase transition temperature of poly(AAm-co-AN), the copolymer chains were collapsed and aggregated. The size of the aggregates was found to be larger with increasing AN fraction or solution concentration. Above the phase transition temperature of poly(AAm-co-AN), the copolymer chains were in some cases found to be slightly associated and the extent of this association was related to the AN content in the copolymer. Based on the observed results, we propose a model for the phase transition and aggregation behaviour of poly(AAm-co-AN) depending on the AN fraction in the copolymer and the concentration of the solution.
2 Experimental
2.1 Materials
Acrylamide (Sigma Aldrich, >99%, electrophoresis grade), acrylonitrile (Fisher Scientific, >99%), 2,2′-azobis-(2,4-dimethylvaleronitrile) (ABDV) (Wako, 95%) and 4-cyano-4-[(dodecylsulfanylthiocarbonyl)sulfanyl]pentanoic acid (TTC) (Sigma Aldrich, 97%) were used as received. Dimethyl sulfoxide (DMSO) (Merck, >99%), methanol (Fischer Scientific, >99.9%) and other solvents were used without further purification. Ultrapure water was obtained from Sartorius system.2.2 Analytical techniques
 | (1) |
![[thin space (1/6-em)]](https://www.rsc.org/images/entities/char_2009.gif) sin(θ/2), with NA, n, λ0 and c are the Avogadro's constant, refractive index, wavelength in vacuum and the sample concentration in g mL−1, respectively. The specific refractive index increment of the solution (dn/dc) was measured with dndc 2010 with 620 nm light source (PSS, Mainz, Germany). The measured refractive index increment (dn/dc) of poly(AAm-co-AN) is ∼0.16 mL g−1 in water (Fig. S7 (ESI†)). To determine the weight average apparent molecular weight (Mw,app) of the copolymer solution, eqn (1) was expressed as:
sin(θ/2), with NA, n, λ0 and c are the Avogadro's constant, refractive index, wavelength in vacuum and the sample concentration in g mL−1, respectively. The specific refractive index increment of the solution (dn/dc) was measured with dndc 2010 with 620 nm light source (PSS, Mainz, Germany). The measured refractive index increment (dn/dc) of poly(AAm-co-AN) is ∼0.16 mL g−1 in water (Fig. S7 (ESI†)). To determine the weight average apparent molecular weight (Mw,app) of the copolymer solution, eqn (1) was expressed as: | (2) |
The Kc/R(θ → 0) can be obtained by extrapolating the Kc/R(θ) vs. q2 plot (Zimm plot) to zero scattering angle. The measurements were done at scattering angles between 26 and 158°. The sample was equilibrated for 2 min at each temperature.
3 Results and discussion
3.1 Synthesis
Poly(AAm-co-AN) copolymers were prepared via controlled RAFT polymerization and by varying the AN feed for a given molecular weight (∼20![[thin space (1/6-em)]](https://www.rsc.org/images/entities/char_2009.gif) 000 g mol−1) and different molecular weight with constant AN content (FAN) of 0.144 (see Table 1). A statistical copolymerization takes place given that acrylonitrile and acrylamide have similar Q and e values.21 The structures of the obtained copolymers were confirmed by NMR (shown in Fig. S2 (ESI†)) and ATR-FTIR measurements (shown in Fig. S4 (ESI†)). Molecular weight and molecular weight distribution were determined by gel permeation chromatography (GPC) (Fig. S3 (ESI†)). Copolymer with FAN = 0.042 was soluble in water and did not show any phase transition, i.e. appearing transparent at both lower and higher temperatures. Copolymer with FAN = 0.262 was insoluble in water even when subjected to high temperatures (90 °C) for a longer period of time (8 hours) with or without sonication. Copolymers with FAN from 0.086 to 0.221 exhibited UCST behaviour, i.e. displaying turbidity at lower temperatures and becoming transparent at higher temperatures (see Fig. 1). The summary of the visual observations of the solubility/phase behaviour of the copolymers in water is presented in Table 1. The visual observation confirmed that copolymers composed of hydrophilic acrylamide and “hydroneutral” acrylonitrile can show a UCST-type phase transition in water. It is well known that polyacrylamide forms intra and intermolecular hydrogen bonds in aqueous solution.37,38 However, the homopolymer of polyacrylamide does not show a UCST due to its high hydrophilicity. On the other hand, poly(acrylonitrile) is insoluble in water. The insolubility of poly(acrylonitrile) in water strongly suggests that the –CN group has a low hydration number. Therefore the nitrile groups despite being polar should be considered as “hydroneutral”; “hydroneutral” groups are defined as those functional groups displaying hydrophilicities intermediate between those of hydrophilic and hydrophobic groups with an hydration number close to 0.39 However, the nitrogen atom of the –CN group can act as a proton acceptor for hydrogen bond formation with water molecules because of the presence of a lone-pair electron orbital. The –CN group has thus the capacity to form weak hydrogen bonds with water molecules but these bonds have lifetimes or interaction times close to or shorter than the rotational relaxation time of free water molecules.39 The synergy of acrylamide and acrylonitrile contribute to the UCST behaviour of poly(AAm-co-AN) copolymer. Turbidimetry, SLS, DLS and SANS measurements were performed to study the phase transition and aggregation behaviour of poly(AAm-co-AN) copolymer solution as a function of AN contents, concentrations, as well as addition of electrolyte. For the DLS data, the cloud point temperature (TCP) was determined from the minimum of the first derivative of the DLS curves (Fig. S5 (ESI†)) and for turbidimetry measurements, the cloud point temperature was taken as the initial turn point from the cooling cycle and final turn point from the heating cycle in the obtained transmittance versus temperature curves.
000 g mol−1) and different molecular weight with constant AN content (FAN) of 0.144 (see Table 1). A statistical copolymerization takes place given that acrylonitrile and acrylamide have similar Q and e values.21 The structures of the obtained copolymers were confirmed by NMR (shown in Fig. S2 (ESI†)) and ATR-FTIR measurements (shown in Fig. S4 (ESI†)). Molecular weight and molecular weight distribution were determined by gel permeation chromatography (GPC) (Fig. S3 (ESI†)). Copolymer with FAN = 0.042 was soluble in water and did not show any phase transition, i.e. appearing transparent at both lower and higher temperatures. Copolymer with FAN = 0.262 was insoluble in water even when subjected to high temperatures (90 °C) for a longer period of time (8 hours) with or without sonication. Copolymers with FAN from 0.086 to 0.221 exhibited UCST behaviour, i.e. displaying turbidity at lower temperatures and becoming transparent at higher temperatures (see Fig. 1). The summary of the visual observations of the solubility/phase behaviour of the copolymers in water is presented in Table 1. The visual observation confirmed that copolymers composed of hydrophilic acrylamide and “hydroneutral” acrylonitrile can show a UCST-type phase transition in water. It is well known that polyacrylamide forms intra and intermolecular hydrogen bonds in aqueous solution.37,38 However, the homopolymer of polyacrylamide does not show a UCST due to its high hydrophilicity. On the other hand, poly(acrylonitrile) is insoluble in water. The insolubility of poly(acrylonitrile) in water strongly suggests that the –CN group has a low hydration number. Therefore the nitrile groups despite being polar should be considered as “hydroneutral”; “hydroneutral” groups are defined as those functional groups displaying hydrophilicities intermediate between those of hydrophilic and hydrophobic groups with an hydration number close to 0.39 However, the nitrogen atom of the –CN group can act as a proton acceptor for hydrogen bond formation with water molecules because of the presence of a lone-pair electron orbital. The –CN group has thus the capacity to form weak hydrogen bonds with water molecules but these bonds have lifetimes or interaction times close to or shorter than the rotational relaxation time of free water molecules.39 The synergy of acrylamide and acrylonitrile contribute to the UCST behaviour of poly(AAm-co-AN) copolymer. Turbidimetry, SLS, DLS and SANS measurements were performed to study the phase transition and aggregation behaviour of poly(AAm-co-AN) copolymer solution as a function of AN contents, concentrations, as well as addition of electrolyte. For the DLS data, the cloud point temperature (TCP) was determined from the minimum of the first derivative of the DLS curves (Fig. S5 (ESI†)) and for turbidimetry measurements, the cloud point temperature was taken as the initial turn point from the cooling cycle and final turn point from the heating cycle in the obtained transmittance versus temperature curves.
| No. | AN fraction in feed (fAN) | AN fraction in copolymer (FAN) | M w (kDa) | PDI | Phase behaviour in waterb |
T
CP [°C] at 1 mg mL−1![[thin space (1/6-em)]](https://www.rsc.org/images/entities/char_2009.gif) c c |
|---|---|---|---|---|---|---|
| a Determined by GPC measurements. b Visual observation during heating and cooling. c Measured by turbidimetry. d c = 5 mg mL−1. | ||||||
| P1 | 0.100 | 0.042 | 18.1 | 1.26 | Soluble | — |
| P2 | 0.145 | 0.086 | 18.3 | 1.29 | UCST | 5.5 |
| P3 | 0.185 | 0.110 | 19.1 | 1.37 | UCST | 16.1 |
| P4 | 0.225 | 0.144 | 20.2 | 1.27 | UCST | 29.9 |
| P5 | 0.225 | 0.150 | 28.3 | 1.31 | UCST | 36.2d |
| P6 | 0.225 | 0.139 | 11.4 | 1.34 | UCST | 26.3d |
| P7 | 0.250 | 0.197 | 21.3 | 1.24 | UCST | 45.8 |
| P8 | 0.275 | 0.221 | 18.5 | 1.42 | UCST | 56.5 |
| P9 | 0.320 | 0.262 | 22.6 | 1.58 | Insoluble | — |
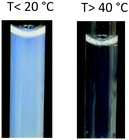 | ||
| Fig. 1 Visual observation of poly(AAm-co-AN) copolymer in pure water (sample P4, FAN = 0.144) at lower (T < 20 °C) and higher (T > 40 °C) temperatures. | ||
3.2 Effect of AN content on phase transition and aggregation behaviour
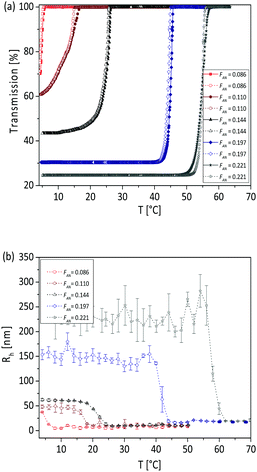
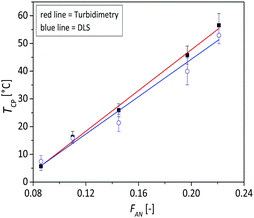
At concentration of 1 mg mL−1 it can be observed from the turbidimetry measurements that the phase transition temperature of the copolymer increases with increasing AN fraction in the copolymer (Fig. 2a): the TCP was found to be 5.5, 16.1, 25.9, 45.8 and 56.5 °C, for FAN of 0.086, 0.11, 0.144, 0.197 and 0.221 respectively. At the same concentration of 1 mg mL−1, the calculated phase transition temperature via DLS were 8, 17, 23, 44 and 57 °C (Fig. 2b) with hysteresis of 1–2 °C for the FAN of 0.086, 0.11, 0.144, 0.197 and 0.221, respectively. The obtained TCP from turbidimetry and from DLS measurements are plotted in Fig. 3. There is on average ±3 °C difference in the TCP obtained by DLS as compared to turbidimetry measurement, which can be due to the different heating rate and data analysis. The obtained TCP plot confirms a linear increase of phase transition temperature of the poly(AAm-co-AN) with increasing AN fraction in the copolymer. These results are expected, since increasing the fraction of hydroneutral acrylonitrile groups in the copolymer chain reduces the polymer–solvent interactions, i.e. increases the polymer–polymer interactions, thereby resulting in a shift of the phase transition temperature to higher temperatures (more energy needed to break the polymer–polymer interactions).Below the phase transition temperature of the studied copolymers the hydrodynamic radius (Rh) of the copolymer was found to remain constant in the collapsed state for a given AN fraction: 37, 47, 63, 155 and 241 nm for the sample FAN of 0.086, 0.11, 0.144, 0.197 and 0.221, respectively (Table 2), indicating the formation of larger aggregates with increasing AN fraction in the copolymer. These results were consistent with the turbidimetry measurements (see Fig. 2a), where the turbidity increased in the collapsed state with increasing FAN in the copolymer. Turbidity is the interaction between light and suspended particles in solution. The way in which the sample containing suspended particles interferes with transmittance light is related to the size, shape and composition of the particles and to the wavelength of the incident light.40 With higher acrylonitrile content in the copolymer, the copolymer chains further minimize their interaction with water, resulting in more copolymer chains aggregating to form larger aggregates. Such stable aggregates (without using stabilizing agent), or so-called mesoglobules, can be formed by thermoresponsive polymers in the collapsed state as reported by Tenhu and co-workers.41
| F AN | R h [nm] at 3 °C | R h [nm] at 60 °C |
|---|---|---|
| 0.086 | 37 | 5 |
| 0.110 | 47 | 10 |
| 0.144 | 63 | 13 |
| 0.197 | 155 | 17 |
| 0.221 | 241 | 20 |
Above the phase transition temperature of the samples, where the copolymer chains are expanded and hydrated in water, the Rh was found to be of 5, 10, 13, 17 and 20 nm for the FAN of 0.086, 0.11, 0.144, 0.197 and 0.221 respectively (Table 2), indicating a weak association between the copolymer chains. These are usually considered as “small associations” rather than unimers of copolymer chains,42 most probably via the acrylamide units that are known to associate and form “multimacroion domains” when dissolved in water.43 Such association of copolymer chains in the hydrated state was also observed in the literature.44,45
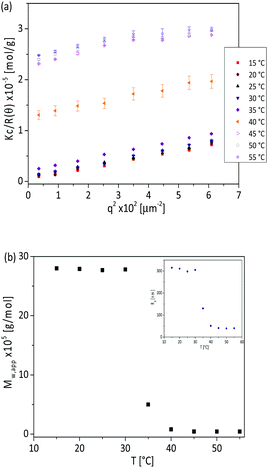
In order to get insights into the nature of the aggregates, we performed SLS measurements as a function of temperature. Fig. 4a shows the corresponding Kc/R(θ) vs. q2 plot of poly(AAm-co-AN) (FAN = 0.197) at a concentration of 1.3 mg mL−1 and selected temperatures from 15 to 55 °C. Below the phase transition temperature, a downward curves is observed and showed a linear relationship with q2, indicating the presence of aggregates.44 However, a downward curve is only observed at lower scattering angles above the phase transition temperature where small aggregates and unimers coexist. The apparent molecular weight (Mw,app) of the aggregates below TCP and associated copolymer chains above TCP, were calculated by extrapolation of q of the Kc/R(θ) vs. q2 plot at lower scattering angles. The obtained Mw,app is plotted as a function of temperature (Fig. 4b). Below 30 °C the Mw,app is 140 times larger than the single polymer chain (Mw ∼ 2 × 10⁴ g mol−1 from GPC) and remained constant, confirming the formation of stable mesoglobules. At T ∼ 30 °C the Mw,app decreased abruptly until a plateau was reached around 40 °C. In this plateau region the aggregation number was ∼4–5, i.e. small aggregates in the collapsed state are present in solution. In addition, the radius of gyration (Rg) was determined as a function of temperature. The obtained Rg values are presented in the inset of Fig. 4b. The Rg remained constant at ∼300 nm for T < 30 °C, then started to decrease and reached a plateau with a constant size of 40 nm in the collapsed state (T > 40 °C).
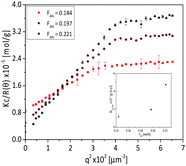
A detailed analysis of the association behaviour above the phase transition temperature was further done as a function of AN content with SLS measurements. Fig. 5 shows the corresponding Kc/R(θ) vs. q2 plot of the poly(AAm-co-AN) solution (c = 5 mg mL−1) at T = 55 °C. In this case the apparent molecular weight (Mw,app) of the associated chains was calculated by extrapolation in the lower q region of the Kc/R(θ) vs. q2 plot. The obtained Mw,app are shown in the inset of the Fig. 5. The Mw,app is 23 times larger compared to the single polymer chain with increasing FAN from 0.144 to 0.221. This confirmed the presence of small aggregates even above the phase transition temperature.
From the SANS measurements such aggregation and association behaviour below and above the phase transition temperature of poly(AAm-co-AN) can be confirmed. Fig. 6 shows the obtained results from SANS measurements. SANS curves for the samples with a polymer concentration of 5 mg mL−1 were fitted with an empirical formula of the form:
 | (3) |
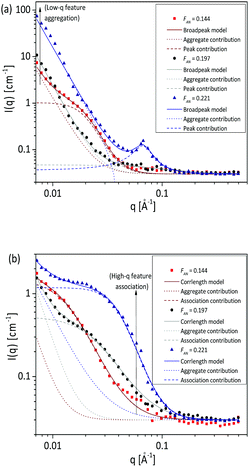 | ||
| Fig. 6 SANS measurements of poly(AAm-co-AN) in D2O at 25 °C (collapsed state) (a) and at 60 °C (soluble state) (b) with varying the acrylonitrile fractions (FAN) from 0.144 to 0.221 and fixed concentration of 5 mg mL−1. SANS data are fitted to the eqn (3). Individual contributions due to the aggregates and polymer chains interactions are shown with dashed lines. | ||
The length ξ is the correlation length of the polymer chains, while the exponent m is related to the excluded volume parameter of the polymer. The degree of aggregation in the system was determined by the relative magnitudes of the scaling factors A and C. A correlation peak for the sample with AN content 0.221 and 25 °C required modification of the fitting formula to take into account a peak at q0:
 | (4) |
The SANS results show significantly different scattering behaviour of the samples at 25 °C and 60 °C as expected. At 25 °C (below phase transition temperature of the copolymers), the scattering is dominated by the first term in eqn (3), showing that the systems have formed aggregates (see Fig. 6a). At 60 °C, the scattering from the polymer chains dominates the system. Small upturns at very low q suggest a small amount of clustering is present at these temperatures (see Fig. 6b).
The effect of AN content on the behaviour of the systems can be seen at both 25 °C and 60 °C. At 60 °C, increasing AN content shortens the correlation length of the polymer chains, from 75 Å at 0.144 AN fraction to 25 Å at FAN 0.221, reflecting the increasing polymer–polymer interactions at higher AN contents. At 25 °C, increasing AN content increases the relative strength of the scattering contribution from the aggregates. At FAN of 0.144, the scattering contribution from the polymer chains is visible in the high q region, with the aggregations increasing scattering intensity in the low q region to produce an upturn at low q. As the AN content is increased, the scattering from the aggregates increasingly dominates, with the power law decay due to aggregates increasing. At the highest AN content of 0.221, in addition to a power law decay, there is a correlation peak in the scattering at q0 = 0.066 Å. This indicates there are large aggregates forming in the system, within which the polymer chains strongly interact, to produce a degree of ordering of the chains with a characteristic distance of 95 Å.
3.3 Effect of concentration on phase transition and aggregation behaviour
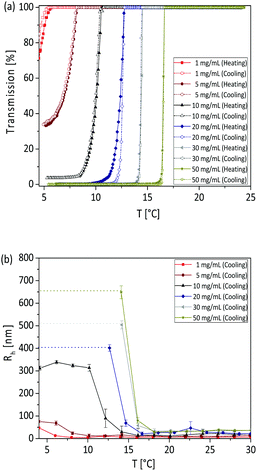
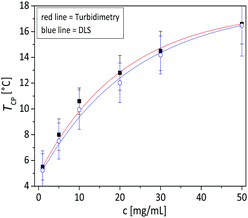
We investigated the phase transition and aggregation behaviour of poly(AAm-co-AN) copolymer solutions from diluted (1 mg mL−1) to concentrated (50 mg mL−1) conditions. Above the concentration of 50 mg mL−1 the copolymer solutions were not stable and precipitated after 3 to 4 h. The obtained concentration dependent turbidity curves and DLS measurements are shown in Fig. 7. From both measurements, it was observed that the phase transition temperature of poly(AAm-co-AN) varies, typically 10 °C over the measured concentration range. Concentration dependent phase transition temperature were also observed in the report of Hou et al.28 and Seuring et al.21 From the turbidimetry measurements, the TCP was found around 5.5, 8, 10.6, 12.8, 14.5 and 16.6 °C for the concentration of 1, 5, 10, 20, 30 and 50 mg mL−1, respectively (for the sample P2 where the AN fraction in the copolymer (FAN) is 0.086). To confirm the results obtained from the turbidimetry measurements, DLS measurements were used as a complementary technique. The calculated TCP were 6.1, 8.13, 10.3, 12.17, 14.09 and 16.14 for the concentration of 1, 5, 10, 20, 30 and 50 mg mL−1 respectively, which is in good agreement with the results found with the turbidimetry measurements. The obtained TCP are plotted as a function of concentration in Fig. 8. The shape of the fitting curves indicates an exponential increase of the phase transition temperature with increasing concentration of poly(AAm-co-AN) solution. It is known that entanglement between the copolymer chains is favoured at higher concentration. Therefore, a network structure could form in the solutions that results in higher phase transition temperature. The influence of chain entanglement onto phase transition behaviour has also been observed previously.47,48 This offers the possibility to fine tune the thermal response of a system by adjusting the concentration of the solutions.In the collapsed state, it can be seen that the transmission value increases upon dilution of the solution in the dilute regime (see turbidity curves in Fig. 7a). Moreover, the obtained average Rh values from DLS measurements, presented in Table 3, displayed a increase of Rh from 46 to 654 nm with raising the concentration from 1 to 50 mg mL−1 below the TCP of the solutions. This result clearly indicates the formation of larger aggregates with increasing the concentration of the solutions. In the report of Hou et al.28 a similar trend was observed: the more concentrated the poly(AAm-co-AN) solution the larger the hydrodynamic diameter was. The larger aggregates formation can be explained in two ways: firstly, increasing concentration enhanced the formation of entanglement between the copolymer chains, leading to the formation of larger aggregates. Secondly, the higher concentrations weaken the hydrogen bonding between polymer chains and water molecules, and strengthen the intra/inter-chain hydrophobic interactions of the polymer leading to the formation of aggregates. It has been documented that the size of the mesoglobules formed in collapsed state increases with increasing the concentrations of the solution.41,49
| Conc. [mg mL−1] | R h [nm] at 3 °C | R h [nm] at 30 °C |
|---|---|---|
| 1 | 46 | 5 |
| 5 | 76 | 14 |
| 10 | 329 | 19 |
| 20 | 404 | 21 |
| 30 | 512 | 32 |
| 50 | 654 | 37 |
Above the phase transition temperature of poly(AAm-co-AN), concentration dependent association behaviour was observed. The obtained Rh at 30 °C is shown in Table 3. The Rh for the normal polymer chains is usually smaller than 10 nm.42,50 The Rh found in this study is around 5 to 37 nm, clearly showing an association between the copolymer chains, involving a small number of unimers (copolymer chains), even at temperatures above the phase transition.
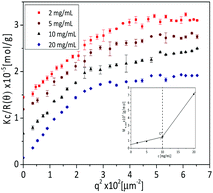
The association between copolymer chains leading to the formation of smaller aggregates above the phase transition temperature were further examined by SLS measurements at different concentrations. Fig. 9 shows the Kc/R(θ) vs. q2 plot of poly(AAm-co-AN) (FAN = 0.086) at T = 30 °C. The Mw,app was calculated by using eqn (2) and extrapolating the q → 0 at lower region. The inset of Fig. 9 shows that the Mw,app increased slowly with increasing concentration of the solutions at c < 10 mg mL−1, then an abrupt increase of Mw,app was observed with increasing concentrations for concentrations above 10 mg mL−1 (inset of Fig. 9). The Mw,app was 35 times larger compared to a single polymer chain (Mw ∼ 20![[thin space (1/6-em)]](https://www.rsc.org/images/entities/char_2009.gif) 000 g mol−1 by GPC) for a concentration of 20 mg mL−1.
000 g mol−1 by GPC) for a concentration of 20 mg mL−1.
According to the polymer solutions theory, it is possible to differentiate between the dilute and semidilute or concentrated states where the polymer coils overlap and interact. The change from isolated coils to overlapping ones can be characterized by the overlap concentration C* given by:51
 | (5) |
![[thin space (1/6-em)]](https://www.rsc.org/images/entities/char_2009.gif) 200 g mol−1) in the coil state (Rh = 5 nm, see Table 3), the Rg is estimated to be 7.5 nm according to the reference. C* is 12.9 mg mL−1 using eqn (5). This determined overlap concentration is in agreement with the experimental concentration of ∼10 mg mL−1, where the apparent molecular weight abruptly increased (inset Fig. 9). In the condensed state different copolymer chains interpenetrate, which leads to the association between copolymer chains and the formation of aggregates.
200 g mol−1) in the coil state (Rh = 5 nm, see Table 3), the Rg is estimated to be 7.5 nm according to the reference. C* is 12.9 mg mL−1 using eqn (5). This determined overlap concentration is in agreement with the experimental concentration of ∼10 mg mL−1, where the apparent molecular weight abruptly increased (inset Fig. 9). In the condensed state different copolymer chains interpenetrate, which leads to the association between copolymer chains and the formation of aggregates.
SANS measurements for two different concentrations as presented in Fig. 10 also confirmed the results obtained from turbidimetry, SLS and DLS measurements. The sample with 0.144 AN fraction was measured at 5 mg mL−1 and 10 mg mL−1 polymer concentration. At higher concentration, an additional Lorentzian term with scaling factor D provides an average description of the scattering curves in the medium q region:
 | (6) |
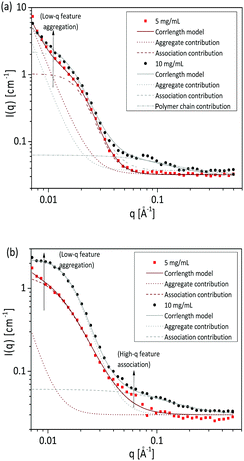 | ||
| Fig. 10 SANS measurements of poly(acrylamide-co-acrylonitrile) copolymer in D2O at 25 °C (collapsed state) (a) and at 60 °C (soluble state) (b) with varying concentration at fixed acrylonitrile fraction (FAN) of 0.144. SANS data are fitted to the eqn (3) and also the association contribution and polymer chain contribution is included. | ||
For both concentrations at 25 °C, the same scattering behaviour in the medium q region was observed. The presence of aggregates can be seen from the upturn at low q due to power law decay. Fig. 10a shows that the aggregates are concentration dependent where the aggregate contribution increases with increasing concentration of the solutions. While at 60 °C, an increase in the polymer concentration from 5 mg mL−1 to 10 mg mL−1 causes the aggregate contribution to vanish, and the correlation length to decrease from 75 to 62 Å. It can be observed in Fig. 10b that the association contribution, which is observed at high-q value, is enhanced by the higher polymer concentration.
3.4 Effect of copolymer chain length on the UCST behaviour
The effect of the copolymer chain length on the UCST of poly(AAm-co-AN) was studied at a fixed AN fraction (FAN = 0.144) and concentration of the solution (5 mg mL−1). As can be seen from the turbidity curves (Fig. 11), the phase transition temperature is shifted to higher temperatures with increasing copolymer chain length. The phase transition temperature increased around 10 °C by increasing molecular weight from 11.4 to 28.3 kDa. By increasing the copolymer molecular weight, the overall amount of acrylonitrile groups increases in the copolymer chains. These acrylonitrile groups enhance the polymer–polymer interactions. Therefore, higher temperatures are needed to reduce these polymer–polymer interactions. Such behaviour is also observed for LCST polymers. The LCST is expected to decrease with increasing molecular weight based on the changes in the polymer–solvent interactions.53,54 It is also well known that the LCSTs of PNIPAM can be decreased by the presence of hydrophobic end groups and increased by hydrophilic end groups.55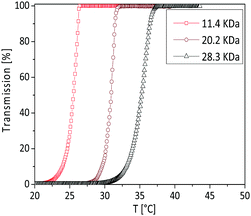 | ||
| Fig. 11 Turbidity curves of the poly(AAm-co-AN) in water by varying the copolymer chain length in cooling cycle. The concentration of the solution is 5 mg mL−1. | ||
3.5 Effect of electrolyte on phase transition and aggregation behaviour
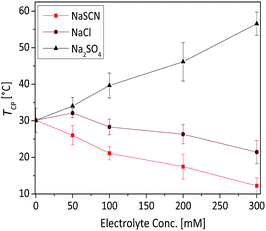
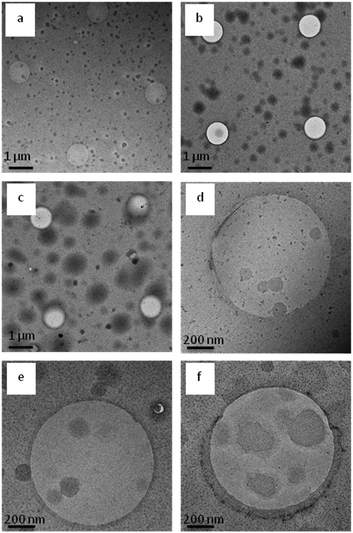
The phase transition and aggregation behaviour of poly(AAm-co-AN) solution at fixed acrylonitrile fraction (FAN) of 0.144 was studied as a function of different types of electrolytes (NaSCN, NaCl and Na2SO4) and electrolyte concentrations (50, 100, 200 and 300 mM). Since the cation (Na+) was kept constant in this study while the anion was varied, the influence of the latest on the phase transition temperature of poly(AAm-co-AN) was determined. The obtained results from the turbidimetry measurements are presented in Fig. 12. NaCl has a minimal influence on the phase transition temperature of copolymer solution (30 °C in pure water). The phase transition temperature slightly increased below 50 mM of NaCl and then decreased to 20 °C by the addition of 300 mM NaCl. This tendency was previously observed by Hou et al.28 who found that the phase transition temperature of poly(AAm-co-AN) decreased of about 5 °C upon addition of 150 mM NaCl.56 The effect of NaCl on poly(AAm-co-AN) is comparable to that of UCST type PNAGA system. Liu et al.57 observed that the phase transition temperature of non-ionic PNAGA increases with addition of small amount of NaCl. Nevertheless, the phase transition temperature steadily decreased with further addition of NaCl and the phase transition temperature disappeared with the addition of around 1000 mM of NaCl. This behaviour is also typically observed in LCST polymers like PNIPAM, and in such cases the effect can be explained by intra and intermoleculer effect.58–61 The addition of 300 mM “chaotropic” NaSCN salt (the terms “chaotrope” and “kosmotrope” refer to the classification of salts according to the Hofmeister series;62 chaotropic agents increase the hydrophobic effects within the solution, while kosmotropic agents contribute to the stability and structure of water–water interactions) leads to a significant decrease of the phase transition temperature from 30 to 12 °C. The decrease of the phase transition temperature by addition of NaSCN and NaCl can occur due to polarization effects, surface tension, as well as direct ion binding. The “kosmotropic” Na2SO4 salt showed the most pronounced effect on the phase transition temperature of poly(AAm-co-AN). In this case the phase transition temperature increased from 30 to 56 °C by addition of 300 mM Na2SO4 to the solution. This effect was expected as when more ions are present in the solution they interfere with the hydrogen bonding between H2O molecules and copolymer chains disrupting the regular hydration shell around the temperature sensitive polymer chains. Therefore interchain and intrachain hydrophobic effects among the polymer chains are favoured, which increases the phase transition temperature of the poly(AAm-co-AN).In order to better understand the structures of the formed aggregates and correlate them with the data obtained from DLS, turbidimetry and SANS measurements, the systems were visualized by cryo-TEM measurements (see Fig. 13). Cryo-TEM measurements were obtained from pure water solution of poly(AAm-co-AN) with different AN fractions and concentrations of the solutions. We observed that the formed mesoglobules are spherical in shape and their size increases with increasing AN fractions and concentrations of the solutions as found by the other techniques.
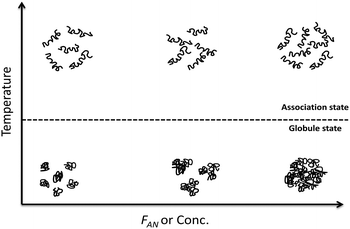
Fig. 14 represents the proposed model for the temperature-induced aggregation and association behaviour of the poly(AAm-co-AN) in pure water. By varying the composition and concentration, various aggregation behaviour of poly(AAm-co-AN) were observed by turbidimetry, SLS, DLS and SANS measurements. The increasing amount of AN contents in the copolymers resulted in stronger hydrophobic interactions between copolymer chains which lead to the formation of larger aggregates in the dehydrated state of poly(AAm-co-AN). While in the hydrated state, the hydroneutral part of the chains (acrylonitrile in the copolymers) plays a role in the association, that results in a weak association, i.e. small aggregates, in the soluble state.
4 Conclusions
In this report, a robust UCST-type poly(AAm-co-AN) copolymer with different compositions was prepared through RAFT polymerization. The temperature-induced phase transition and the aggregation behaviour of the poly(AAm-co-AN) were studied according to different AN contents in the copolymer, various concentrations of the copolymer solutions and copolymer chain lengths in pure water. The addition of electrolyte to the system was also investigated. The temperature-induced phase transition and aggregation behaviour was systematically studied by a combination of turbidimetry, static and dynamic light scattering, SANS measurements and cryo-TEM. We found that the phase transition temperature is composition dependent: the phase transition temperature increases with increasing acrylonitrile content in the copolymers. From the DLS measurements it was shown that the poly(AAm-co-AN) chains are hydrated (coil) above the phase transition temperature and are present either as unimers or small aggregates composed of few polymeric chains (Rh less than 40 nm) depending on the AN content in the copolymer. Upon cooling the hydrodynamic radii increased (up to few hundreds of nm), indicating the formation of larger aggregates. The size of the aggregates was found to increase with increasing acrylonitrile content in the copolymer, as confirmed by static and dynamic light scattering, SANS and cryo-TEM measurements. In addition, the phase transition temperature and aggregation behaviour strongly depend on the solution concentration. The phase transition temperature decreased upon dilution of the copolymer solutions. The aggregate size was found to increase with increasing solution concentrations below phase transition temperature, indicating the formation of larger aggregates. Furthermore, the phase transition temperature can be tuned by addition of electrolyte into the solutions or by varying the copolymer chain length.Acknowledgements
We would like to thank Marlies Gräwert (Max Planck Institute of Colloids and Interfaces, Potsdam-Golm, Germany) for the GPC measurements. We are grateful to Dr. Christoph Böttcher as well as Dr. Boris Schade (Freie Universität Berlin, Germany) for the cryo-TEM measurements. We are grateful to the group of Prof. Helmut Schlaad (University of Potsdam, Germany) for the opportunity to use their turbidimetry spectrometer. We also would like to thank Frank Milczewski for the ATR-FTIR measurements. We also thank HZB for the allocation of neutron beamtime. Funding by the BAM-MIS program is acknowledged.References
- M. R. Aguilar and J. S. Roman, Smart polymers and their applications, part I: Types of smart polymer, Woodhead Publishing, Cambridge, UK, 1st edn, 2014 Search PubMed.
- G. Pan, Q. Guo, C. Cao, H. Yang and B. Li, Soft Matter, 2013, 9, 3840–3850 RSC.
- D. Roy, W. L. A. Brooks and B. S. Sumerlin, Chem. Soc. Rev., 2013, 42, 7214–7243 RSC.
- C. Scholz and J. Kressler, Tailored polymer architectures for pharmaceutical and biomedical applications, Oxford University Press, Oxford, UK, 2013 Search PubMed.
- D. Schmaljohann, Adv. Drug Delivery Rev., 2006, 58, 1655–1670 CrossRef CAS PubMed.
- M. Füllbrandt, E. Ermilova, A. Asadujjaman, R. Hölzel, F. F. Bier, R. von Klitzing and A. Schönhals, J. Phys. Chem. B, 2014, 118, 3750–3759 CrossRef PubMed.
- M. Dan, Y. Su, X. Xiao, S. Li and W. Zhang, Macromolecules, 2013, 46, 3137–3146 CrossRef CAS.
- E. A. Clark and J. E. G. Lipson, Polymer, 2012, 53, 536–545 CrossRef CAS.
- V. Aseyev, H. Tenhu and F. Winnik, Adv. Polym. Sci., 2011, 242, 29–89 CrossRef CAS.
- J. Seuring and S. Agarwal, Macromol. Rapid Commun., 2012, 33, 1898–1920 CrossRef CAS PubMed.
- J. Seuring and S. Agarwal, ACS Macro Lett., 2013, 2, 597–600 CrossRef CAS.
- Z. Zhang, T. Chao, S. Chen and S. Jiang, Langmuir, 2006, 22, 10072–10077 CrossRef CAS PubMed.
- V. Mishra, S.-H. Jung, H. M. Jeong and H.-i. Lee, Polym. Chem., 2014, 5, 2411–2416 RSC.
- A. Fujihara, N. Shimada, A. Maruyama, K. Ishihara, K. Nakai and S.-i. Yusa, Soft Matter, 2015, 11, 5204–5213 RSC.
- Q. Zhang and R. Hoogenboom, Chem. Commun., 2015, 51, 70–73 RSC.
- J. Niskanen and H. Tenhu, Polym. Chem., 2016 10.1039/C6PY01612J.
- H. C. Haas and N. W. Schuler, J. Polym. Sci., Part B: Polym. Lett., 1964, 2, 1095–1096 CrossRef.
- N. M. Brahme and W. T. Smith, J. Polym. Sci., Polym. Chem. Ed., 1984, 22, 813–820 CrossRef CAS.
- J. Seuring, F. M. Bayer, K. Huber and S. Agarwal, Macromolecules, 2012, 45, 374–384 CrossRef CAS.
- F. Liu, J. Seuring and S. Agarwal, Polym. Chem., 2013, 4, 3123–3131 RSC.
- J. Seuring and S. Agarwal, Macromolecules, 2012, 45, 3910–3918 CrossRef CAS.
- C. Echeverria, D. López and C. Mijangos, Macromolecules, 2009, 42, 9118–9123 CrossRef CAS.
- H. Katono, A. Maruyama, K. Sanui, N. Ogata, T. Okano and Y. Sakurai, J. Controlled Release, 1991, 16, 215–227 CrossRef CAS.
- P. Bouillot and B. Vincent, Colloid Polym. Sci., 2000, 278, 74–79 CAS.
- F. Liu, S. Jiang, L. Ionov and S. Agarwal, Polym. Chem., 2015, 6, 2769–2776 RSC.
- G. Huang, H. Li, S.-T. Feng, X. Li, G. Tong, J. Liu, C. Quan, Q. Jiang, C. Zhang and Z. Li, Macromol. Chem. Phys., 2015, 216, 1014–1023 CrossRef CAS.
- B. A. Pineda-Contreras, H. Schmalz and S. Agarwal, Polym. Chem., 2016, 7, 1979–1986 RSC.
- L. Hou and P. Wu, Soft Matter, 2015, 11, 7059–7065 RSC.
- H. Zhang, S. Guo, W. Fan and Y. Zhao, Macromolecules, 2016, 49, 1424–1433 CrossRef CAS.
- H. Zhang, X. Tong and Y. Zhao, Langmuir, 2014, 30, 11433–11441 CrossRef CAS PubMed.
- F. Käfer, F. Liu, U. Stahlschmidt, V. Jérôme, R. Freitag, M. Karg and S. Agarwal, Langmuir, 2015, 31, 8940–8946 CrossRef PubMed.
- S. Mitragotri and J. Lahann, Nat. Mater., 2009, 8, 15–23 CrossRef CAS PubMed.
- M. I. Tiwana, S. J. Redmond and N. H. Lovell, Sens. Actuators, A, 2012, 179, 17–31 CrossRef CAS.
- B. J. Frisken, Appl. Opt., 2001, 40, 4087–4091 CrossRef CAS PubMed.
- B. H. Zimm, J. Chem. Phys., 1945, 13, 141–145 CrossRef CAS.
- K. Vogtt, M. Siebenburger, D. Clemens, C. Rabe, P. Lindner, M. Russina, M. Fromme, F. Mezei and M. Ballauff, J. Appl. Crystallogr., 2014, 47, 237–244 CrossRef CAS.
- F. A. Bovey and G. V. D. Tiers, J. Polym. Sci., Part A: Gen. Pap., 1963, 1, 849–861 CrossRef CAS.
- N. Tanaka, K. Ito and H. Kitano, Macromolecules, 1994, 27, 540–544 CrossRef CAS.
- N. Sagawa and T. Shikata, Phys. Chem. Chem. Phys., 2014, 16, 13262–13270 RSC.
- M. M. A. Elsayed and G. Cevc, Pharm. Res., 2011, 28, 2204–2222 CrossRef CAS PubMed.
- V. Aseyev, S. Hietala, A. Laukkanen, M. Nuopponen, O. Confortini, F. E. Du Prez and H. Tenhu, Polymer, 2005, 46, 7118–7131 CrossRef CAS.
- S. Sun, P. Wu, W. Zhang, W. Zhang and X. Zhu, Soft Matter, 2013, 9, 1807–1816 RSC.
- L. Deng, C. Wang, Z.-C. Li and D. Liang, Macromolecules, 2010, 43, 3004–3010 CrossRef CAS.
- J. Yan, W. Ji, E. Chen, Z. Li and D. Liang, Macromolecules, 2008, 41, 4908–4913 CrossRef CAS.
- J. V. M. Weaver, I. Bannister, K. L. Robinson, X. Bories-Azeau, S. P. Armes, M. Smallridge and P. McKenna, Macromolecules, 2004, 37, 2395–2403 CrossRef CAS.
- B. Hammouda, D. L. Ho and S. Kline, Macromolecules, 2004, 37, 6932–6937 CrossRef CAS.
- Y. Lin, Y.-g. Shangguan, B.-w. Qiu, W.-w. Yu, F. Chen, Z.-w. Guo and Q. Zheng, Chin. J. Polym. Sci., 2015, 33, 869–879 CrossRef CAS.
- K. Yang, Y. Z. Yang, C. L. Hu, Y. Y. Huang, W. K. Zhang, X. D. Chen and M. Q. Zhang, Macromol. Chem. Phys., 2012, 213, 1735–1741 CrossRef CAS.
- A. V. Gorelov, A. Du Chesne and K. A. Dawson, Phys. A, 1997, 240, 443–452 CrossRef CAS.
- P. J. Roth, T. P. Davis and A. B. Lowe, Macromolecules, 2012, 45, 3221–3230 CrossRef CAS.
- P.-G. Gennes, Scaling Concepts in Polymer Physics, Cornell University Press, Ithaca, New York, 1979 Search PubMed.
- J. G. Kirkwood and J. Riseman, J. Chem. Phys., 1948, 16, 565–573 CrossRef CAS.
- D. Patterson, Macromolecules, 1969, 2, 672–677 CrossRef CAS.
- D. G. Lessard, M. Ousalem and X. X. Zhu, Can. J. Chem., 2001, 79, 1870–1874 CrossRef CAS.
- Y. Xia, X. Yin, N. A. D. Burke and H. D. H. Stöver, Macromolecules, 2005, 38, 5937–5943 CrossRef CAS.
- V. Hildebrand, A. Laschewsky and D. Zehm, J. Biomater. Sci., Polym. Ed., 2014, 25, 1602–1618 CrossRef CAS PubMed.
- F. Liu, J. Seuring and S. Agarwal, J. Polym. Sci., Part A: Polym. Chem., 2012, 50, 4920–4928 CrossRef CAS.
- L. Lu, Z. Wang and Y. Cao, J. Wuhan Univ. Technol., Mater. Sci. Ed., 2012, 27, 285–289 CrossRef CAS.
- T. Liu, J. Fang, Y. Zhang and Z. Zeng, Macromol. Res., 2008, 16, 670–675 CrossRef CAS.
- X.-M. Liu, K. P. Pramoda, Y.-Y. Yang, S. Y. Chow and C. He, Biomaterials, 2004, 25, 2619–2628 CrossRef CAS PubMed.
- F. Garret-Flaudy and R. Freitag, J. Polym. Sci., Part A: Polym. Chem., 2000, 38, 4218–4229 CrossRef CAS.
- F. Hofmeister, Arch. Exp. Pathol. Pharmakol., 1888, 24, 247–260 Search PubMed.
Footnote |
| † Electronic supplementary information (ESI) available: Summary of the synthesis [Table S1], 1H-NMR spectrum [Fig. S2], ATR-FTIR spectrum [Fig. S3], GPC data [Fig. S4], ATR-FTIR calibration curves [Fig. S5], DLS curves [Fig. S6] and dn/dc curve [Fig. S7]. See DOI: 10.1039/c6sm02262f |
| This journal is © The Royal Society of Chemistry 2017 |

