DOI:
10.1039/C6SM01848C
(Paper)
Soft Matter, 2017,
13, 1764-1772
Localization in an idealized heterogeneous elastic sheet
Received
10th August 2016
, Accepted 21st December 2016
First published on 22nd December 2016
Abstract
Localized deformation is ubiquitous in many natural and engineering materials as they approach failure, and a significant effort has been made to understand localization processes with simple continuum models. Real materials are much more commonly heterogeneous but it is unclear exactly how heterogeneity affects outcomes. In this work we study the response of an idealized heterogenous elastic sheet on a soft foundation as it is uniaxially compressed. The patterned surface layers are created by selective ultraviolet/ozone treatment of the top surface of a polydimethylsiloxane (PDMS) sample using a TEM grid as a mask. By controlling the exposure time of UV/O3, samples ranging from continuous thin films to sets of isolated small plates were created. We find that patterned regions noticeably localize while bulk regions appear as uniform wrinkles, and that local and global strains depend on the pattern pitch, exposure levels and the treatment protocol. Remarkably, various responses can be modeled using well-understood theory that ignores pattern details aside from the small distance between the adjacent boundaries and the local value of strain.
1 Introduction
Many modern technologies, such as thin film electronics, conformal antennas, structural composites, and self-folding origami and kirigami structures, involve the lamination of a thin film to a substrate which is consequently subjected to various sources of stress.1–6 While the technologies have created many interesting applied problems, they have also motivated fundamental questions regarding precisely what happens to a thin film as it is embedding in three dimensional space. A thin film laminated to a semi-infinite soft substrate is a particularly popular model system, largely because of the emergence of a sinusoidal wrinkle pattern when the composite is subject to compression.7–11 More importantly, the system is known to localize stress in a smooth, easily observed manner which facilitates the study of the nonlinear features related to the ultimate failure of devices.12–15
Recently, several researchers have examined the transition of uniform undulations to localized bending in a homogeneous system (for example, a polymer thin film) on either elastic or fluid substrates as a uniaxial, compressive stress is applied.12–15 The work demonstrates that such transitions occur in large systems when Δ ∼ L/3, where Δ is the lateral displacement of the ends of the thin film and L is the length of the sheet. One of the other features emerging from these models is that the localization process is tied to the boundaries, and therefore the approximation of an infinite sheet is no longer considered reasonable.
Not surprisingly, both these observations become more complicated in situations where the plate is less idealized and can no longer be considered smooth (for example, in biologically relevant situations). Heterogeneous systems of many types are now experimentally known to localize and buckle in an analogous manner to more controlled experiments.16–21 Early work directly examining the presence of many boundaries showed that localization can emerge directly from vanishing applied displacements, and can be tuned by the pitch of a repeating variation in plate thickness.18,22 Later observations showed that ultrathin polymer films also quickly localize without any additional patterning, implying that they or the elastic foundation may be more heterogeneous than is commonly assumed.22,23 An interesting question remains: is localization in the two systems, pure homogeneous elastic sheets or heterogeneous thin films, at all related?
In this paper, we present our experimental study of the response of nanoscale films with an idealized, well controlled, non-homogenous stiffness that are subjected to uniaxial compression. The patterned surface layers are created by selective ultraviolet/ozone (UV/O3) treatment of the top surface of polydimethylsiloxane (PDMS) using a TEM grid as a mask.24–26 By controlling the exposure time of UV/O3, samples ranging from continuous thin films to sets of isolated small plates were created. Laser scanning confocal microscopy is used to image the three dimensional shape of the surface as it buckles and ultimately forms localized structures. Because the system is easily controlled we can show how the pattern forces the plate to have a non-uniform strain distribution, how the strain localization leads to localized bending and how the pattern pitch influences these two properties. Ultimately we show that taking into account the local strain of each region of patterns, the distance between the two boundaries of each part of the pattern is all that is necessary to reconcile the system behavior with predictions made for thin, finite length, uniform elastic plates.
2 Experimental
2.1 Sample preparation
Cross-linked polydimethylesiloxane (PDMS) was made by mixing a 40![[thin space (1/6-em)]](https://www.rsc.org/images/entities/char_2009.gif) :1 by weight ratio of pre-polymers and cross-linkers (Dow chemical Corning, Sylgard 184). PDMS is a Si based organic polymer that is a highly viscous liquid at room temperature and is optically transparent. Thorough mixing is needed in order to ensure that the curing agent is uniformly distributed. Mixing introduces air bubbles that need to be removed before curing by placing the sample in a vacuum oven (Napco 5831). To expedite the process pressure can be ramped up and down until the trapped bubbles are fully removed. After degassing, the polymer mixture is poured into a 9.6 cm × 9.6 cm Petri dish to a thickness of about 3 mm and cured at 85 °C for two hours in the vacuum oven. Samples are then cooled to room temperature in the oven for the next 12–15 hours. After cooling, the PDMS is cut into rectangular sections of 1.2 cm × 7 cm × 0.3 cm.
:1 by weight ratio of pre-polymers and cross-linkers (Dow chemical Corning, Sylgard 184). PDMS is a Si based organic polymer that is a highly viscous liquid at room temperature and is optically transparent. Thorough mixing is needed in order to ensure that the curing agent is uniformly distributed. Mixing introduces air bubbles that need to be removed before curing by placing the sample in a vacuum oven (Napco 5831). To expedite the process pressure can be ramped up and down until the trapped bubbles are fully removed. After degassing, the polymer mixture is poured into a 9.6 cm × 9.6 cm Petri dish to a thickness of about 3 mm and cured at 85 °C for two hours in the vacuum oven. Samples are then cooled to room temperature in the oven for the next 12–15 hours. After cooling, the PDMS is cut into rectangular sections of 1.2 cm × 7 cm × 0.3 cm.
2.2 UVO treatment
The treatment of the PDMS sample with UV/O3 is carried out in air at atmospheric pressure in a standard UV/O3 Chamber (Jelight Company, Inc., Model 42). The sample is placed approximately 0.5 cm below the lamp. The treatment results in an interaction between UV radiation and air. The low pressure mercury lamp emits radiation strongly at two wavelengths, 184.9 nm and 253.7 nm. The first wavelength is absorbed by oxygen molecules in air and leads to the generation of ozone while the second wavelength is absorbed by ozone, not by molecular oxygen. The molecular oxygen at 184.9 nm dissociates to form atomic oxygen and eventually, the atomic oxygen reacts with molecular oxygen to form ozone. The 254.7 nm wavelength is strongly absorbed by ozone which dissociates into molecular oxygen and atomic oxygen.27,28
The surface of PDMS is chemically modified when it is exposed to UV/O3 radiation.29,30 The process involves photo-sensitized oxidation where the molecules of the PDMS are excited or dissociated by the absorption of short-wavelength UV radiation resulting in free radical formation. The free radicals eventually react with the atomic oxygen and ozone to form some bi-products such as carbon dioxide (CO2) and water (H2O) as shown by Berdichevsky et al.28 and Ouyang et al.27 In a polydimethylsiloxane (PDMS), which is a silicon containing polymer treated with UV/O3, the methyl groups are dissociated by the absorption of UV/O3 radiation. This desorption of the organic portion (methyl group) leaves the siloxane (silicon backbone) component behind. As a result, an oxide layer is formed on the surface of the PDMS when atomic oxygen combines with the silicon remaining behind. Given a long enough exposure, the silicon oxide layer creates a continuous thin film. It has been demonstrated that the thickness of the layer is directly proportional to the duration of treatment.31
2.3 Surface patterning
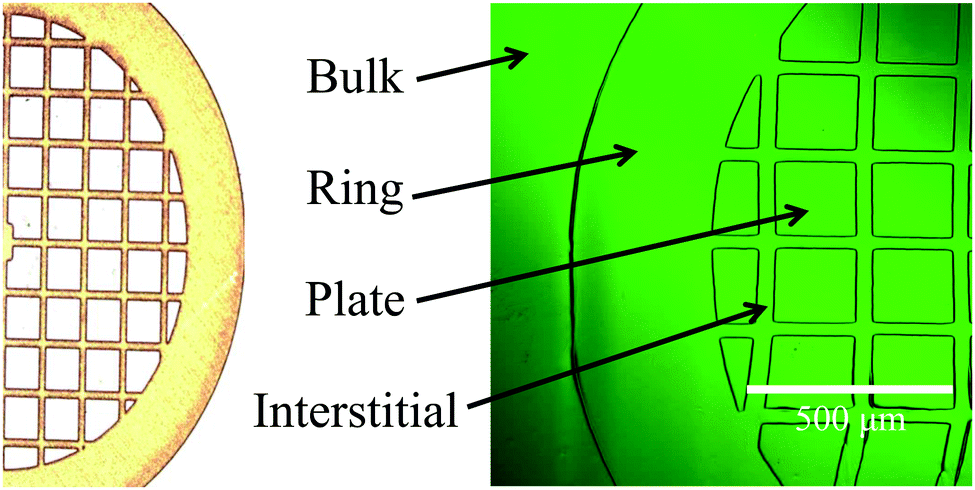
The UV/O3 surface modification technique is well-established,27–30 however it has not yet been used in the studies of localized deformation. To this end, the strategy depicted in Fig. 1 has been used in order to create a controlled surface pattern. First, an initially flat, un-patterned PDMS is stretched to a pre-determined strain (see Fig. 1a). Then, the PDMS is loaded using a Transmission Electron Microscopy (TEM) grid as a mask (see Fig. 1b). Finally, the pre-stretched PDMS loaded with the grid is placed in a UV/O3 Chamber (Jelight Company, Inc., Model 42) and exposed to UV/O3 (see Fig. 1c). Ultraviolet/ozone treatment of the top layer of the PDMS this way yields four distinct regions: (1) bulk region – a region which is not covered by the mask, (2) ring region – a region covered by the wide edge of the mask and is not initially exposed to UV/O3, (3) plate region – a region exposed to the UV/O3 through the hole of the mask, and (4) the interstitial region – a region protected from UV/O3 by the mask located between two fully exposed plates.
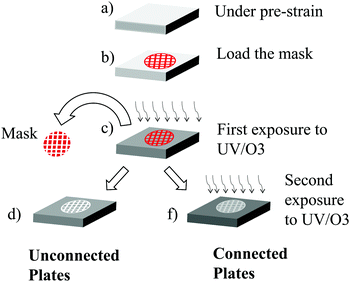 |
| | Fig. 1 Schematic illustration of the ultraviolet–ozone (UV/O3) treatment of the surface of PDMS for pattern transfer. A pre-stretched PDMS substrate (a) loaded with a TEM grid mask (b) irradiated to UV light (c). As a result of the UV/O3, the surface of the PDMS is patterned (d). Re-exposing the sample to UV/O3 (f) thickens the already exposed regions and adds a new thinner layer on the previously covered region. | |
The first two regions are referred to as continuous or bulk regions while the last two as patterned regions. Although the continuous region and the isolated plates are exposed to the same dose of UV/O3, they differ in plate size and boundary conditions. The bulk regions are considered infinite in length and unbound whereas the plates are confined by the interstitial regions. Notably, this boundary can be manipulated through a second UV/O3 exposure once the mask has been removed. In the first route (see Fig. 1d), both the ring and the interstitial regions are not exposed to UV/O3 in the experiment. They are protected by the mask. When the sample is re-oxidized after the mask has been removed (see Fig. 1f), thinner layers of SiOx will be created between the plates. Of course, the thickness of the plates will also increase. Doubly exposed samples are termed “connected” whereas singly exposed samples are termed “unconnected”. Typical examples of continuous (ring and bulk) and patterned (interstitial and plate) surfaces are shown in Fig. 2.
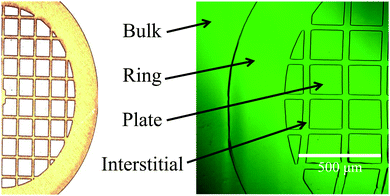 |
| | Fig. 2 Illustration of part of the TEM grid used (left) and the four regions formed during surface patterning (right). The squares of the grid are 205 μm × 205 μm and a bar of 45 μm wide. The confocal microscopy image of a sample in a pre-strain state is shown to the right. Ideally the plates and the interstitial regions take the size of the hole and the bar width. | |
2.4 Buckling mechanics
The idealized heterogeneous surface, with its surface patterned into regions with variable stiffness, is then slowly released from its initial pre-strain. The release of the pre-strain makes the solid surface feel an increasing compressive stress and the surface eventually buckles. Note that while the pre-strain is released, the Poisson effect induces tensile stress in the direction perpendicular to compression.
2.5 Imaging
All samples are imaged in situ as they are compressed using a Laser Scanning Confocal Microscope (LSCM – Olympus Fluoview 1000). Reflection intensity is used to locate the surface coordinates of the buckling sample, or alternatively a dye (Nile Red) is added to the PDMS after UV exposure. A 488 nm line is used to excite the dye. Images are processed using ImageJ software (Fig. 3).
 |
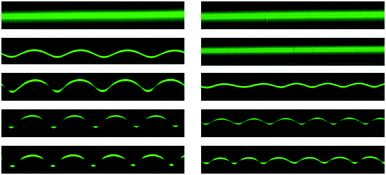
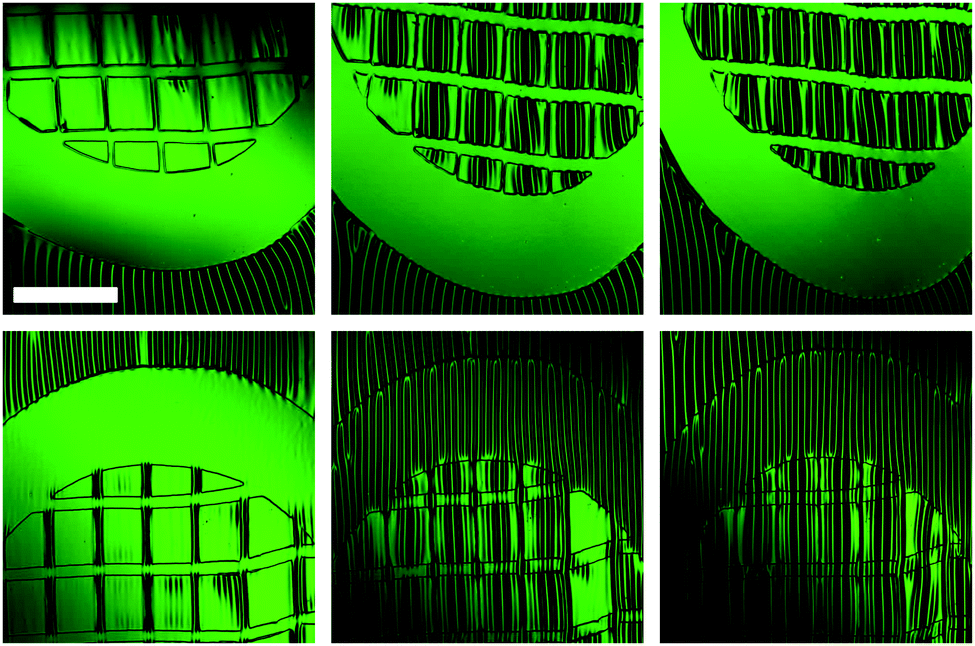
| | Fig. 3 Typical laser scanning confocal microscopy images of unconnected plates (top row) and connected plates (bottom row) under the same mechanical strains of 14%, 22.4% and 28.2%, from left to right. Both the connected and unconnected plates are treated for the same total amount of treatment time – 9 minutes, however, the interstitial region receives no exposure in the unconnected plates experiment (top) whereas the interstitial region has been exposed for 3 min in the connected plates experiment (bottom). The scale bar represents 500 μm. | |
3 Results and discussion
3.1 Wrinkling
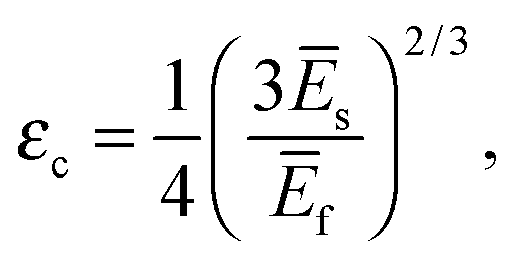
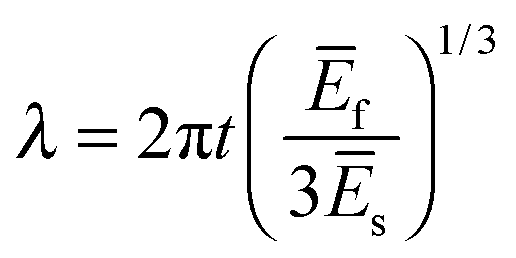
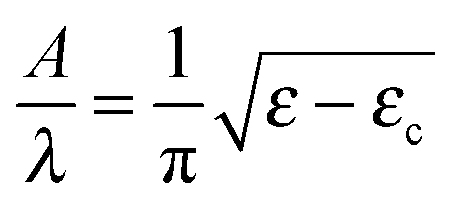
When a system consisting of a thin film bound to an elastic substrate is subjected to a compressive stress, the film will initially be compressed in-plane. As compression increases, the film will buckle out of plane and form a repetitive sinusoidal pattern (also known as surface wrinkling) when a critical wrinkling strain, εc, is reached.7–11,32 For large plates under small compressions the critical strain is predicted to be| | 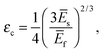 | (1) |
where Ē = E/(1 − ν2), E is Young's modulus, ν is the Poisson ratio and the subscripts refer to the surface film (f) or the substrate (s). The pattern spacing, λ and amplitude, A, for a film of thickness t in the small strain limit are given by| | 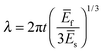 | (2) |
and| |  | (3) |
respectively.
While the UV/O3 and PDMS system used here buckles in an analogous manner, it is important to note that all the variables in the above scaling predictions may not be easily quantified. The UV exposure creates a gradient in properties from the surface into the bulk of the PDMS, and while narrow, the gradient does modify to the basic mechanics.30,33 Furthermore, exposure to UV/O3 will increase both the modulus and the thickness of the surface layer, in effect mixing the two properties. In this work we are only interested in the contrast between two regions in terms of their preferred wavelength adopted in each region. Therefore, simply characterizing the wrinkling pattern in the absence of any boundary is sufficient.
The basic result can be seen in Fig. 4 and 5. At fixed strain, the wavelength and wrinkle amplitude grow in a monotonic manner with increasing exposure time. Samples have different critical wrinkling strains depending on their total exposure, with longer exposures leading to smaller critical strains (we find a range from ∼5–15%). In the entire range of applied compressive strains used in this work (<∼35% due to failure of the bulk substrate) no localization is observed in the unpatterned regions. Fig. 5 shows the cross-sections of the surface of two samples under several applied strains, where it can be seen that no peak becomes large relative to its peers. We do notice a symmetry breaking at high strains, where the valleys of the sinusoid become increasingly sharp. This pattern is usually attributed to a nonlinear foundation, which is quite likely for the PDMS and high strains used here, and will not be discussed further.34–38
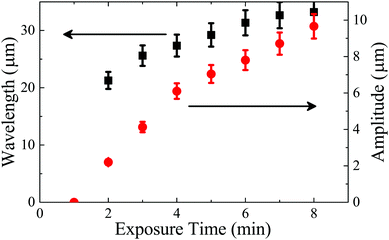 |
| | Fig. 4 Evolution of the buckling wavelength and amplitude as a function of various ultraviolet/ozone (UV/O3) exposure times. The total applied strain was 31% in this experiment, and no wrinkles were detected after one minute of exposure as indicated by the zero amplitude data point. | |
 |
| | Fig. 5 Cross-sectional view typical of the continuous regions (fully exposed ‘bulk’ on the left and partially exposed ‘ring’ on the right) of a sample under mechanical strains of 0%, −10.9%, −20.1%, −23.0% and −27.5% (top down). The sample was exposed for a total of 9 min. The masked region was exposed for 3 min. The length scales are similar in each image; the height is 30 μm and the width is 153 μm. | |
3.2 Local strain
When the system is subjected to compressive stress, the patterned regions are observed to deviate from the bulk behaviour of an unpatterned plate. Most notably, localization (which we broadly define as occurring when a particular region attains a larger amplitude than its neighbours) is observed to occur in many of the pattern geometries examined. Localization is found in samples patterned once so that there is no oxide layer present in the interstitial region (unconnected plates), as well as in patterned samples exposed a second time such that the interstitial region also has a solid surface layer (connected plates). Coincidentally with the localization, we also observe a variation in the onset strain of wrinkling in patterned samples. In this section, we focus on the latter observation as its roots are in the heterogeneous motion of the patterned plate. The motion of the plate is, in turn, key to understanding the localization process itself.
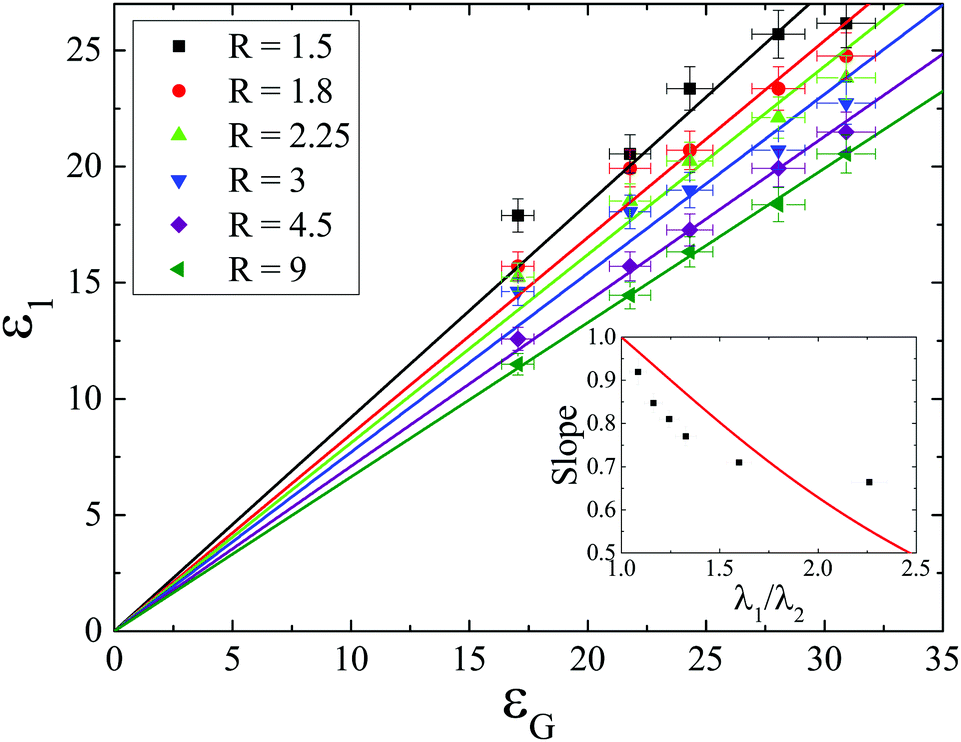
If a plate is broken into compliant and stiff regions, compliant regions will compress to a higher degree than will stiff regions at a given global (end to end) level of compression. In essence, different regions of a pattern are at different local levels of strain. This leads to three different relevant strains – a global strain, εG, a stiff region strain, ε1, and a compliant region strain ε2 and three different stretch ratios (λ). Fig. 6 shows the locally measured strain in the thicker region of the pattern as a function of the globally applied strain. The experiment was repeated on samples having varying degrees of exposure in the interstitial region, with R denoting the ratio of total exposure time (9 minutes in this case) to the interstitial exposure time. All show a linear relation, however, greater contrast in exposure leads to a greater deviation of the slope from 1.
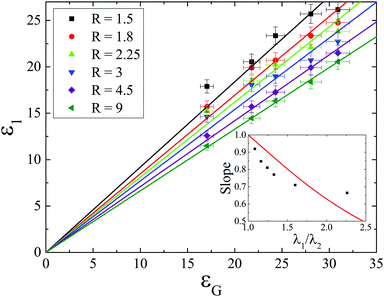 |
| | Fig. 6 Local compressive strain in the plate region of a patterned sample as a function of globally applied compressive strain. The plate region has a width of 204 μm and the pattern has a pitch of 254 μm. Several different exposure ratios (R ≡ total exposure time/interstitial exposure time) are shown, each showing linear behaviour with varying slopes. The inset shows the slope from the linear fit as a function of λ1/λ2. The model described in the text is plotted as a solid curve with no free parameters. | |
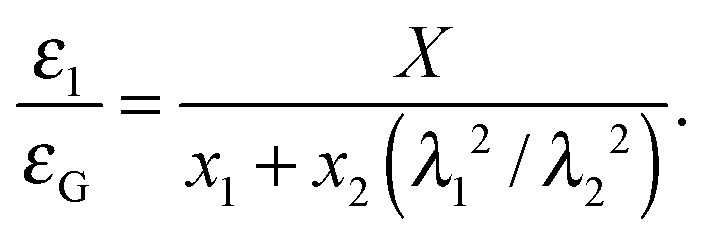
The plate can be modeled as two springs in series (k1 and k2) representing, the plate (1) and the interstitial region (2). Initially, the springs have lengths of x1 and x2, and a total length X = x1 + x2. A global compression of ΔX, once applied, will be distributed over the two springs as ΔX = Δx1 + Δx2. This is more useful and written in terms of the strains
where Δ
X/
X =
εG, Δ
x1/
x1 =
ε1 and Δ
x2/
x2 =
ε2.
εG,
ε1 and
ε2 are, respectively, the global strain, and the local strain of the first or second region.
Under an assumption of small strain, the restoring forces of a wrinkled plate are of the form 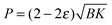 , where B is the plates' bending modulus and K is the substrate stiffness.13–15 The force in each region of the pattern must balance, which allows us to equate the local strain to the local wavelength as ε1/ε2 = λ22/λ12 (as λ = (B/K)1/4 and the foundation stiffness is equal in all regions). This ultimately leads to the relationship between the local strain and the globally applied strain, as:
| |  | (5) |
The relation is linear, qualitatively matching the data of
Fig. 6. The slopes are predicted only to be a function of the ratio of wavelengths between the two regions once the pattern geometry is fixed. The inset shows the slopes from the linear fits as a function of wavelength, and the model is shown as a solid line. We note that the model has no free parameters and largely captures the behaviour of the experiment.
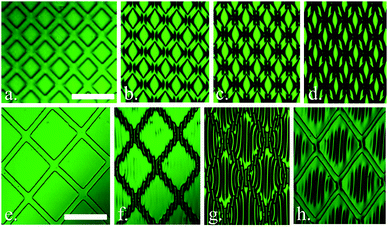
3.3 Morphologies
Experiments were conducted using 7 different grid spacings, several different substrate moduli, several different exposure ratios and at varying levels of compression in order to clearly examine the transition from wrinkling to localization in a heterogeneous plate. Typical morphologies can be seen in Fig. 7, where several cross-sections are displayed. When the patterned plates are small with respect to the natural wrinkling wavelength, morphologies can deviate from the smooth sinusoidal symmetry of an unpatterned plate. The unique morphologies are interesting and have been observed in other systems.26,39,40 These morphologies will simply be classified as wrinkled here as no peak grows at the cost of its neighbours and there is therefore no collective localization of stress in the system (Fig. 7a–d are wrinkled even though d is asymmetric). When a peak does become larger than its neighbours the sample is labeled as localized, even if the localized peak is not central to a plate (both Fig. 7e and f show the localized peak).
 |
| | Fig. 7 Morphology of several wrinkled samples. All images show the same height and width scales, with the exception of image (f) which is halved – the scale bar indicates 20 μm in all. The images show the plate sizes of 7.5 μm (a), 28 μm (b), 38 μm (c), 45 μm (d), 90 μm (e), and 204 μm (f). The pitches are 12.5 μm, 51 μm, 64 μm, 64 μm, 127 μm, and 254 μm, respectively. | |
The morphology data can be summarized in a plot of wavelength normalized by plate size, L, against local strain in excess of the critical wrinkling strain. All samples below zero are undeformed. As strain increases from zero, samples wrinkle and localize. The state diagram shows a clear separation of data into wrinkled and localized regimes. Several samples show a clear progression from wrinkle to localization as strain is increased, however some samples (large λ/L) show no localization or (small λ/L) no wrinkling. The large λ/L regime is limited by the total allowable applied strain (the PDMS fractures). The small λ/L regions access a reasonable range of strains, but pass quickly through wrinkling to localization. In fact when λ/L ∼ 0.2 wrinkles are no longer detectable between the initial buckling and the onset of localization.
Bulk regions are not explicitly included in this plot as their plate size L is very large and ill-defined. Recent theoretical work predicts the bulk system to be localized from zero applied strain, however, the dominant peak's amplitude is predicted to be so close to that of its neighbours that it is effectively indistinguishable from them.13–15 Such a prediction would be consistent with the trends we observe; bulk regions are not observed to localize. With this in mind, the transition between wrinkling and localization can be identified as an increasing function of strain which asymptotically approaches the origin at low strain. The exact form of the function (shown in red) will be discussed below.
Additionally, we note no morphological differences related to the boundaries of the plates (connected plates or unconnected plates), when the local strain is considered. In terms of global strain, plates with connected boundaries reach localization faster than plates that have free boundaries. This is entirely consistent with the analysis of Section 3.2, soft interstitial regions ‘absorb’ much more compression than do rigid interstitial regions.
3.4 Localization in small plates
The symmetry of the localization around the center of the plate, particularly evident in the larger pitch patterns, hints that the origin of the localization observed with the patterned substrates relates to the plate itself rather than any collective effect arising from the pattern. We therefore adopt the hypothesis that the localization which occurs in this system arises from the small distance between the plate boundaries (small plates) and the local level of strain (e.g. the distance the plate boundaries move). Many researchers have demonstrated the transition of uniform undulations to localizations of thin polymer films having homogeneous stiffness experimentally,12,23 numerically13 and analytically.13,14 These works have provided a great insight into systems with a uniform stiffness and in the limit of plate sizes approaching infinity.13 Much less work has explicitly considered the case of small plates.15,26,39,41
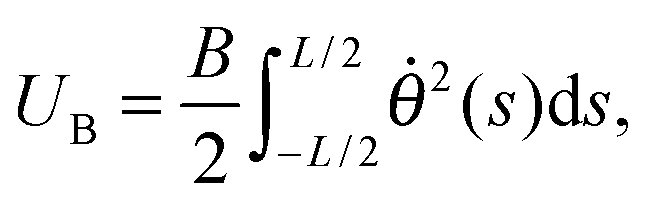
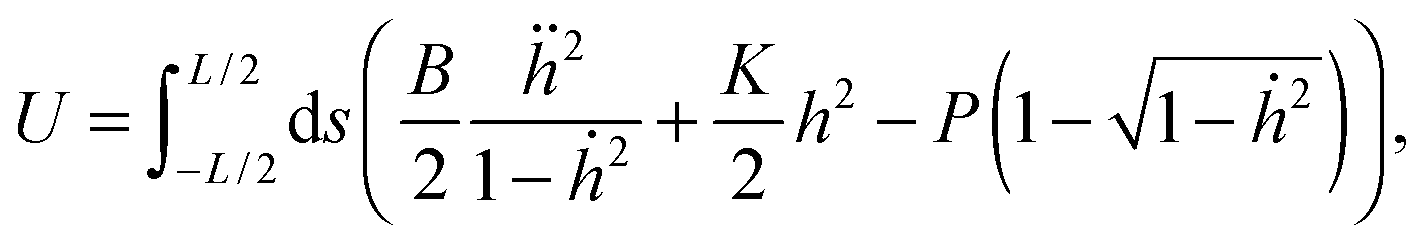
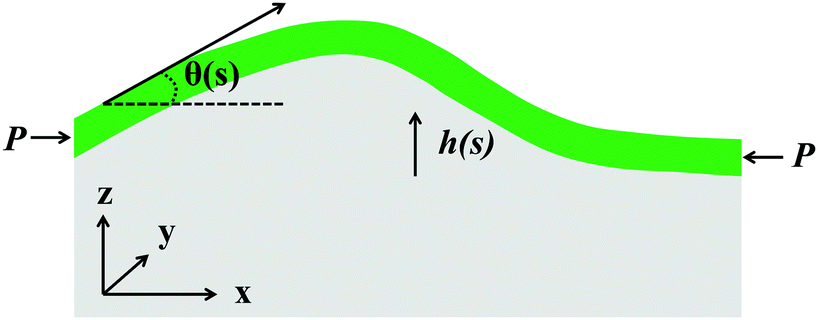
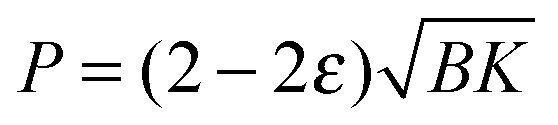
In this section, we consider a model consisting of a small plate of length L, width w, and bending stiffness B attached to a uniform foundation of stiffness K, which we compare with experimentally measured topographies arising from the patterned system. We follow the basic method of Diamant,13,15,42 and the geometric details are shown in Fig. 9. When the system is uniaxially compressed along the x-axis, a distance Δ by the force per unit length P, the initially flat plate deforms into the xy-plane. The strain energy created by the external work is distributed over plate bending, UB, and substrate deformation, US energies. The bending energy is given by
| |  | (6) |
where
θ(
s) is the angle of the tangent to the curve
h(
s).
s is a coordinate system that follows the contour of the plate as illustrated in
Fig. 9. The strain energy is given by
| |  | (7) |
The corresponding horizontal deflection,
Δ, is related to the deformation through the inextensibility of the plate
| |  | (8) |
The total energy,
| | 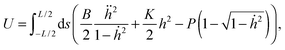 | (9) |
can be minimized, yielding the following differential equation:
| |  | (10) |
where
d = 1 −
ḣ2.
Eqn (10) can then be solved numerically, with the addition of appropriate boundary conditions to yield the deformation profile,
h(
s).
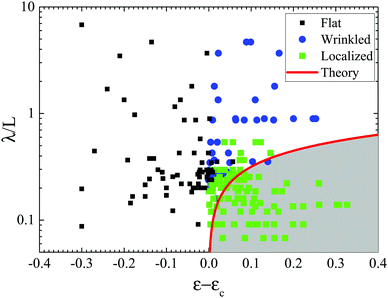 |
| | Fig. 8 Diagram summarizing the observed morphologies. Black squares represent the flat morphologies, blue circles represent the periodic morphologies and green squares show the localized samples. The axis is local wavelength normalized by the plate size and local strain minus the critical wrinkling strain. Negative values indicate that the system is below the critical wrinkling strain. | |
 |
| | Fig. 9 Schematic view of buckling of the thin plate on an elastic foundation. The angle θ gives the position of the tangent line as a function of arc length. The deflection profile is expressed as h(s). | |
The fourth order equation requires four boundary conditions, which are chosen from the experiment. For example, the boundary conditions used for the continuous systems were: h(−L) = h(L) = constant and ḣ(−L) = ḣ(L) = 0. In the patterned regions, different boundary conditions were required for the connected and unconnected plates, as might be expected. In both connected and unconnected plates, the profile is even (h(s) = h(−s), and the integration is made from −L/2 to 0 for simplicity). For the connected plates: h(−L/2) = constant, h(0) = h0, and ḣ(−L/2) = ḣ(0) = 0. Similarly, for the unconnected plates: h(−L/2) = constant, h(0) = −h0, ḣ(0) = 0 and ḧ(−L/2) = 0. Again, the constants and h0 are supplied from the experiment, leaving no other free parameters.
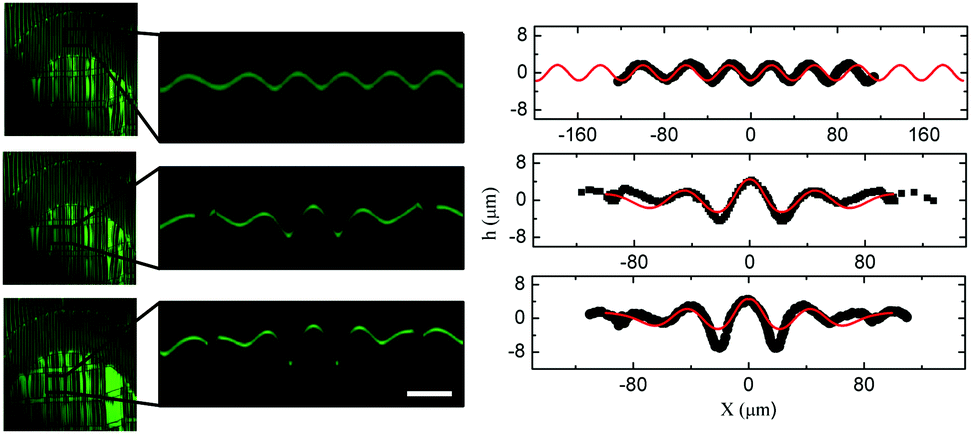
The model results are compared with the experimentally measured topographies in Fig. 10 and 11. Fig. 10 shows a “connected plates” experiment, where the interstitial region has been exposed for 3 minutes and the pattern region has been exposed for a total of 9 minutes. Contrasting boundary conditions are shown in Fig. 11, where the interstitial region has not been exposed to UV/O3 (unconnected plates). In all the cases, there is remarkable agreement between the data obtained from experiment and numerical modeling, especially in the low strain limit. As confinement increases, there are some signs of disagreement which is likely due to non-Hookean features of the rubber.38 Similar sharp ‘valleys’ are often seen in the bulk regions at high strains as noted earlier.
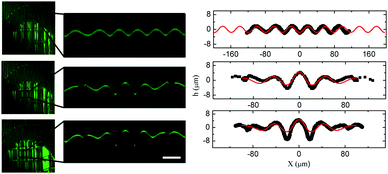 |
| | Fig. 10 Comparisons of the experimental (black) and numerical modeling (red) of the deformation height profile, h(x), of the ring region and the connected plate under mechanical strains of 19.72%, 22.38% and 28.15%, respectively. Note that the experimental and numerical data are not matching for the bulk region (top right). That is because the L for the numerical calculation is set to a large number to account for the unbound plate compared to the experimental data which is constrained by the image size captured. The scale bar represents 40 μm. | |
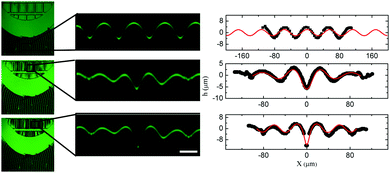 |
| | Fig. 11 Comparisons of the experimental (black) and numerical modeling (red) of the deformation height profile, h(x) of the bulk region and an unconnected plate under mechanical strains of 19.72%, 22.38% and 28.15%, respectively. Note that the experimental and numerical data are not matching for the ring region (top right). That is because the plate length is set to a large number to account for the unbound plate for the ring compared to the experimental data which is constrained by the image size captured. The scale bar represents 40 μm. | |
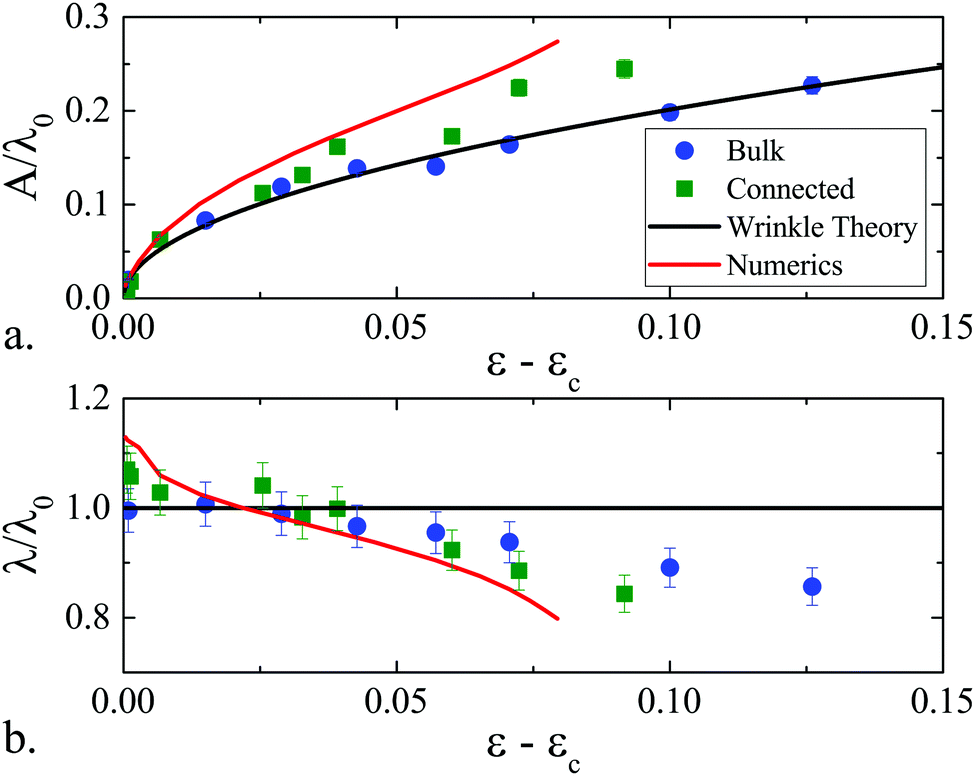
The success of the hypothesis that the localization occurring in a heterogeneous system has only to do with local strain and local boundaries justifies a more general analysis, ignoring the precise details of the boundaries. Numerical solutions can be generated with a generic set of boundary conditions (h(L/2) = h(−L/2) = 0, h(0) = h0, ḧ(L/2) = ḧ(−L/2) = 0 and ḣ(0) = 0) over a range of applied strains and the amplitude and wavelength as a function of applied strain can be examined, as in Fig. 12. We find that the numerical results closely follow the experimental data even without detailed boundary matching, justifying this approach. The curves show several important deviations from predictions made with commensurate plate sizes. First, the dominant wavelength calculated as λ0 = (B/K)1/4 is rarely realized in the small plate system. Our work indicates (for this choice of wavelength and plate size) that the pattern spacing is initially larger than λ0 then falls below λ0. We note that a similar trend can be seen in the experimental data (although the noise level is higher) where λ0 is directly measured in a bulk region on the same sample.
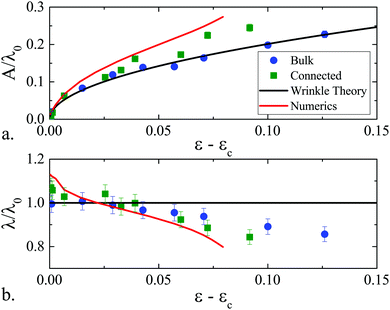 |
| | Fig. 12 (a) Amplitude scaled by the bulk, initial wavelength as a function of local strain above the critical strain for buckling. Solid lines represent conventional wrinkling theory (black, eqn (3)) and the numerical model (red). Solid circles show experimental data from a bulk region and solid squares show data from a ‘connected’ plate. (b) Wavelength scaled by the bulk, initial wavelength. Note that the incommensurate plate size causes the wavelength to initially stretch, and then falls below the ideal wavelength. | |
Secondly, we note no distinct deviation in the shape of the amplitude curve (numerically, or experimentally). Recent theory, for example, predicts an abrupt change in the slope at a critical strain for folding given by15
In the case of the data shown in
Fig. 12 the critical strain is a value of 0.064, where there is no apparent change in the slope of the amplitude data. This fact makes it difficult to directly verify the predicted second order nature of the transition. We can, however, examine the previously constructed state diagram (
Fig. 8) for consistency with
eqn (11) by overlaying the curve on the morphological data. Again, the general trend captures the essential features of the data quite well.
3.5 Advanced patterning
Over many years of study the wrinkling system has found several potential applications, for example, in the field of adhesion.43–45 In this case, the wrinkle pattern was found to enhance, or decrease the force required to break apart a wrinkled adhesive from another surface, depending on factors such as the wrinkle wavelength and amplitude. The effects of soft and hard regions patterned onto PDMS combined with the sensitivity to boundary conditions that we have outlined above lead to a unique and untapped route to controlling pattern formation in wrinkled systems used in adhesives or other applications.
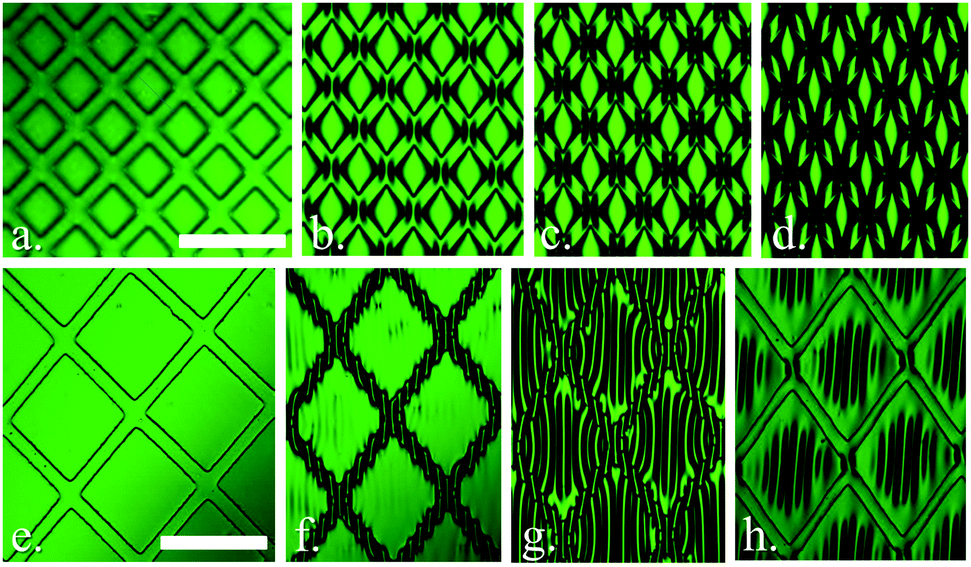
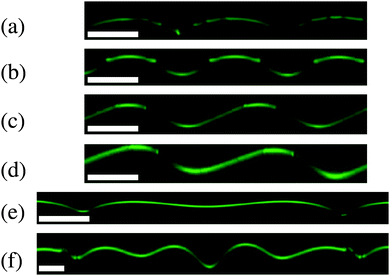
Fig. 13 shows a few potentially useful morphologies created only by adding a 45° rotation to the masks used. For simplicity, only two pitches are shown, one comparable to the wrinkle wavelength 64 μm (a–d) and one much larger than the dominant wavelength 254 μm (e–h). Fig. 13a–d show strain applied to the smaller pitch sample, and localization is found to occur in the interstitial spaces between two corners of the rigid plate-like regions. It is expected that much more strain is focused in a soft region between two long plates. Because of the wrinkle pitch, the corners between the plates develop sharper and sharper localized bending while the plates remain smoothly curved throughout. Each localization remains independent; there is no long wrinkle following the plate boundaries. Fig. 13e–g show the larger pitch pattern with a similar increase in strain. Remarkably, buckling occurs and is contained within the interstitial region while the stiffer plates remain undeformed. As the wrinkles are smaller relative to the gap, several occur and a ‘continuous’ wrinkle phase occurs in the interstitial space. As stress is increased, the plate finally buckles and begins to localize. Fig. 13h shows the opposite pattern from what is observed in Fig. 13f; the interstitial region was not exposed in this case, and so cannot buckle.
 |
| | Fig. 13 Several unique morphologies created through patterning a PDMS surface. (a) A sample annealed for 6 minutes with a mask on and 3 minutes with no mask (connected) at zero strain. The scale bar indicates 128 μm; (b) the same sample under 18% compressive strain, (c) 21%, and (d) 24%. (e) A larger pitch pattern treated identically to the sample shown in (a), at zero strain. The scale bar indicates 254 μm; (f) the same sample at 21% and (g) 32% compressive strain. (h) A sample exposed 9 minutes before the mask was removed (disconnected), and held at 33% compression. | |
4 Conclusions
In this paper, the mechanical response of an idealized heterogeneous elastic sheet with patterned regions of differing stiffnesses to applied compressive stress was studied. The idealized/patterned surface layers are created by selective ultraviolet/ozone (UV/O3) treatment of the top surface of polydimethylsiloxane (PDMS) using a TEM grid mask. By controlling the exposure time of the UVO, samples ranging from continuous thin films to sets of isolated small plates were created. Our main result is a physically grounded explanation of localization in a heterogeneous system. Localization emerges in the heterogeneous system because (1) strain is heterogeneously distributed and (2) boundaries are close, leading to finite sheet effects. We find that recent theory, adapted to the elastic foundation used in our experiments, is consistent with this view. In essence, our experiments are an important direct test of recent models of small plate buckling mechanics. Ultimately this work leads to a more complete understanding of the role of heterogeneity in buckling phenomena, and has many implications for biological systems which are always heterogeneous.
Acknowledgements
ABC gratefully acknowledges support from the AFOSR under the Young Investigator Program (FA9550-15-1-0168). B. G. thanks NSF EPSCOR for a doctoral dissertation assistantship.
References
- D. J. Lipomi, M. Vosgueritchian, B. C.-K. Tee, S. L. Hellstrom, J. A. Lee, C. H. Fox and Z. Bao, Nat. Nanotechnol., 2011, 6, 788–792 CrossRef CAS PubMed.
- D.-Y. Khang, H. Jiang, Y. Huang and J. A. Rogers, Science, 2006, 311, 208–212 CrossRef CAS PubMed.
- K. S. Kim, Y. Zhao, H. Jang, S. Y. Lee, J. M. Kim, K. S. Kim, J.-H. Ahn, P. Kim, J.-Y. Choi and B. H. Hong, Nature, 2009, 457, 706–710 CrossRef CAS PubMed.
- L. Mahadevan and S. Rica, Science, 2005, 307, 1740 CrossRef CAS PubMed.
- J. L. Silverberg, A. A. Evans, L. McLeod, R. C. Hayward, T. Hull, C. D. Santangelo and I. Cohen, Science, 2014, 345, 647–650 CrossRef CAS PubMed.
- Y. Zhang, Z. Yan, K. Nan, D. Xiao, Y. Liu, H. Luan, H. Fu, X. Wang, Q. Yang, J. Wang, W. Ren, H. Si, F. Liu, L. Yang, H. Li, J. Wang, X. Guo, H. Luo, L. Wang, Y. Huang and J. A. Rogers, Proc. Natl. Acad. Sci. U. S. A., 2015, 112, 11757–11764 CrossRef CAS PubMed.
- C. M. Stafford, C. Harrison, K. L. Beers, A. Karim, E. J. Amis, M. R. Vanlandingham, H.-C. Kim, W. Volksen, R. D. Miller and E. E. Simonyi, Nat. Mater, 2004, 3, 545–550 CrossRef CAS PubMed.
- J. Y. Chung, A. J. Nolte and C. M. Stafford, Adv. Mater., 2011, 23, 349–368 CrossRef CAS PubMed.
- E. Cerda and L. Mahadevan, Phys. Rev. Lett., 2003, 90, 074302 CrossRef CAS PubMed.
- J. Genzer and J. Greonewold, Soft Matter, 2006, 2, 310–323 RSC.
- E. Cerda, K. Ravi-Chandar and L. Mahadevan, Nature, 2002, 419, 579–580 CrossRef CAS PubMed.
- L. Pocivavsek, R. Dellsy, A. Kern, S. Johnson, B. Lin, K.-Y. C. Lee and E. Cerda, Science, 2008, 320, 912–916 CrossRef CAS PubMed.
- H. Diamant and T. A. Witten, Phys. Rev. Lett., 2011, 107, 164302 CrossRef PubMed.
- B. Audoly, Phys. Rev. E: Stat., Nonlinear, Soft Matter Phys., 2011, 84, 011605 CrossRef CAS PubMed.
- O. Oshri, F. Brau and H. Diamant, Phys. Rev. E: Stat., Nonlinear, Soft Matter Phys., 2015, 91, 052408 CrossRef PubMed.
- J. C. Amazigo, B. Budiansky and G. F. Carrier, Int. J. Solids Struct., 1970, 6, 1341–1356 CrossRef.
- E. K. Hobbie, D. O. Simien, J. A. Fagan, J. Y. Huh, J. Y. Chung, S. D. Hudson, J. Obrzut, J. F. Douglas and C. M. Stafford, Phys. Rev. Lett., 2010, 104, 125505 CrossRef CAS PubMed.
- A. B. Croll and A. J. Crosby, Macromolecules, 2012, 45, 4001–4006 CrossRef CAS.
- A. Tordesillas, D. Covey, A. B. Croll, J. Shi and B. Gurmessa, Granular Matter, 2014, 16, 249–258 CrossRef.
- E. A. Flores-Johnson, T. J. Rupert, K. J. Hemker, D. S. Gianola and Y. Gana, Extreme Mech. Lett., 2015, 4, 175–185 CrossRef.
- J.-W. Wang, B. Li, Y.-P. Cao and X.-Q. Feng, J. Appl. Mech., 2015, 82, 051009 CrossRef.
- M. R. Semler, J. M. Harris, A. B. Croll and E. K. Hobbie, Phys. Rev. E: Stat., Nonlinear, Soft Matter Phys, 2013, 88, 032409 CrossRef PubMed.
- Y. Ebata, A. B. Croll and A. J. Crosby, Soft Matter, 2012, 8, 9086–9091 RSC.
- K. Efimenko, M. Rackaitis, E. Manias, A. Vaziri, L. Mahadevan and J. Genzer, Nat. Mater., 2005, 4, 293–297 CrossRef CAS PubMed.
- D. Breid and A. J. Crosby, Soft Matter, 2009, 5, 425–431 RSC.
- X. Han, Y. Zhao, Y. Cao and C. Lu, Soft Matter, 2015, 11, 4444–4452 RSC.
- M. Ouyang, R. J. Muisener, A. Boulares and J. T. Koberstein, J. Membr. Sci., 2000, 177, 177–187 CrossRef CAS.
- Y. Berdichevsky, J. Khandurina, A. Guttman and Y.-H. Lo, Sens. Actuators, B, 2004, 97, 402–408 CrossRef CAS.
- F. Egitto, L. Matienzo, J. Spalik and S. Fuerniss, MRS Online Proc. Libr., 1995, p, 245 CrossRef.
- K. Efimenko, W. E. Wallace and J. Genzer, J. Colloid Interface Sci, 2002, 254, 306–315 CrossRef CAS PubMed.
- F. D. Egitto and L. J. Matienzo, J. Mater. Sci., 2006, 41, 6362–6373 CrossRef CAS.
- N. Bowden, S. Brittain, J. W. Evans, A. G. Hutchinson and G. M. Whitesides, Nature, 1998, 393, 146–149 CrossRef CAS.
- M. Nania, O. K. Matar and J. T. Cabral, Soft Matter, 2015, 11, 3067–3075 RSC.
- V. Trujillo, J. Kim and R. C. Hayward, Soft Matter, 2007, 4, 564–569 RSC.
- W. Hong, X. Zhao and Z. Suo, Appl. Phys. Lett., 2009, 95, 111901 CrossRef.
- Y. Cao and J. W. Hutchinson, Proc. R. Soc. A, 2012, 468, 94–115 CrossRef.
- M. Diab, T. Zhang, R. Zhao, H. Gao and K.-S. Kim, Proc. R. Soc. A, 2013, 469, 0735 CrossRef.
- M. Diab and K.-S. Kim, Proc. R. Soc. A, 2014, 470, 0218 CrossRef.
- Y. Zhao, X. Han, G. Li, C. Lu, Y. Cao, X.-Q. Feng and H. Gao, J. Mech. Phys. Solids, 2015, 83, 129–145 CrossRef CAS.
- E. P. Chan and A. J. Crosby, Adv. Mater., 2006, 18, 3238–3242 CrossRef CAS.
- J. Wang, B. Li, Y.-P. Cao, X.-Q. Feng and H. Gao, Appl. Phys. Lett., 2016, 108, 021903 CrossRef.
- F. Brau, P. Damman, H. Diamant and T. A. Witten, Soft Matter, 2013, 9, 8177–8186 RSC.
- E. P. Chan, E. J. Smith, R. C. Hayward and A. J. Crosby, Adv. Mater., 2008, 20, 711–716 CrossRef CAS.
- P.-C. Lin, S. Vajpayee, A. Jagota, C.-Y. Hui and S. Yang, Soft Matter, 2008, 4, 1830–1835 RSC.
- C. S. Davis and A. J. Crosby, Soft Matter, 2011, 7, 5373–5381 RSC.
Footnote |
| † Present address: Department of Physics and Biophysics, University of San Diego, San Diego, CA, USA. |
|
| This journal is © The Royal Society of Chemistry 2017 |
Click here to see how this site uses Cookies. View our privacy policy here. 
 Open Access Article
 This Open Access Article is licensed under a
  *
*


 , where B is the plates' bending modulus and K is the substrate stiffness.13–15 The force in each region of the pattern must balance, which allows us to equate the local strain to the local wavelength as ε1/ε2 = λ22/λ12 (as λ = (B/K)1/4 and the foundation stiffness is equal in all regions). This ultimately leads to the relationship between the local strain and the globally applied strain, as: