Hydrogen-enriched natural gas as a domestic fuel: an analysis based on flash-back and blow-off limits for domestic natural gas appliances within the UK
Daniel R.
Jones
 a,
Waheed A.
Al-Masry
b and
Charles W.
Dunnill
 *a
*a
aEnergy Safety Research Institute, Swansea University, Bay Campus, Swansea, SA1 8EN, UK. E-mail: c.dunnill@swansea.ac.uk
bDepartment of Chemical Engineering, King Saud University, Riyadh, Saudi Arabia
First published on 5th February 2018
Abstract
In the effort to reduce carbon emissions from an ever-increasing global population, it has become increasingly vital to monitor and counteract the environmental impact of our domestic energy usage given its contribution to overall carbon emissions. To this end, hydrogen has emerged as a foremost candidate to offset and eventually replace the use of traditional gaseous fossil fuels. Hydrogen as the universal energy carrier or vector is easily produced from all forms of renewable or recovered energy as a storable, transportable commodity that can be used on demand, thus decoupling the supply from demand that is often considered to be the down-side of intermittent renewable energy usage. European trials have already been conducted to investigate the practical implementation of hydrogen-enriched natural gas (HENG) within a mains gas supply. In this work, the limitations of such a strategy are evaluated based on a novel meta-analysis of experimental studies within the literature, with a focus on the constraints imposed by the phenomena of flash-back and blow-off. Through consideration of the Wobbe Index, we discuss the relationship between molar hydrogen percentage and annual carbon dioxide output, as well as the predicted effect of hydrogen-enrichment on fuel costs. It is further shown that in addition to suppressing both blow-off and yellow-tipping, hydrogen-enrichment of natural gas does not significantly increase the risk of flash-back on ignition for realistic burner setups, while flash-back at extinction is avoided for circular port diameters of less than 3.5 mm unless the proportion of hydrogen exceeds 34.7 mol%. It is thus proposed that up to 30 mol% of the natural gas supply may be replaced in the UK with guaranteed safety and reliability for the domestic end-user, without any modification of the appliance infrastructure.
1. Introduction
Since the internationally-implemented changeover from coal gas (sometimes referred to as “Town gas”) to natural gas from the late 1950s onwards,1 natural gas has endured as the domestic fuel of choice for the majority of developed nations across the globe. Domestic gas appliances, however, currently account for a sizeable proportion of the total greenhouse gas emissions worldwide; in the UK, for instance, domestic gas usage contributes approximately 9% of nationwide carbon dioxide emissions.2 Additionally, in the USA alone, an estimated four billion cubic metres of natural gas were released into the atmosphere in 2015 due to leakage during transit and storage.3 As a carbon-free fuel, hydrogen could conceivably provide the solution to fully mitigate these issues, and there is presently a concerted international drive towards the adoption of hydrogen in place of traditional fossil fuels, with particular emphasis on hydrogen-fuelled automotive transport.4–8 To achieve more widespread incorporation of hydrogen into daily life, however, it is necessary to overcome the pervasive negative public perception regarding the dangers of the gas.9 Yet the need to substitute conventional fossil fuels is proving ever-more pressing; indeed, if the global average temperature is to increase by no more than 1.5 °C above pre-industrial levels, a key commitment of the Paris Agreement in 2015,10 the introduction of hydrogen as a domestic fuel may prove essential.Despite the positive environment impact of a changeover from natural gas to hydrogen, the physical properties of hydrogen make it impossible to simply interchange the two gases without a major overhaul of the existing energy network. Such wholesale changes are not without precedent, although the associated economic implications are considerable: during the UK changeover from coal gas to natural gas between 1968 and 1976, for example, the cost of adapting the mains network and modifying approximately 40 million domestic gas appliances1 totalled an estimated £600 million,11 equivalent to roughly £2.6 billion in 2017. It is for this reason that while changes to the supply network might be unavoidable for fuels containing high proportions of hydrogen,12 as far as possible it is prudent to propose modifications to the gas supply which may be employed within the existing infrastructure, especially with regards to the gas appliances inside the homes and businesses of the end-users. The changes should also be practically implementable on a short time-scale, thereby minimising disruption to the energy network. A modern MDPE gas network is capable of supporting low to medium pressure (<10 bar) hydrogen safely and securely, and is installed across most of the modern world where metal pipework has been removed. The issue, however, is the sheer number of gas appliances that would need to be exchanged or altered as they would be incompatible with burning 100% hydrogen as a fuel.
As a “stepping stone” towards a future 100% hydrogen gas network, hydrogen-enriched natural gas, or HENG, has received significant attention in recent years. Of particular note is the NaturalHy project, a collaborative five-year study that began in 2004 and involved 39 European partners, which investigated the logistical transport, storage and end-usage of HENG;13 within this project, trials in the Netherlands concluded that compositions of up to 20 mol% hydrogen were compatible with modern domestic natural gas appliances.14 In order to guarantee the reliable and safe operation of all gas burners, however, it is essential to ensure that neither flash-back nor blow-out could occur during a changeover from natural gas to HENG, even in the case of outdated or poorly-maintained appliances. This prerequisite imposes a number of conditions on the implementation of changeover policy: one cannot, for instance, assume that all domestic appliances have been calibrated for optimal natural gas performance, and one must also account for the wide variation in burner architecture.
While the empirical results from the NaturalHy project are a useful contribution to the overall discussion on HENG adoption, experimentation on a limited number of well-calibrated contemporary appliances cannot be viewed as representative of all present-day domestic and commercial burners, and is therefore of limited scope and validity. In conjunction with a review of the relevant combustion theory, the present report delivers a meta-analysis of existing models from the literature to develop a more holistic understanding of the potential challenges of a hypothetical changeover to HENG. Moreover, the study culminates in the estimation of a more realistic limit for the concentration of hydrogen in HENG, imposing the condition that all existing operational appliances continue to function safely and reliably when the proposed quantity of hydrogen is admitted to the fuel mixture. In addition to investigating flame stability for domestic burners over a range of realistic port dimensions, emphasis is placed on the avoidance of instability during extinction of a flame, as well as following ignition. It should be recognised that the analysis focusses solely on the end-use of HENG as a fuel; considerations such as the effect of hydrogen-enrichment on distribution networks are worthy of additional discussion, but are beyond the scope of this study.
2. Implications of fuel density and energy content
If a gas appliance is to remain usable following the introduction of a new fuel supply, it is imperative that the replacement gas is able to deliver energy at a sufficiently high rate. To this end, one of the most obvious considerations is the calorific content of the gas; a common measurement of this property is the “higher heating value”, HHV, defined as the energy released per unit mass when all combustion products are returned to the pre-combustion temperature, typically defined as 25 °C, in contrast to the “lower heating value”, LHV, which assumes that all combustion products remain as a vapour at a temperature of 150 °C.15 Somewhat confusingly, HHV and LHV values are usually quoted in units of energy per “normal cubic metre” (denoted Nm3), which corresponds to a cubic metre of gas at a temperature of 0 °C and a pressure of one atmosphere. Typical values of HHV and LHV for natural gas are 43.5 MJ Nm−3 and 39.3 MJ Nm−3, respectively, which are almost four times the corresponding hydrogen HHV and LHV values of, respectively, 12.8 MJ Nm−3 and 10.8 MJ Nm−3.15–18 It is worth noting that the calorific content of natural gas is dependent on its precise composition, which varies according to factors including location and the time of year.19In addition to the calorific content of a fuel gas, one must also address the rate of fuel delivery in order to analyse the overall energy output per unit time. According to Bernoulli's principle, the velocity of gas flow along a pressure gradient is inversely proportional to the square root of the gas density; the overall rate of energy output therefore scales in direct proportion to the “Wobbe Index”, WI, often defined as12
 | (1) |
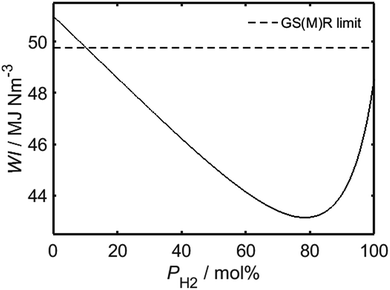
Having identified the WI values of the individual constituent gases, it is possible to evaluate WI for HENG of varying molar hydrogen percentage, PH2, as depicted in Fig. 1. In order to determine a maximum practicable hydrogen percentage, a value of 51 MJ Nm−3 has been assumed for the WI of unblended natural gas, which has been recently identified as a characteristic lower bound for natural gas supplied within several European countries, including the UK.22 Due to the square root dependence between WI and SG, the form of the relationship between WI and PH2 is only weakly affected by variations in SG resulting from differences in natural gas composition; it is therefore sufficient to assume an appropriate typical value of SG from the literature.16 According to the legal threshold imposed by Gas Safety (Management) Regulations (abbreviated to GS(M)R) laid out in 1996, modern H-band appliances in the UK must be supplied with fuel of WI value no lower than 49.75 MJ Nm−3;22 this limit has been plotted as a dashed line on the plot, and indicates that PH2 values of less than approximately 10% are required to satisfy the specification.
Despite the restriction on PH2 imposed by present UK legislation, it will later be shown that while the mandated threshold of WI is necessary for unblended natural gas to prevent flame lifting,23,24 hydrogen-enrichment actually serves to suppress this phenomenon; it is likely, therefore, that present-day appliances would be compatible with HENG fuels exhibiting much lower WI values than the limit set by current regulations. One must note, however, that since a decreased value of WI corresponds to a lower energy output per unit time, there must still exist a value of PH2 above which an appliance will cease to function satisfactorily. It has been argued elsewhere that the WI value of a HENG supply should be no lower than the minimum value of the European H-band distribution, equal to 48.17 MJ Nm−3, else end-users would not receive the minimum energy output promised by their energy supplier.25 Adopting this requirement, and assuming a minimum WI value of 51 MJ Nm−3 for unblended natural gas, as before, Fig. 1 predicts that PH2 should be no greater than 23.4 mol%; this limit should be treated with caution, however, due to the arbitrary nature of the selected WI limit when applied to fuels other than unblended natural gas.
The low density and calorific content of hydrogen, relative to natural gas, has further consequences on the practicability of HENG. As the primary motivation behind the proposed adoption of HENG, the reduction in carbon dioxide output is clearly worthy of investigation. It is important to recognise that whilst there is a linear decrease in the volume of generated carbon dioxide per mole of fuel as a function of PH2, this is not an adequate measure of carbon dioxide emission based on daily fuel usage; instead, it is more appropriate to consider the volume of carbon dioxide produced per unit of energy used, as a fuel of low calorific value must be combusted in higher volumetric quantities than a more energy-rich fuel to complete a given task. Alternatively, in some applications it may be suitable to assess energy usage based on the allocated time for a particular process: a consumer might, for example, elect to heat a frying pan for the same duration regardless of the fuel supplied to their gas stove, despite the disparity in the total energy supplied by two dissimilar fuels over that time period. The differences between these two measures are of real-world importance, especially given the wide variation in domestic cooking practices,26 so it is instructive to explore the carbon dioxide savings for both possibilities.
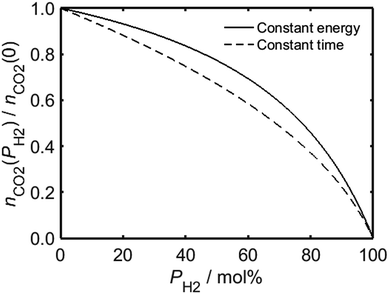
In the case of a process for which there is a requisite amount of energy, the relationship between PH2 and the total moles of carbon dioxide emitted by combusted HENG, nCO2, is governed by the heating value of the gas mixture; Fig. 2 shows that although the value of nCO2 (which has been normalised with respect to nCO2(0), the moles of carbon dioxide emitted in the case of unblended natural gas) decreases as a function of PH2, the rate of decrease is suppressed by the higher quantity of fuel needed to achieve the same energy output as a given volume of natural gas. By contrast, if one were to carry out a heating application for a fixed amount of time, while ignoring the overall energy usage, the carbon dioxide emission is instead dependent on the rate of fuel injection into the appliance.
Employing Bernoulli's principle as before, a higher volume of HENG is admitted than natural gas during a given time period due to its lower density, which serves to counteract the reduction in carbon dioxide production during a “constant time” procedure; it is evident from Fig. 2, however, that increasing PH2 for such a process still yields a greater decrease in nCO2 than in the case of a “constant energy” procedure using the same fuel. The two curves in Fig. 2 are useful in that they represent the two extremes of domestic energy usage: in reality, the enrichment of natural gas by hydrogen might warrant an increase in the duration of a heating process, but not insofar as the total energy required remains unchanged. In other words, the two curves in Fig. 2 impose upper and lower limits on the achievable reduction in carbon dioxide emission for each composition of HENG.
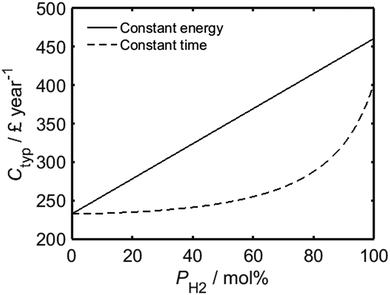
Another important property of a domestic fuel is its cost. Presently, much of the hydrogen produced worldwide is generated through steam reforming of low-molecular weight hydrocarbons present in natural gas, a process which almost unavoidably increases the unit price of hydrogen relative to the natural gas from which it is synthesised. Based on the current cost of hydrogen manufactured through steam reforming27 and the mean wholesale natural gas price in the UK during the first quarter of 2017, a switchover from natural gas to pure hydrogen would be expected to approximately double the price of fuel per unit energy, increasing from 1.63 p (kW h)−1 for natural gas to 3.23 p (kW h)−1 for hydrogen; these values are consistent with the typical price relationship between natural gas and hydrogen, with the latter historically produced through steam reforming at approximately 2.2 times the cost of natural gas.28 It is essential to recognise, however, that while the cost of HENG scales as a linear function of PH2 in the case of “constant energy” processes, if one assumes a fixed time for a given task then the relationship is more complicated: in this case, the total amount of energy used per unit time depends on both the density of the fuel gas and its calorific content, and the cost of operating an appliance for a given duration therefore also depends on these two properties.
As shown by Fig. 3, while the assumption of constant energy usage yields a linear relationship between PH2 and the average annual wholesale fuel cost per household in the UK, Ctyp, a much lower rate of increase is predicted for processes which are carried out for a fixed period of time. The present-day average annual wholesale cost of natural gas per UK household has been estimated based on a typical gas consumption of 14![[thin space (1/6-em)]](https://www.rsc.org/images/entities/char_2009.gif) 263 kW h per annum,29 in conjunction with the mean wholesale price of natural gas from the first quarter of 2017, as quoted previously. In an analogous manner to Fig. 2, the total expenditure for a real-world household would likely have a value somewhere between the limits imposed by the two regimes represented in the plot. It is important to recognise that the trends in Fig. 3 do not account for the future trend of energy prices; it is probable that as the use of hydrogen becomes more mainstream, driving increased investment into the development of more sustainable hydrogen sources such as renewably-powered electrolysis30–32 or solar harvesting,33–38 its unit cost will decrease.39
263 kW h per annum,29 in conjunction with the mean wholesale price of natural gas from the first quarter of 2017, as quoted previously. In an analogous manner to Fig. 2, the total expenditure for a real-world household would likely have a value somewhere between the limits imposed by the two regimes represented in the plot. It is important to recognise that the trends in Fig. 3 do not account for the future trend of energy prices; it is probable that as the use of hydrogen becomes more mainstream, driving increased investment into the development of more sustainable hydrogen sources such as renewably-powered electrolysis30–32 or solar harvesting,33–38 its unit cost will decrease.39
Conversely, the unit price of natural gas will foreseeably increase in coming years as it becomes more difficult and less economically-viable to locate and extract.
3. Influence of hydrogen-enrichment on flame speed and equivalence ratio
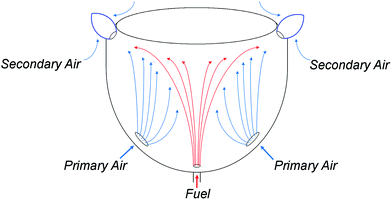
In order to operate reliably following a switchover of the network gas supply, an appliance which has been calibrated for unblended natural gas must continue to operate safely and reliably despite the disparate properties of the newly-adopted fuel. In the case of HENG, the presence of hydrogen has a profound effect on the dynamics of appliance operation both at the point of injection and within the flame. To fully understand the consequences of hydrogen-enrichment, it is therefore essential to develop a detailed understanding of the physics throughout an archetypal burner system. The burners to be treated in the upcoming analysis are of the atmospheric, or “natural-draught”, type, wherein air is entrained into the system by the flow of injected fuel, ignoring “forced-draught” or “induced-draught” appliances which utilise fan-assistance to moderate the flow of air into the system.40–42 However, it is to be reasoned later that the rate of air intake is approximately independent of fuel composition in natural-draught burners, so the results of the analysis are also applicable to fan-assisted appliances, which also maintain a constant flow of air regardless of the nature of the fuel.25As a simple example of domestic burner architecture, a representative atmospheric, self-aspirating gas stove is illustrated schematically in Fig. 4. After the fuel is admitted through a narrow injector nozzle, it spreads upwards towards the top burner plate. As it does so, air from outside the burner housing is entrained by the fuel through the air intake ports, and subsequently mixes with the fuel; this air is referred to as the “primary air”, in contrast to the “secondary air” which enters the mixture at the flame front.43,44
The rate of primary aeration is dependent on a plethora of factors, including the diameter of the intake ports, fuel injector size, and the precise shape of the burner housing, but these parameters may be neglected if one assumes that the setup remains unchanged as the fuel composition is altered. It may be shown that for sufficiently high rates of fuel injection, the flow rate of entrained air varies in direct proportion to both the fuel injection velocity44 and the square root of fuel density.44–46 These contributions to the rate of air entrainment cancel each other out, however, since, in accordance with Bernoulli's principle, the rate of fuel injection is inversely proportional to the square root of fuel density. If all other factors are held constant, the rate of primary air flow therefore remains unchanged as the value of PH2 is increased; this constant flow rate of primary air shall henceforth be referred to as ra.
Although the rate of air entrained by the injected fuel is independent of the fuel composition, the amount of oxygen required for complete combustion of the fuel varies as a function of PH2; more specifically, stoichiometric combustion of hydrogen requires approximately twenty times less oxygen than the same volume of natural gas, resulting in an enhanced surplus of air as PH2 is increased. The simultaneous change in the rate of fuel injection acts to oppose this effect, however: due to the low density of hydrogen relative to natural gas, increased hydrogen-enrichment leads to a higher rate of fuel flow into the system as a consequence of Bernoulli's principle.
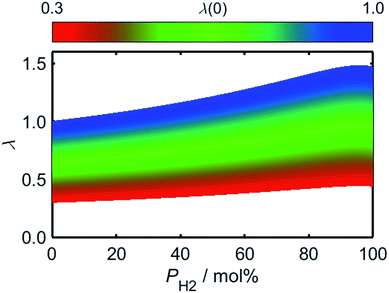
To evaluate the rate of air flow in relation to the oxygen-requirements of the fuel, it is useful to employ the “primary air fraction”, λ(PH2), defined as the ratio of ra to the total air flow required for complete combustion of the HENG fuel, ra,stoich(PH2). Combining the considerations above, one may express λ(PH2) as
 | (2) |
Having approximated the relationship between λ and PH2, it is now possible to explore the effects of hydrogen-enrichment on the combustion dynamics of the air/fuel mixture. In order to determine the theoretical stability of the HENG flame, it is first necessary to predict the variation of burning velocity as a function of both PH2 and λ. Within the literature there are many models for the dependence of flame velocity on these two quantities, but the complexity of the system is such that the resulting formulae are often empirical in nature.47–54 It is also important to note that such models are usually applicable only to laminar flames resulting from Poiseuille flow, as opposed to turbulent flames which form when the Reynold's number exceeds a value of approximately 2000;55 this assumption is appropriate, however, as domestic burners generally operate within the laminar regime.
For the present treatment, equations based on the formulation by Dong et al.47 are to be employed: through analysis of their own research alongside existing work, the authors showed that the laminar burning velocities of unblended natural gas and hydrogen, denoted SL(0) and SL(100), respectively, are well-approximated by the equations
 | (3) |
| SL(100) = (−AH2 + BH2ϕ − CH2ϕ2 + DH2ϕ3) m s−1 | (4) |
 | (5) |
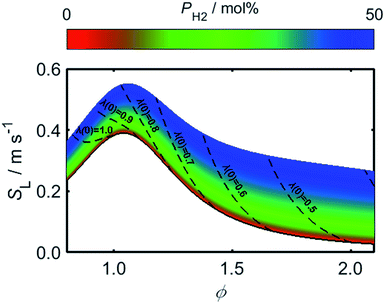
Using (3)–(5) in conjunction with the relationship between λ and PH2 given by (2), it is possible to determine how the flame speed varies as a function of PH2 for any starting ϕ value in the range for which (3)–(5) are valid. As a result of the relatively high burning velocity of hydrogen gas, the magnitude of SL at a given starting value of ϕ increases rapidly as a function of PH2; one should recall, however, that the low oxygen-requirement of hydrogen combustion acts to simultaneously decrease ϕ, as indicated by the dashed lines in Fig. 6.
4. Measures of flame stability
Using the empirical relationships between SL, PH2 and ϕ, the stability of a HENG flame may be characterised by considering the processes of flash-back and blow-off. It is qualitatively instructive to regard these two phenomena as opposite extremes of burner operation: air/fuel mixture entering the burner port at too high a velocity may cause the flame to extinguish as it is lifted, or “blown-off”, from the port, while if the velocity is too low the flame may “flash-back” into the unburned air/fuel mixture, potentially leading to an explosion. Due to the physical complexity of these processes, researchers often model such behaviour using empirical formulations; one notable example from the early-1950s are the Weaver Indices, a set of experimentally-justified variables which define the flash-back and blow-off propensities of different air/fuel mixtures.56 As research into combustion dynamics has progressed, however, it has become necessary to investigate the onset of instability in a less empirical manner, accounting for factors such as the composition of the fuel in question.As a starting point for modern physical treatments of flash-back and blow-off, it is common for researchers to evaluate the susceptibility of an air/fuel mixture to these phenomena by comparing the characteristic flow time of the system, τaf, to the characteristic time of reaction, τr; the ratio of these quantities is known as the “Damköhler Index”, DI.57–59 It may be shown that for a mixture of mean flow speed vaf, thermal diffusivity αaf, and laminar burning velocity SL, the characteristic flow and reaction times for a port of diameter dport are given by
 | (6) |
 | (7) |
 | (8) |
It is also helpful to note that αaf is related to the mixture's specific heat capacity, Cp,af, density, ρaf, and thermal conductivity, kaf, via the equation62
 | (9) |
For the purposes of the present analysis, the specific heat capacity, density and thermal conductivity of the fuel are to be estimated from the compositionally-weighted average of each quantity. An air/fuel mixture with a critically low DI value is liable to flash-back due to the high rate of reaction relative to the flow rate of fuel and air into the burner port, while a critically high DI value signifies a mixture which may blow-off as a result of fuel entering the port more rapidly than it can be combusted.
Another important quantity in the discussion of flame stability is the “Lewis Number”, Le, defined as the ratio of the thermal diffusivity to the mass diffusivity of the air/fuel mixture; this variable may therefore be expressed as63
 | (10) |
In the case of HENG, it has been shown that while increased hydrogen-enrichment leads to a decrease in Le for fuel-lean flames (a ϕ value less than one), the reverse is true in the fuel-rich regime,64 resulting in decreased susceptibility of the flame to cellularity; since typical domestic burners operate at ϕ values greater than one, the phenomenon of cellular instability is likely to be suppressed by hydrogen-enrichment of domestic natural gas. For the purposes of assessing the limitations of hydrogen-enrichment, it is therefore not necessary to address the onset of cellularity any further.
Returning to the concept of flash-back, it is instructive to consider a formulation introduced by Putnam and Jensen,62 who proposed that the onset of flash-back may be defined by the “Peclet Numbers”, Per and Peaf, given by the equations
 | (11) |
 | (12) |
 | (13) |
 | (14) |
As detailed in the publication by Putnam and Jensen, the derivation of (13) is underpinned by the use of the “boundary velocity gradient”, g, to define the critical points of flash-back or blow-off, which may be estimated from measurements of the observed angle between the flame front and the axis of the burner port;67 the critical value of g at which flash-back occurs is typically denoted gF, while gB represents the corresponding value for blow-off. By adopting a similar approach, a later study by Reed68 showed that provided the air/fuel mixture is not too fuel-rich, gB may be approximated as
 | (15) |
 | (16) |
 | (17) |
From (15), (17) allows the value of vaf at the onset of blow-off, vaf,B, to be written as
 | (18) |
To overcome the limitations of Reed's model, it is helpful to consult an empirical methodology developed by van Krevelen and Chermin.69 Within this scheme, the Z-dependence of gF is characterised for different mixed fuels by just a few defining parameters of the flash-back measurements, namely the maximum gF value, gF,max, the Z value at the gF peak, Zmax, and the width of the gF(Z) curve, σ, which the authors normalise with respect to the width of the gF(Z) curve of methane. The form of the gB(Z) curve is in turn characterised by the Z value at which gB equals gF,max, and the value of gB when Z equals Zmax. For ease of comparison between different fuel mixtures, g and Z are subsequently rescaled to the unitless “reduced” variables gR and ZR, respectively, using the equations
 | (19) |
| ZR = 1 + σ(Z − Zmax). | (20) |
By rescaling in this way, the flash-back curves of different fuel-mixtures are set equal, allowing facile comparison of the blow-off behaviour. As an example of their technique, the authors plot the gR(ZR) relationships of different mixtures of methane and hydrogen, and show the rapid increase in the value of gB as the proportion of hydrogen within the mixture is elevated.
Despite the apparent usefulness of their rescaling method, van Krevelen and Chermin do not employ analytic functions of gB(Z) and gF(Z) within their study; instead, they simply plot empirical fitting curves through compiled measurements of these two quantities. For the purposes of the present analysis, however, it is necessary to obtain such analytic relationships so that the effects of hydrogen-enrichment on both flash-back and blow-off may be properly explored. To this end, (19) and (20) may be used to plot the rescaled form of gF(Z) for different PH2 values based on the equation70
 | (21) |
To develop an equation for gB(Z), the form of (15) is considered further. Although, as discussed, this expression is not suitable for the present purpose, it is likely that a more appropriate formula must still exhibit some dependence on the variables included in (15), namely SL and αaf. Assuming that gB retains a power-dependence on these quantities, and further recognising that the dimensional requirements of the fitting equation remain the same as in (15), one may write
 | (22) |
By combining the considerations discussed, approximate relationships between gF and Z have been calculated and plotted in Fig. 7b, following the rescaling of g and Z to their reduced counterparts in Fig. 7a. In the case of flash-back, the constant K in (21) has been assigned a value such that gF,max becomes approximately 400 s−1 for unblended natural gas,69 and it has been assumed that this value remains valid over the PH2 range considered. For the onset of blow-off, the rescaled gB(Z) curve of pure methane from Fig. 3 of the study by van Krevelen and Chermin has been plotted directly, while curves corresponding to non-zero values of PH2 have been constructed by adjusting the gB(Z) curve of methane according to (22), using an n value of 0.25; although there was little physical justification for this fitting equation, over a PH2 range of 0–50 mol% the rescaled gB(Z) relationships plotted in Fig. 7 are closely consistent with the corresponding curves in Fig. 3 of the work by van Krevelen and Chermin.
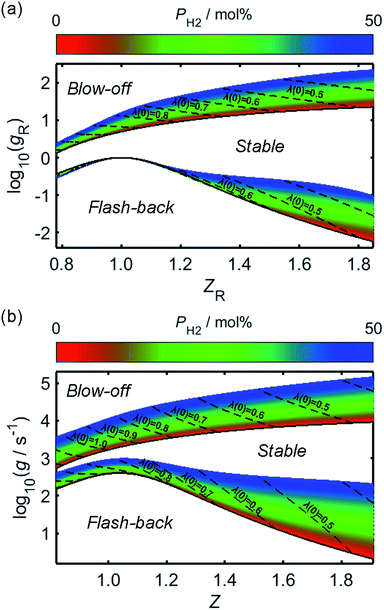 | ||
| Fig. 7 The fuel concentration-dependence of the logarithmic critical boundary velocity gradients of blow-off and flash-back, over a range of PH2 values; in (a), the ratio of fuel concentration to the stoichiometric fuel concentration, Z, has been “reduced” to a new variable, ZR, using (19), while the boundary velocity gradient, g, has been similarly rescaled to a unitless quantity, gR, through use of (18). The corresponding logarithmic plot of g as a function of Z is shown in (b). In each of the plots, the regions of blow-off and flash-back, which are located above the gB(Z) or gB,R(Z) curve and below the gF(Z) or gF,R(Z) curve, respectively, have been labelled accordingly, in addition to the region corresponding to a stable flame. The variations of Z and ZR with changing PH2 are indicated by dashed lines for different values of λ(0), while the flash-back and blow-off onset curves for normal appliance operation, wherein unblended natural gas is injected as the fuel, are each plotted as a solid black line. | ||
It is clear from Fig. 7 that while hydrogen-enrichment diminishes the propensity of blow-off, the region of parameter-space over which flash-back may occur is simultaneously enlarged. Further lifting and flash-back stability may be afforded through the use of flame swirl, as employed in so-called “swirl burners”; within these appliances, a tangential velocity component is imparted to the flame through adjustment of the shape and angle of the burner ports, thereby forming a vortex which acts to enhance flame stability by recirculating unreacted species and increasing their residence time within the flame.71–75 However, while these burner architectures are mentioned for the purpose of completeness, the present analysis focusses on the zero-swirl scenario as this represents the “worst-case” situation for flame stability.
5. Effect of hydrogen-enrichment on the onsets of flash-back and blow-off
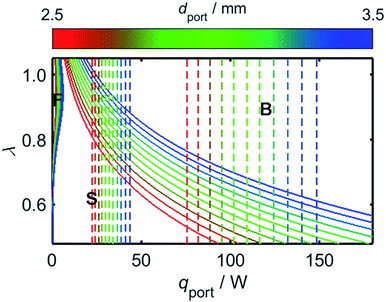
The results of Fig. 7 provide the information necessary to predict the onsets of flash-back and blow-off as a function of λ and the rate of energy flow through the burner port, qport; knowledge of these relationships is imperative for reliable and safe appliance operation. Before addressing the effects of hydrogen-enrichment, however, it is prudent to first evaluate the regimes of flame stability in the case of unblended natural gas, and to explore the effects of changing the port diameter, dport.Although the calibrated value of both λ and qport may vary between appliances, the ports of a residential cooktop burner are typically designed so that an energy flow of at least 10 kBtu h−1 in−2 passes through each of them,76 while the maximum flow rate is typically up to 3.4 times this value.77Fig. 8 depicts the onsets of flash-back and blow-off as a function of λ, qport, and dport; the range of dport values selected for this plot is representative of typical domestic cooktop burners with circular ports, which commonly possess ports approximately 2.5–3.5 mm in diameter.76–78 To illustrate the conditions expected during normal operation, the coloured dashed lines in Fig. 8 mark the boundaries of the range of qport values identified for typical domestic burners.
While the avoidance of flash-back remains the most important safety consideration during burner design, it is clear from Fig. 8 that there is little risk of this phenomenon occurring in the case of a typical domestic burner fuelled with unblended natural gas: the conditions required for flash-back are situated within a small region labelled “F” in the upper-left of the plot, far from the normal operating parameters of a characteristic appliance. By contrast, poor management of the air-intake may realistically result in blow-off, with λ values significantly greater than around 0.6 resulting in this form of flame instability. As mentioned previously, this propensity for blow-off is the primary motivation for current legislation which imposes a lower threshold on the value of WI: natural gas with a low WI value, such as so-called Groningen gas, or “G-gas”,23,48 commonly contains a high proportion of nitrogen, which lowers the oxygen-requirement of the fuel and thereby increases the value of λ, in turn enhancing the risk of blow-off. A third phenomenon known as “yellow-tipping” may also occur at very low values of λ due to the scarcity of oxygen for combustion;79,80 this effect, however, typically occurs well below the range of λ values depicted in Fig. 8.
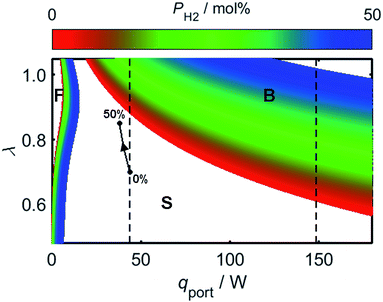
As a consequence of the high laminar burning velocity of hydrogen, it is tempting to assume that the squared dependence of gF on SL in (21) might elevate the risk of flash-back as PH2 is increased; it is shown by Fig. 6, however, that SL changes only modestly for PH2 values in the range 0–50 mol%, the peak value of SL increasing by just 41% as PH2 is raised from zero to 50 mol%. As shown by Fig. 9, which plots the calculated onsets of flash-back and blow-off as a function of λ, qport, and PH2, but a constant dport value of 3.5 mm, this small variation in SL indeed translates to an almost insignificant shift in the onset of flash-back over the PH2 range considered, suggesting that up to half of the natural gas may be substituted for hydrogen without any appreciable detriment to the safety of appliance operation. Moreover, as acknowledged previously, the presence of hydrogen in the fuel serves to shift the onset of blow-off to higher values of λ, potentially facilitating the use of natural gas of lower Wobbe Index.
Whilst hydrogen addition acts to both increase λ and decrease qport, these changes only result in a small deviation of the burner operating conditions towards the flash-back region of Fig. 9; as an illustration of this point, the effect of changing PH2 has been plotted for a natural gas appliance calibrated to a λ value of 0.7 and an energy flow rate through the port of 10 kBtu h−1 in−2, which represent extreme limits of burner operation. It should be noted that while the viscosity variation resulting from hydrogen-enrichment ought to be addressed when calculating the changing value of qport as a function of PH2, it has been shown experimentally that the viscosity remains approximately constant for PH2 values below 50 mol%.81 Besides blow-off and flash-back considerations, the increase in λ resulting from hydrogen-enrichment also acts to suppress yellow-tipping.
6. Behaviour of the HENG flame at extinction
In the previous section, the reliability of burner operation was discussed in relation to the stability of the HENG flame, and it was shown that while flash-back would become a more significant consideration following hydrogen-enrichment, it would nonetheless remain an unrealistic concern for typical domestic appliances. To ensure complete safety of the burner, however, it is necessary to evaluate the stability of the flame not only following ignition, but also during flame extinction, when the flow of fuel gas is terminated. More specifically, it is vital that the sudden decrease in the value of qport during shut-off does not instigate flash-back into the body of the burner;82,83 rather, the flame should be “quenched” at the burner head as a result of efficient heat transfer to the walls of the port.As in the discussion regarding flame stability at ignition, the properties of a flame at extinction may be modelled with regards to the physical properties of the burned and unburned air/fuel mixture.84 Such models typically follow the work of Friedman,85 who posited that for a circular port, the maximum port diameter at which a flame may be successfully quenched, otherwise known as the “quenching distance”, dquench, is related to the physical characteristics of the mixture according to the equation
 | (23) |
If one assumes that Tig scales in direct proportion to Tad and Tad is much larger than Taf, it is possible to employ the approximation84
| Pequench ≈ constant. | (24) |
This simplification of (23) has been derived in alternative ways by authors such as Ballal and Lefebvre,86 who showed that the approximation is valid when vaf is much less than SL, a regime entered by the system as the flow of fuel is decreased to zero.
One should acknowledge that while (24) is a useful approximation for qualitative discussion, the conditions required for its implementation are often not realised in practice; it has been demonstrated, for example, that an increase in the temperature of the burner wall may lead to a significant decrease in the value of dquench.87 Despite this limitation, it has been shown within the literature that provided the flame stretch rate is sufficiently low, the flame temperature does not vary significantly during hydrogen-enrichment of natural gas,58,88 allowing one to assume a similar burner temperature for different HENG compositions. It follows that while the precise value of dquench for a given composition is subject to error due to the effect of burner temperature, the trend in dquench as a function of PH2 may be quantitatively assessed. In the case of circular ports, Putnam and Jensen experimentally estimated the value of Pequench as 46 from various mixtures of hydrocarbons and air,62 while a later study by Jarosiński yielded a corresponding estimate of 39 from methane/air mixtures;89 these values are characteristic of estimates elsewhere in the literature, with Pequench typically assigned values of between 30 and 50.84
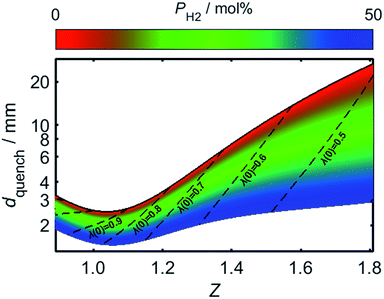
By using (24) to estimate the variation in Pequench as a function of PH2 and Z, the effect of hydrogen-enrichment on dquench may be determined. For the present analysis, a value of 46 was selected for Pequench, in accordance with the estimate from Putnam and Jensen. Fig. 10 plots the value of dquench as Z is varied, with the trend plotted over a range of PH2 values; the upper limit of dport is shown to increase rapidly as the air/fuel mixture becomes more fuel-rich, which may be attributed to the corresponding increase in the burning velocity, SL. For a given value of dport, therefore, a lower bound is placed on the usable Z range: mixtures with a Z value less than this threshold may produce a stable flame upon ignition, but the flame is liable to flash-back during its extinction.
As the proportion of hydrogen present in the HENG fuel is increased, the resulting decrease in dquench may result in dport becoming too large for the burner to successfully quench the flame during shut-off; this problem is exacerbated by the decrease in Z following hydrogen-enrichment, as indicated by the dashed lines in the plot. It should be recognised that while the minimum of the curve for unblended natural gas (plotted as a solid black line) is lower than the value of 3.5 mm reported elsewhere in the literature,55,82 this value is subject to variability due to the real-world variance of natural gas composition, as well as the aforementioned effect of burner temperature.
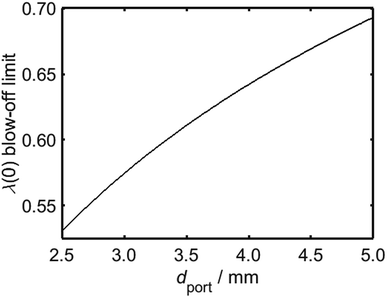
It is clear from Fig. 10 that in addition to the diameter of the burner port, the maximum viable hydrogen concentration is also dependent on the quantity of air in the system. In turn, there is a practical upper limit to the rate of primary air entrainment into a given burner, as excessive primary air may instigate blow-off upon ignition. It is therefore instructive to characterise the maximum value of λ as a function of dport, using Fig. 8 as a reference; it is to be assumed during this analysis that the burner is calibrated for unblended natural gas and operates at energy flow rates in the range 10–34 kBtu h−1 in−2, as defined previously. It is to be further assumed that a satisfactorily-operating burner must avoid blow-off throughout this range. From Fig. 11, which depicts the maximum value of λ as a function of dport for diameters in the range 2.5–5.0 mm, an appliance with ports below 3.5 mm in diameter remains stable provided that λ is calibrated to a value less than approximately 0.6.
Having estimated a realistic upper-bound for λ(0) as a function of dport, one may subsequently evaluate the maximum achievable value of PH2 based on the relationships between dquench and Z depicted in Fig. 10: as mentioned previously, dquench must remain greater than dport if flash-back upon extinction is to be reliably avoided. In Fig. 12, this flash-back imposed limit on PH2, denoted PH2,max, has been plotted as a function of dport for a λ(0) range between 0.5 and 0.7; displayed also, as a dashed line, is the constraint on λ(0) estimated from Fig. 11, required to ensure that blow-off does not occur during burner operation. Assuming once more that appliances adopt dport values in the range 2.5–3.5 mm, Fig. 12 indicates that up to 34.7 mol% of domestic natural gas may be feasibly substituted for hydrogen without any adverse effects on the reliability or safety of burner operation; this conclusion complements and expands upon the findings of the aforementioned NaturalHy Project, which demonstrated the compatibility of real-world domestic boilers with HENG containing up to 20 mol% hydrogen.13
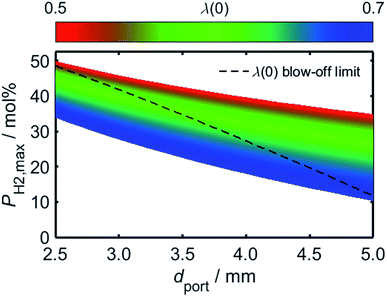 | ||
| Fig. 12 Predicted limit of molar hydrogen percentage, PH2,max, above which flash-back occurs during extinction, plotted as a function of dport over a range of λ(0) values. The maximum achievable value of λ(0) has been estimated from the onset of blow-off as a function of dport, as depicted in Fig. 11, and has been subsequently used to plot an upper constraint on PH2,max for each value of dport; this relationship is displayed as a dashed black line. For ports of diameter less than 3.5 mm, the plot indicates that up to 34.7 mol% hydrogen may be incorporated into the fuel without the occurrence of flame blow-off or flash-back upon extinction. | ||
While the stability of a burner flame has been related to a range of conditions defined as “normal” for a typical household appliance, it is worth additionally considering the behaviour of a burner which deviates from these parameters. Indeed, even in the case of a well-maintained appliance, there exist circumstances under which the value of qport might decrease to a value outside the expected range; for example, although natural gas is typically supplied to UK homes at a pressure of 21 mbar,90 a fault such as a leak could result in a lower supply pressure and a corresponding decrease in the rate of fuel injection. In the case of a set of cooktop burners, a transient decrease in supply pressure may also occur at turn-on of a burner, momentarily decreasing the value of qport for an existing burner flame. When assessing the viability of a particular fuel, it is therefore important to evaluate not only the flame stability under normal conditions, but also the behaviour during periods of sub-optimal operation. For this reason, while a parameter constraint estimated from stability diagrams provides a useful theoretical limit for reliable burner operation, a “safety margin” should be included when deciding upon a practical constraint based on this predicted limit. One example of this principle is provided in an early study by Eiseman, Weaver and Smith, who suggested that λ should be maintained to at least 10% below the value at onset of flash-back or blow-off, in addition to ensuring that qport is set at least 10% from these regions of flame instability.76
In terms of the present investigation, it is thus suggested that a more conservative limit be placed on PH2 than the estimated upper bound of 34.7 mol%. According to the results displayed in Fig. 12, a value of 30 mol% would be compatible with burner ports up to approximately 3.8 mm in diameter, providing an appropriate margin of safety for port diameters within the characteristic 2.5–3.5 mm range. By selecting a value of PH2 less than the theoretical maximum, one also allows for a small decrease in qport due to a reduction in fuel supply pressure, either as a result of a fault within the infrastructure or as a transient decrease at turn-on of a second burner.
Although the stability of a characteristic household burner has been verified for PH2 values as high as 30 mol%, it is important to recall the energy output of a given appliance; in particular, it was earlier stipulated that WI should remain above the minimum value of the European H-band distribution, set at 48.17 MJ Nm−3, which sets an upper PH2 limit of 23.4 mol%. For unblended natural gas possessing a WI value of 51 MJ Nm−3, increasing PH2 to the proposed value of 30 mol% results in a decrease of WI to 47.39 MJ Nm−3, which is potentially too low to provide adequate appliance performance. Despite this shortcoming, the true acceptable lower-limit of WI remains debatable due to the nature of the existing threshold, which was imposed primarily to ensure stability of an appliance fuelled by unblended natural gas.
7. Conclusions
Through consideration of existing combustion theory, a multi-faceted investigation has been conducted to evaluate the viability of hydrogen-enriched natural gas as a domestic fuel within the UK, without the need for changes in infrastructure such as domestic gas boilers, ovens and cooktop stoves. In addition to discussing the financial cost and environmental benefits of hydrogen-enrichment, the compatibility of the fuel with existing natural gas appliances has been explored. It has been shown that whilst hydrogen-enrichment acts to lower the calorific value of natural gas, it also augments the stability of a burner by suppressing the occurrence of flame blow-off, and prevents yellow-tipping by lowering the oxygen-requirements of the fuel. It is further argued that for ports less than 3.5 mm in diameter, HENG fuel containing as much as 50 mol% hydrogen may be ignited safely without risk of flash-back, while flash-back upon extinction of the flame occurs only if the hydrogen proportion exceeds approximately 34.7 mol%.While the present work serves to illuminate the capabilities of HENG in present-day domestic appliances, there are other factors to consider if hydrogen-enriched natural gas is to be adopted nationwide, or even on a smaller scale. It is debatable, for instance, whether the additional cost of incorporating hydrogen into the nation's fuel supply would be sufficiently palatable to the public, despite the clear advantage in terms of associated reduction in carbon dioxide output. Nevertheless, to properly evaluate the virtues and shortcomings of a given proposed composition of hydrogen-enriched natural gas, quantifying the physical effects of hydrogen-enrichment as a function of hydrogen percentage is a critical first step.
As part of the NaturalHy project discussed previously, modern domestic natural gas appliances were found to be compatible with hydrogen-enriched natural gas containing up to 20 mol% hydrogen, and, as part of a trial, this fuel was successfully supplied to real homes in the Ameland municipality.13 Based on the results discussed in the present investigation, it is proposed that, allowing for an appropriate margin of safety, the hydrogen proportion may be further enhanced to as much as 30 mol%, yielding a hydrogen-enriched natural gas composition that could reduce the carbon dioxide emission from domestic burner appliances by an estimated 11–18%. Currently, such an increase would correspond to a decrease in total carbon dioxide emissions of just 1.0–1.6% nationwide, which may not be deemed sufficiently beneficial to warrant the associated cost of hydrogen-enriching the domestic natural gas supply. It is important to remember, however, that these alterations have potential future benefits: most notably, when current natural gas appliances are replaced at the end of their expected lifespan of 10–30 years,91 a pre-existing network able to support hydrogen distribution could conceivably expedite the manufacture and sale of HENG-compatible burners, in turn permitting an increased proportion of hydrogen-enrichment within the domestic natural gas supply. Despite the arguably modest offset in carbon dioxide emissions achievable at present, therefore, a changeover from natural gas to HENG could nevertheless lead to much greater future savings.
Having identified the potential benefits of hydrogen-enrichment of a natural gas supply, as well as the corresponding limitations, the potential of hydrogen-enriched natural gas as a domestic fuel has been assessed in a quantitative manner. It has been shown that as much as 30 mol% of domestic natural gas may be substituted for hydrogen within the present-day infrastructure, facilitating a facile switchover of the supply without necessitating an expensive overhaul of existing household appliances. It is hoped that by evaluating the effects of hydrogen-enrichment on appliance operation and its impacts on both the environment and the end-consumer, the study will serve as a valuable resource for hydrogen-based energy policies as the international community continues its drive towards a less carbon-intensive energy future.
Conflicts of interest
The authors declare no competing financial interests.Acknowledgements
Financial support was provided by the Welsh Government Sêr Cymru Programme and the Flexis project 80835, which is part-funded by the European Regional Development Fund (ERDF) through the Welsh Government, as well as through collaboration with King Saud University. “Flexis is part-funded by the European Regional Development Fund (ERDF), through the Welsh Government” (“Ariennir yn rhannol gan Gronfa Datblygu Rhanbarthol Ewrop drwy Lywodraeth Cymru”).References
- S. Arapostathis, A. Carlsson-Hyslop, P. J. G. Pearson, J. Thornton, M. Gradillas, S. Laczay and S. Wallis, Energy Policy, 2013, 52, 25–44 CrossRef.
- M. Büchs and S. V. Schnepf, Ecol. Econ., 2013, 90, 114–123 CrossRef.
- M. E. Gallagher, A. Down, R. C. Ackley, K. Zhao, N. Phillips and R. B. Jackson, Environ. Sci. Technol. Lett., 2015, 2, 286–291 CrossRef CAS.
- G. Anandarajah, W. McDowall and P. Ekins, Int. J. Hydrogen Energy, 2013, 38, 3419–3432 CrossRef CAS.
- F. Ma, Y. Wang, H. Liu, Y. Li, J. Wang and S. Zhao, Int. J. Hydrogen Energy, 2007, 32, 5067–5075 CrossRef CAS.
- F. Ma, J. Deng, Z. Qi, S. Li, R. Chen, H. Yang and S. Zhao, Int. J. Hydrogen Energy, 2011, 36, 9278–9285 CrossRef CAS.
- F. Ma, Y. Wang, M. Wang, H. Liu, J. Wang, S. Ding and S. Zhao, Int. J. Hydrogen Energy, 2008, 33, 4863–4875 CrossRef CAS.
- F. Ma, S. Li, J. Zhao, Z. Qi, J. Deng, N. Naeve, Y. He and S. Zhao, Int. J. Hydrogen Energy, 2012, 37, 9892–9901 CrossRef CAS.
- M. Ricci, P. Bellaby and R. Flynn, Int. J. Hydrogen Energy, 2008, 33, 5868–5880 CrossRef CAS.
- M. Hulme, Nat. Clim. Change, 2016, 6, 222–224 CrossRef.
- P. E. Dodds and S. Demoullin, Int. J. Hydrogen Energy, 2013, 38, 7189–7200 CrossRef CAS.
- D. Haeseldonckx and W. Dhaeseleer, Int. J. Hydrogen Energy, 2007, 32, 1381–1386 CrossRef CAS.
- H. De Vries, O. Florisson and G. C. Tiekstra, Proc. Intern. Conf. on Hydrogen Safety, San Sebastian, Spain, 2007 Search PubMed.
- P. E. Dodds and W. McDowall, Energy Policy, 2013, 60, 305–316 CrossRef.
- U. Bössel, Proc. Eur. Fuel Cell Forum, Lucerne, Switzerland, 2003 Search PubMed.
- C. Park, C. Kim, Y. Choi, S. Won and Y. Moriyoshi, Int. J. Hydrogen Energy, 2011, 36, 3739–3745 CrossRef CAS.
- F. H. Sobrino, C. R. Monroy and J. L. H. Pérez, Renewable Sustainable Energy Rev., 2010, 14, 772–780 CrossRef CAS.
- J. M. Ogden, M. M. Steinbugler and T. G. Kreutz, J. Power Sources, 1999, 79, 143–168 CrossRef CAS.
- D. Flowers, S. Aceves, C. K. Westbrook, J. R. Smith and R. Dibble, J. Eng. Gas Turbines Power, 2001, 123, 433 CrossRef CAS.
- D. Che, Y. Liu and C. Gao, Energy Convers. Manage., 2004, 45, 3251–3266 CrossRef CAS.
- S. Blakey, L. Rye and C. W. Wilson, Proc. Combust. Inst., 2011, 33, 2863–2885 CrossRef CAS.
- H. Levinsky, S. Gersen and B. Kiewiet, Requirements for gas quality and gas appliances, D. G. O. Gas Report 74106553.01b, Groningen, The Netherlands, 2015 Search PubMed.
- J. L. Zachariah-Wolff, T. M. Egyedi and K. Hemmes, Int. J. Hydrogen Energy, 2007, 32, 1235–1245 CrossRef CAS.
- K. Lee, J.-M. Kim, B. Yu, C.-E. Lee and S. Lee, J. Mech. Sci. Technol., 2013, 27, 1191–1201 CrossRef.
- H. de Vries, A. V. Mokhov and H. B. Levinsky, Appl. Energy, 2017, 208, 1007–1019 CrossRef CAS.
- T. J. Hager and R. Morawicki, Food Policy, 2013, 40, 54–63 CrossRef.
- M. R. Shaner, H. A. Atwater, N. S. Lewis and E. W. McFarland, Energy Environ. Sci., 2016, 9, 2354–2371 CAS.
- S. Akansu, Int. J. Hydrogen Energy, 2004, 29, 1527–1539 CrossRef CAS.
- T. Sutharssan, D. Montalvao, Y. Chen, W.-C. Wang and C. Pisac, Int. J. Soc. Sci., 2016, 10, 73–77 Search PubMed.
- R. Phillips and C. W. Dunnill, RSC Adv., 2016, 6, 100643 RSC.
- G. Passas and C. W. Dunnill, J. Fundam. Renewable Energy Appl., 2015, 5, 188 Search PubMed.
- R. Phillips, A. Edwards, B. Rome, D. R. Jones and C. W. Dunnill, Int. J. Hydrogen Energy, 2017, 42, 23986–23994 CrossRef CAS.
- C. W. Dunnill, S. Noimark and I. P. Parkin, Thin Solid Films, 2012, 520, 5516–5520 CrossRef CAS.
- D. R. Jones, V. Gomez, J. C. Bear, B. Rome, F. Mazzali, J. D. McGettrick, A. R. Lewis, S. Margadonna, W. A. Al-Masry and C. W. Dunnill, Sci. Rep., 2017, 7, 4090 CrossRef PubMed.
- V. Gomez, J. C. Bear, P. D. McNaughter, J. D. McGettrick, T. Watson, C. Charbonneau, P. O'Brien, A. R. Barron and C. W. Dunnill, Nanoscale, 2015, 7, 17735–17744 RSC.
- C. W. H. Dunnill, Z. A. Aiken, J. Pratten, M. Wilson, D. J. Morgan and I. P. Parkin, J. Photochem. Photobiol., A, 2009, 207, 244–253 CrossRef CAS.
- C. W. Dunnill, Z. A. Aiken, A. Kafizas, J. Pratten, M. Wilson, D. J. Morgan and I. P. Parkin, J. Mater. Chem., 2009, 19, 8747–8754 RSC.
- J. C. Bear, V. Gomez, N. S. Kefallinos, J. D. McGettrick, A. R. Barron and C. W. Dunnill, J. Colloid Interface Sci., 2015, 460, 29–35 CrossRef CAS PubMed.
- S. Dunn, Int. J. Hydrogen Energy, 2002, 27, 235–264 CrossRef CAS.
- N. MacCarty, D. Still and D. Ogle, Energy Sustainable Dev., 2010, 14, 161–171 CrossRef.
- F. Pfeiffer, M. Struschka, G. Baumbach, H. Hagenmaier and K. R. G. Hein, Chemosphere, 2000, 40, 225–232 CrossRef CAS PubMed.
- P. Basu, C. Kefa and L. Jestin, Boilers and Burners: Design and Theory, Springer-Verlag, New York, 2000 Search PubMed.
- Y.-C. Ko and T.-H. Lin, Energy Convers. Manage., 2003, 44, 3001–3014 CrossRef CAS.
- A. Namkhat and S. Jugjai, Energy, 2010, 35, 1701–1708 CrossRef.
- G. von Elbe and J. Grumer, Ind. Eng. Chem., 1948, 40, 1123–1129 CrossRef CAS.
- J. Grumer, Ind. Eng. Chem., 1949, 41, 2756–2761 CrossRef CAS.
- C. Dong, Q. Zhou, X. Zhang, Q. Zhao, T. Xu and S. e. Hui, Front. Chem. Eng. China, 2010, 4, 417–422 CrossRef CAS.
- P. Dirrenberger, H. Le Gall, R. Bounaceur, O. Herbinet, P.-A. Glaude, A. Konnov and F. Battin-Leclerc, Energy Fuels, 2011, 25, 3875–3884 CrossRef CAS.
- A. E. Dahoe, J. Loss Prev. Process Ind., 2005, 18, 152–166 CrossRef.
- F. Halter, C. Chauveau, N. Djebaïli-Chaumeix and I. Gökalp, Proc. Combust. Inst., 2005, 30, 201–208 CrossRef.
- T. Boushaki, Y. Dhué, L. Selle, B. Ferret and T. Poinsot, Int. J. Hydrogen Energy, 2012, 37, 9412–9422 CrossRef CAS.
- V. Di Sarli and A. D. Benedetto, Int. J. Hydrogen Energy, 2007, 32, 637–646 CrossRef CAS.
- E. Hu, Z. Huang, J. He, C. Jin and J. Zheng, Int. J. Hydrogen Energy, 2009, 34, 4876–4888 CrossRef CAS.
- Z. Huang, Y. Zhang, K. Zeng, B. Liu, Q. Wang and D. Jiang, Combust. Flame, 2006, 146, 302–311 CrossRef CAS.
- M. E. Harris, J. Grumer, G. von Elbe and B. Lewis, Symp. Combust. Flame Explos. Phenom., 1948, 3, 80–89 CrossRef CAS.
- E. R. Weaver, J. Res. Natl. Bur. Stand., 1951, 46, 213–245 CrossRef CAS.
- A. Liñán, M. Vera and A. L. Sánchez, Annu. Rev. Fluid Mech., 2015, 47, 293–314 CrossRef.
- Y. Zhang, J. Wu and S. Ishizuka, Int. J. Hydrogen Energy, 2009, 34, 519–527 CrossRef CAS.
- T. Lieuwen, V. McDonell, D. Santavicca and T. Sattelmayer, Combust. Sci. Technol., 2008, 180, 1169–1192 CrossRef CAS.
- M. Kröner, J. Fritz and T. Sattelmayer, J. Eng. Gas Turbines Power, 2003, 125, 693 CrossRef.
- A. P. Giles, R. Marsh, P. J. Bowen and A. Valera-Medina, Fuel, 2016, 182, 531–540 CrossRef CAS.
- A. A. Putnam and R. A. Jensen, Symp. Combust. Flame Explos. Phenom., 1948, 3, 89–98 CrossRef CAS.
- H.-M. Li, G.-X. Li, Z.-Y. Sun, Y. Zhai and Z.-H. Zhou, Energies, 2014, 7, 4710–4726 CrossRef.
- E. C. Okafor, A. Hayakawa, Y. Nagano and T. Kitagawa, Int. J. Hydrogen Energy, 2014, 39, 2409–2417 CrossRef CAS.
- H. J. Burbano, J. Pareja and A. A. Amell, Int. J. Hydrogen Energy, 2011, 36, 3232–3242 CrossRef CAS.
- A. Kalantari and V. McDonell, Prog. Energy Combust. Sci., 2017, 61, 249–292 CrossRef.
- V. Hindasageri, R. P. Vedula and S. V. Prabhu, Int. J. Emerging Multidiscip. Fluid Sci., 2011, 3, 209–226 CrossRef.
- S. B. Reed, Combust. Flame, 1967, 11, 177–189 CrossRef CAS.
- D. W. van Krevelen and H. A. G. Chermin, Proc. Combust. Inst., 1958, 7, 358–368 CrossRef.
- B. Dam, N. Love and A. Choudhuri, Fuel, 2011, 90, 618–625 CrossRef CAS.
- N. Syred, M. Abdulsada, A. Griffiths, T. O'Doherty and P. Bowen, Appl. Energy, 2012, 89, 106–110 CrossRef CAS.
- S.-S. Hou, C.-Y. Lee and T.-H. Lin, Energy Convers. Manage., 2007, 48, 1401–1410 CrossRef CAS.
- H. S. Zhen, C. W. Leung and T. T. Wong, Fuel, 2014, 119, 153–156 CrossRef CAS.
- Y. M. Al-Abdeli and A. R. Masri, Exp. Therm. Fluid Sci., 2015, 69, 178–196 CrossRef CAS.
- S. Jugjai and N. Rungsimuntuchart, Exp. Therm. Fluid Sci., 2002, 26, 581–592 CrossRef CAS.
- J. H. Eiseman, E. R. Weaver and F. A. Smith, Bur. Stand. J. Res., 1932, 8, 669–709 CrossRef CAS.
- P. Therkelsen, R. K. Cheng and D. Sholes, Research and development of natural draft ultra-low emissions burners for gas appliances, L. B. N. Laboratory Report CEC-500-2016-054, California Energy Commission, Sacramento, USA, 2015 Search PubMed.
- R. Junus, J. F. Stubington and G. D. Sergeant, Int. J. Environ. Stud., 1994, 45, 101–121 CrossRef CAS.
- C.-E. Lee, C.-H. Hwang and S.-C. Hong, Fuel, 2008, 87, 3687–3693 CrossRef CAS.
- W. Dai, C. Qin, Z. Chen, C. Tong and P. Liu, Energy Convers. Manage., 2012, 63, 157–161 CrossRef CAS.
- Y. Kobayashi, A. Kurokawa and M. Hirata, J. Therm. Sci. Technol., 2007, 2, 236–244 CrossRef CAS.
- C. Wilson, Ind. Eng. Chem., 1959, 51, 560–563 CrossRef CAS.
- R. Friedman and W. C. Johnston, J. Appl. Phys., 1950, 21, 791–795 CrossRef CAS.
- A. E. Potter, in Progress in Combustion Science and Technology, ed. J. Ducarme, M. Gerstein and A. H. Lefebvre, Pergamon Press, Oxford, 1960, vol. 1, pp. 145–175 Search PubMed.
- R. Friedman, Symp. Combust. Flame Explos. Phenom., 1948, 3, 110–120 CrossRef CAS.
- D. R. Ballal and A. H. Lefebvre, Proc. R. Soc. London, Ser. A, 1977, 357, 163–181 CrossRef CAS.
- K. Kim, D. Lee and S. Kwon, Combust. Flame, 2006, 146, 19–28 CrossRef CAS.
- J. Wang, Z. Huang, C. Tang, H. Miao and X. Wang, Int. J. Hydrogen Energy, 2009, 34, 1084–1096 CrossRef CAS.
- J. Jarosiński, Combust. Flame, 1983, 50, 167–175 CrossRef.
- K. L. Smith, M. D. Steven and J. J. Colls, Remote Sens. Environ., 2004, 92, 207–217 CrossRef.
- J. Lutz, A. Lekov, P. Chan, C. Whitehead, S. Meyers and J. McMahon, Energy, 2006, 31, 311–329 CrossRef.
| This journal is © The Royal Society of Chemistry 2018 |

