Improving the activity of CoxP nanoparticles for the electrochemical hydrogen evolution by hydrogenation†
Lihong
Tian
ab,
James
Murowchick
c and
Xiaobo
Chen
 *a
*a
aDepartment of Chemistry, University of Missouri – Kansas City, Kansas City, Missouri 64110, USA. E-mail: chenxiaobo@umkc.edu
bHubei Collaborative Innovation Center for Advanced Organochemical Materials, Ministry of Education Key Laboratory for the Synthesis and Applications of Organic Functional Molecules, Hubei University, Wuhan 430062, China
cDepartment of Geosciences, University of Missouri – Kansas City, Kansas City, Missouri 64110, USA
First published on 5th January 2017
Abstract
Hydrogenation has recently been demonstrated on various oxide nanomaterials to enhance their optical and electrochemical properties. Here, we demonstrate that the activity of cobalt phosphide nanoparticles in the electrochemical hydrogen evolution reaction (HER) can be improved by hydrogenation. The hydrogenation apparently introduces nanoscale disordering near the surface of the crystalline nanoparticles without introducing any bulk phase change. The enhanced activity is due to the reduced hydrogen adsorption resistance and the enhanced electrochemically active surface area after hydrogenation, likely from the formation of the crystalline/disordered structure.
Introduction
Hydrogenation here refers to the treatment of materials under a hydrogen-containing environment or hydrogen plasma for a certain time at a certain temperature. It has recently been demonstrated in the modification of the structural, electronic, optical, photocatalytic and photoelectrical properties of many oxide nanoparticles.1,2 For example, hydrogenated TiO2 nanoparticles displayed a distinct black color after heating white crystalline TiO2 nanocrystals under a high-pressure pure hydrogen environment.1a A thin disordered layer near the surface of the nanoparticles, surrounding a crystalline core, is created, forming a crystalline/disordered core/shell nanostructure.1 Besides enhancing the photocatalytic performance of TiO2, hydrogenation has also been shown to improve its performance in the lithium-ion battery,3 supercapacitors,4a fuel cells,4b field emission,4c and microwave absorption.4d–f Hydrogenation has also been successfully applied to other oxide nanomaterials to improve their properties.5 For example, hydrogenated ZnO nanoparticles have shown enhanced photocatalytic5a and supercapacitor5b properties. Hydrogenated BaTiO3 nanoparticles showed improved microwave absorption,5c and hydrogenated NiO nanostructures showed better pseudocapacitor performance.5dHydrogen has been regarded as one of the cleanest fuels and one of the most important energy carriers for clean energy applications. Electrochemical reduction of water is believed to be a facile approach to produce hydrogen with a high purity and in a large scale.6,7 The state-of-the-art electrocatalyst is platinum. Its terrestrial scarcity and high cost largely limit the wide applications for large-scale hydrogen production.8 Thus, non-noble metal, inexpensive electrocatalysts with satisfactory performance are highly desirable for the deployment of large-scale electrochemical production of hydrogen. Transition metal phosphides have recently been found with good electrical conductivities, chemical stabilities and superior HER activities under acidic conditions.9 For instance, Ni2P,10 FeP,11 MoP,12 Co2P13 and CoP14 have been reported to show high HER activities, especially the cobalt phosphides. Currently, many strategies have been employed to improve their HER performances such as tuning of the size, morphology, structure and chemical composition of metal phosphide nanocatalysts along with compositing them with other materials.10–14 We have shown that hydrogenation can improve the performance of several oxide catalysts for the electrochemical hydrogen evolution reaction (HER) through water electrolysis.15 In those oxide catalysts, the improved HER performance has been attributed to the reduced surface charge transfer resistance and increased electrochemical active surface area (ECSA) after hydrogenation.
Here we demonstrate that hydrogenation can enhance the HER performance of cobalt phosphide (CoxP) nanocatalysts. The hydrogenated CoxP (H-CoxP) catalyst shows an enhanced cathodic current density for the HER at a low overpotential and a small Tafel slope (ca. 51 mV dec−1) with an overpotential of 110 mV to reach the current density of 10 mV cm−2. The enhanced HER performance benefits from the reduced surface hydrogen adsorption resistance and the increased ECSA, likely due to the formation of the disordered/crystalline core/shell nanostructures after hydrogenation. This study, combined with our previous studies on the improvement of HER performance of oxide catalysts by hydrogenation,15 demonstrates that hydrogenation is a practically effective approach in improving the electrochemical performance of not only oxide materials, but also non-oxide materials, for electrochemical hydrogen production from water by electrolysis.
Results & discussion
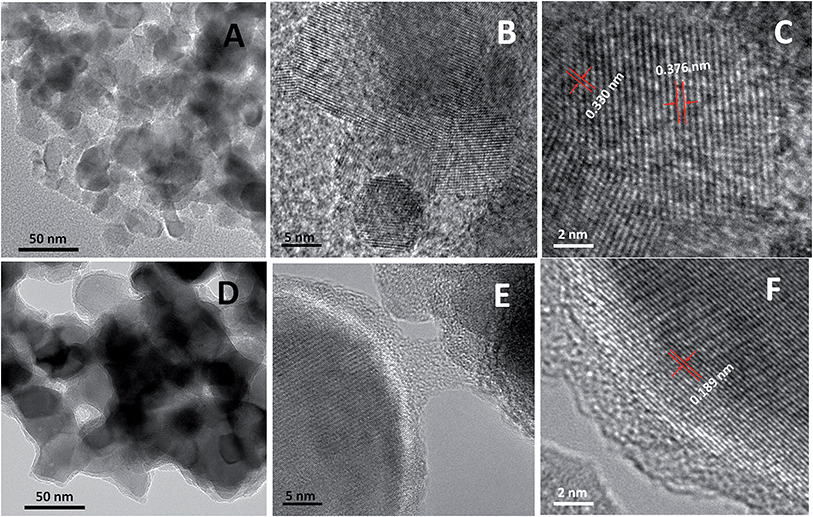
The formation of CoxP nanoparticles was based on the reaction of NaH2PO2 and Co(OH)2 at elevated temperatures under inert gas protection.14d The reaction likely proceeded in two steps. (1) Decomposition of NaH2PO2 into Na2HPO4 and PH3 gas; and (2) formation of CoxP from the reaction between PH3 and Co(OH)2.14d Aggregated clusters of small CoxP nanoparticles were formed with high crystallinity. Hydrogenation induced dramatical structural changes of the CoxP nanoparticles on a nanometer scale, i.e. crystalline/disordered core/shell structures. Fig. 1A shows a typical low-magnification transmission electron microscopy (TEM) image of the pristine CoxP nanoparticles. The CoxP nanoparticles had a broad size distribution ranging from 15 to 40 nm. The high-resolution TEM (HRTEM) showed that the formed CoxP nanoparticles were typically highly crystalline with well-resolved lattice fringes through the entire nanoparticles (Fig. 1B). The HRTEM showed both phases were highly crystalline with clear lattice spacing, as shown in Fig. 1C, of 0.376 and 0.330 nm for the (101) and (020) crystal planes of CoP and Co2P, respectively. A broad view of the nanoparticles at low resolution (Fig. S1 and S2†) revealed that these nanoparticles formed aggregated clusters with a size from 600 nm to 1.5 μm in diameter. Overall, the pristine CoxP nanoparticles were typically highly crystalline through the entire nanoparticles.The hydrogenated CoxP nanoparticles showed crystalline/disordered core/shell nanostructures. Fig. 1D shows a typical low resolution TEM image of the CoxP nanoparticles. More images are shown in Fig. S3 and S4.† Apparently, the core/shell nanostructure was clearly observed on all the hydrogenated CoxP nanoparticles. Compared to the pristine CoxP nanoparticles (Fig. 1A), the hydrogenated CoxP nanoparticles had a large primary particle size, from 30 to 50 nm in diameter. The increase of the particle size was likely due to the heating treatment in the hydrogen environment; possibly from the heating effect and hydrogen-induced growth of the particle size.4d–f The HRTEM images in Fig. 1E and F show that a highly crystalline CoxP core was wrapped with a 2–5 nm thick disordered layer. The clear lattice spacing of 0.189 nm shown in Fig. 1F corresponded to the (211) crystal plane of the CoP phase. In some core/shell nanostructures, both crystalline CoP and Co2P phases were identified. For example, in the HRTEM images shown in Fig. S5 and S6†, besides the large crystalline CoP core with a clear 0.189 nm (211) plane, some small crystalline domains were observed with a clear 0.221 nm (121) for the Co2P phase.
The X-ray diffraction (XRD) patterns for both pristine and hydrogenated CoxP nanoparticles (Fig. 2A) showed the majority crystalline CoP phase (JCPDF no. 29-0497) with peaks at 31.6, 35.3, 36.3, 46.2, 48.1, 56.0 and 56.4° corresponding to the (011), (200), (111), (112), (211), (020) and (212) planes and some Co2P phase (JCPDF no. 32-0306) with peaks at 40.8, 43.4, 52.2° corresponding to the (121), (211) and (002) planes. The hydrogenated CoxP nanoparticles had a slightly higher content of the Co2P phase based on the corresponding stronger peaks.
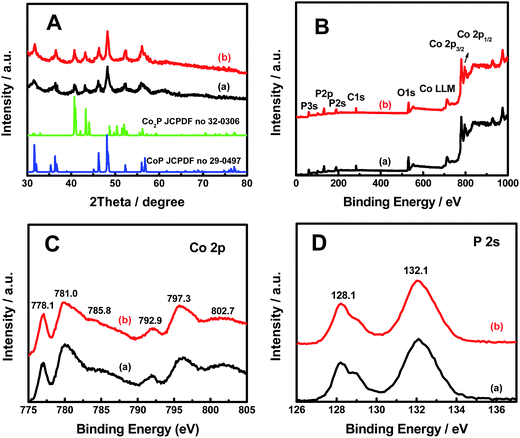 | ||
| Fig. 2 (A) XRD, (B) XPS survey, (C) Co 2p and (D) P 2s core-level XPS spectra of (a) pristine and (b) hydrogenated CoxP nanoparticles. | ||
The X-ray photoelectron spectroscopy (XPS) survey displayed that Co, P, O and C were detected in both pristine and hydrogenated CoxP nanoparticles (Fig. 2B). All the XPS spectra were calibrated with the C 1s peak to 284.6 eV. The carbon signals were from the carbon tape pasted with the sample during the XPS measurements. In the Co 2p core-level spectrum shown in Fig. 2C, the two peaks at 778.1 and 792.9 eV were ascribed to reduced Co+ ions in the CoxP; another two strong peaks at 781.0 eV (Co 2p3/2) and 797.3 eV (Co 2p1/2) were attributed to Co2+ and Co3+, respectively;16 and the two weak bands at 785.8 and 802.7 eV were their satellite signals. Compared to the pristine CoxP nanoparticles, the hydrogenated CoxP nanoparticles had a higher content of Co+ and Co2+ ions as seen from the higher intensities. The strong peaks located at 128.1 and 132.1 eV were assigned to the P 2p3/2 and P 2p1/2 of P3− ions in the CoxP nanoparticles (Fig. 2D).17 The peak intensity on the lower energy side was smaller after hydrogenation. Combined with the information from XRD and TEM, the disordered surface layer was likely made of amorphous CoxP layers with Co and P ions with lower valence states.
The hydrogenated CoxP nanoparticles in this study had displayed an impressive HER activity in a typical acidic electrolyte. The HER catalytic performances of the pristine and hydrogenated CoxP nanoparticles were examined using a typical three-electrode setup in 0.5 M H2SO4. A titanium foil and a commercial Pt/C (20 wt% Pt) electrode were studied for comparison. Herein, all potentials in this work were reported versus reversible hydrogen evolution (RHE) potential. All the polarization curves were iR-corrected. Fig. 3A shows the polarization curves of pristine and hydrogenated CoxP, Ti and Pt/C. The commercial Pt/C electrode exhibited an excellent HER activity with near zero onset potential, while the Ti electrode had a poor activity with an onset overpotential of 303 mV. The CoxP showed a very small onset overpotential of 30 mV, and required small overpotentials of 144 and 167 mV to acquire 10 and 20 mA cm−2, respectively. The hydrogenated CoxP nanoparticles showed a very small onset overpotential of 20 mV, and required small overpotentials of 110 and 124 mV to acquire 10 and 20 mA cm−2, respectively. These overpotentials for hydrogenated CoxP nanoparticles were comparable to those of Co2P,13 nanoporous CoP/Co2P,14a FeP,16 MoP,17 and W2P.18 Apparently, hydrogenation enhanced the HER performance of the CoxP nanoparticles. The improved catalytic activity was also confirmed with a graphite electrode as the counter electrode (Fig. S7†), as a recent report found that in some systems, Pt nanoparticles can deposit on the working electrode to induce some artifacts if a Pt wire is used as the counter electrode for the HER.19
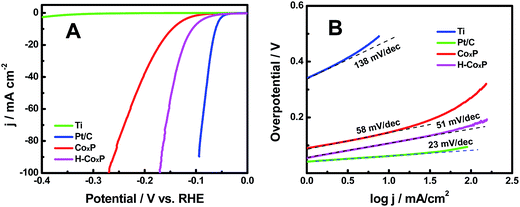 | ||
| Fig. 3 (A) Polarization curves and (B) the corresponding Tafel plots of the hydrogenated CoxP (H-CoxP) nanoparticles, pristine CoxP nanoparticles, Ti and commercial Pt/C electrodes. | ||
The corresponding Tafel plots are presented in Fig. 3B. The linear portion of the Tafel plots was fitted to the Tafel equation η = b![[thin space (1/6-em)]](https://www.rsc.org/images/entities/char_2009.gif) log
log![[thin space (1/6-em)]](https://www.rsc.org/images/entities/char_2009.gif) j + a, where η is the applied overpotential, j is the current density, b is the Tafel slope and a is the intercept relative to the exchange current density. Pt/C had a Tafel slope of 23 mV dec−1 and the Ti electrode showed a large Tafel slope of 138 mV dec−1. The Tafel slope was 58 mV dec−1 for the pristine CoxP nanoparticles, and 51 mV dec−1 for the hydrogenated CoxP nanoparticles. The latter value was comparable to that of other catalysts such as CoP/CNT,14c CoP/CC,20 CoP nanorods,21 CoP film,22 FeP-graphene23 and Ni2P/carbon nanosphere.24 The HER in acidic solutions can be written in two steps: the Volmer (electrochemical hydrogen adsorption: 2H+ + 2e− → 2Had), and the Tafel reaction (chemical desorption: Had + Had → H2) or Heyrovsky process (electrochemical desorption: Had + H+ + e− → H2).24,25 A Tafel slope of 120, 40, or 30 mV dec−1 is expected if the Volmer, Heyrovsky, or Tafel step is the rate-determining step, respectively. These Tafel slopes of both pristine (58 mV dec−1) and hydrogenated (51 mV dec−1) CoxP nanoparticles indicated that the HER occurred through a Volmer–Heyrovsky mechanism, and the electrochemical recombination with an additional proton to form the desorbed H2 gas was likely the main rate-limiting step, as these values were close to that of the Heyrovsky process. Since the Tafel slope of the hydrogenated CoxP nanoparticles was smaller than that of the pristine CoxP nanoparticles, that indicated that for the hydrogenated CoxP nanoparticles, the contribution of the Heyrovsky process to the rate-limiting step increased, or in other words, the contribution of the Volmer process to the rate-limiting step decreased. That meant that the electrochemical hydrogen adsorption was facilitated in the hydrogenated CoxP nanoparticles.
j + a, where η is the applied overpotential, j is the current density, b is the Tafel slope and a is the intercept relative to the exchange current density. Pt/C had a Tafel slope of 23 mV dec−1 and the Ti electrode showed a large Tafel slope of 138 mV dec−1. The Tafel slope was 58 mV dec−1 for the pristine CoxP nanoparticles, and 51 mV dec−1 for the hydrogenated CoxP nanoparticles. The latter value was comparable to that of other catalysts such as CoP/CNT,14c CoP/CC,20 CoP nanorods,21 CoP film,22 FeP-graphene23 and Ni2P/carbon nanosphere.24 The HER in acidic solutions can be written in two steps: the Volmer (electrochemical hydrogen adsorption: 2H+ + 2e− → 2Had), and the Tafel reaction (chemical desorption: Had + Had → H2) or Heyrovsky process (electrochemical desorption: Had + H+ + e− → H2).24,25 A Tafel slope of 120, 40, or 30 mV dec−1 is expected if the Volmer, Heyrovsky, or Tafel step is the rate-determining step, respectively. These Tafel slopes of both pristine (58 mV dec−1) and hydrogenated (51 mV dec−1) CoxP nanoparticles indicated that the HER occurred through a Volmer–Heyrovsky mechanism, and the electrochemical recombination with an additional proton to form the desorbed H2 gas was likely the main rate-limiting step, as these values were close to that of the Heyrovsky process. Since the Tafel slope of the hydrogenated CoxP nanoparticles was smaller than that of the pristine CoxP nanoparticles, that indicated that for the hydrogenated CoxP nanoparticles, the contribution of the Heyrovsky process to the rate-limiting step increased, or in other words, the contribution of the Volmer process to the rate-limiting step decreased. That meant that the electrochemical hydrogen adsorption was facilitated in the hydrogenated CoxP nanoparticles.
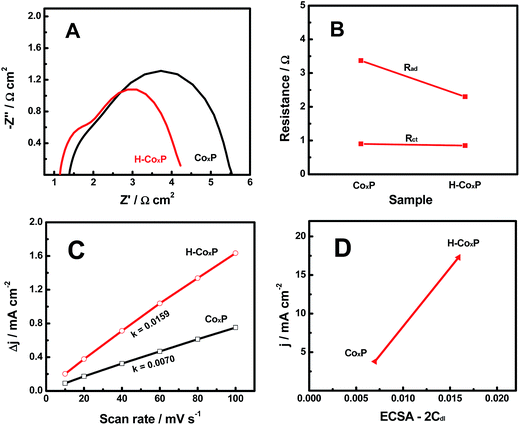
In order to further find out why the HER activity of the CoxP nanoparticles was improved after hydrogenation, we compared electrochemical impedance spectroscopy (EIS) spectra of the pristine and hydrogenated CoxP under an overpotential of 144 and 110 mV (10 mA cm−2), respectively. Two semicircles were observed in the Nyquist plots (Fig. 4A). The low-frequency semicircle was related to the hydrogen adsorption on the electrodes forming hydride-type species, while the high-frequency semicircle was associated with the HER charge transfer kinetics.15 This suggested that both hydrogen adsorption and charge transfer influenced the HER activity of both pristine and hydrogenated CoxP nanoparticles. Meanwhile, the resistances were smaller for hydrogenated CoxP nanoparticles. The changes of the hydrogen adsorption impedance (Rad) and surface charge transfer resistance (Rct) of the pristine and hydrogenated CoxP nanoparticles are compared in Fig. 4B. For the CoxP nanoparticles after hydrogenation, the surface charge transfer resistance Rct only slightly decreased from 0.90 to 0.85 Ω, while the hydrogen adsorption impedance Rad decreased apparently from 3.37 to 2.30 Ω. This result suggested that the enhanced HER activity of the hydrogenated CoxP nanoparticles was likely mainly due to the better hydrogen adsorption kinetics of the HER on the surface of the catalyst. This conclusion matched with the analysis of the Tafel slopes.
We further analyzed the ECSA of the pristine and hydrogenated CoxP nanoparticles, as the surface area of the catalysts was believed to correlate with the HER activity.15 The linear slope of the capacitive current as a function of the scan rate shown in Fig. 4C represented the ECSA, as the ECSA was linearly proportional to Cdl as the 2-fold Cdl.15,26 A larger ECSA value indicates more active sites. Hydrogenated CoxP nanoparticles had about two times the ECSA as that of pristine CoxP nanoparticles. This suggested that hydrogenation increased the number of active sites for the HER on the surface of CoxP nanoparticles. These increased active sites might apparently facilitate the surface hydrogen adsorption. Fig. 4D shows the relationship of the HER density at an overpotential of 120 mV plotted verse the ESCA (2Cdl) of the pristine and hydrogenated CoxP nanoparticles. Apparently, a larger ECSA corresponded to a higher HER current. The current density increased to 17.28 mA cm−2 from 3.78 mA cm−2 with the ECSA changing to 0.0159 from 0.007. The increase in the current density (457%) was much larger than that of the increase of ECSA (227%) after hydrogenation. This indicated that hydrogenation not only increased the number of active sites but also reduced the energy barriers for the active sites.
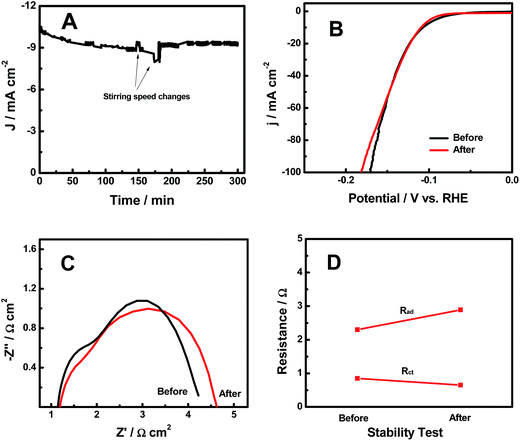
The HER stability results of the H-CoxP nanoparticles are shown in Fig. 5A. The current density continuously decreased in the first 150 min from 10.4 to 8.9 mA cm−2. An increase of the stirring speed recovered some of the decreased HER current density, and the following return of the stirring speed resumed the continuous decrease of the current density. The large increase of the stirring speed after 180 min apparently maintained a constant HER current density. It seemed that the stirring speed played an important role in the HER performance of the H-CoxP nanoparticles. This was reasonable to understand if we consider the HER mechanism on the H-CoxP nanoparticles. Based on the Tafel analysis, the HER on the H-CoxP nanoparticles followed the Volmer–Heyrovsky mechanism, where the electrochemical recombination with an additional proton to form the desorbed H2 gas in the Heyrovsky step was the primary rate-limiting step, and the H2 adsorption in the Tafel process was the secondary rate-limiting step. Increasing the stirring speed would facilitate the H2 gas desorption from the surface in the Heyrovsky step, and create fresh active sites on the surface to promote the H2 gas adsorption in the Tafel step. Both helped the HER process. Thus, a constant HER current was achieved under a suitable stirring speed. The polarization curves of the H-CoxP nanoparticles before and after the stability test are shown in Fig. 5B. These curves were almost identical expect the small decrease of the performance at high current density after the stability test. This indicated that the H-CoxP nanoparticles had a fairly stable HER performance. The Nyquist plots, and the change of adsorption impedance (Rad) and charge transfer resistance (Rct) of the H-CoxP nanoparticles before and after the stability test are shown in Fig. 5C and D. After the stability test, Rad increased from 2.3 to 2.89 Ω and Rct slightly decreased from 0.85 to 0.65 Ω. The slight decrease of the Rct was understood if the surface was gradually optimized or stabilized during the HER process. While, the increased adsorption impedance Rad indicated the need for the increase of stirring speed to maintain the constant current density as the reaction proceeded, consistent with the results from the stability test.
Table S1† showed the overpotentials of various HER catalysts at a current density of 10 mA cm−2. The hydrogenated CoxP nanoparticles showed competitive HER performance among non-noble metal based HER electrocatalysts reported so far.27–35 Thus, this study demonstrated that hydrogenation is a powerful tool in not only improving the HER performance for non-oxide catalysts but also increased the ECSA and reduced the H2 adsorption resistance, which were likely related to the formation of the unique crystalline/disordered core/shell nanostructure of the H-CoxP catalyst after hydrogenation.
Conclusions
In summary, we have demonstrated here that hydrogenation can improve the HER performance of non-oxide, CoxP nanoparticles. The improved HER activity is likely benefited from the much reduced hydrogen adsorption resistance Rad and the increased ECSA, which is likely related to the increase of the reduced Co species after hydrogenation. Stable HER performance is achievable under suitable stirring conditions to reduce the contribution of the gas adsorption/desorption process. The enhancement of the HER performance of the H-CoxP nanoparticles may be traced down to the unique crystalline/disordered core/shell nanostructure formed after hydrogenation, similar to other oxide catalysts. Combined with our previous studies on the improvement of HER performance of oxide catalysts by hydrogenation, this study shows that hydrogenation is a practically versatile and effective approach in improving the electrochemical performance of not only oxide materials, but also non-oxide materials, for electrochemical hydrogen production from water by electrolysis.36Acknowledgements
X. C. acknowledges the support from the College of Arts and Sciences, University of Missouri – Kansas City, and University of Missouri Research Board. L. T. thanks the National Natural Science Foundation of China (51302072) and the China Scholarship Council for financial support.Notes and references
-
(a) X. Chen, L. Liu, P. Y. Yu and S. S. Mao, Science, 2011, 331, 746 CrossRef CAS PubMed
; (b) T. Xia and X. Chen, J. Mater. Chem. A, 2013, 1, 2983 RSC
; (c) X. Chen, L. Liu, Z. Liu, M. A. Marcus, W.-C. Wang, N. A. Oyler, M. E. Grass, B. Mao, P.-A. Glans, P. Y. Yu, J. Guo and S. S. Mao, Sci. Rep., 2013, 3, 1510 Search PubMed
.
- A. Naldoni, S. Cappelli, C. L. Bianchi, R. Psaro and V. Dal Santo, J. Am. Chem. Soc., 2012, 134, 7600 CrossRef CAS PubMed
.
-
(a) J.-Y. Shin, J. H. Joo, D. Samuelis and J. Maier, Chem. Mater., 2012, 24, 543 CrossRef CAS
; (b) Z. Lu, C.-T. Yip, L. Wang, H. Huang and L. Zhou, ChemPlusChem, 2012, 77, 991 CrossRef CAS
; (c) L. Shen, E. Uchaker, X. Zhang and G. Cao, Adv. Mater., 2012, 24, 6502 CrossRef CAS PubMed
; (d) T. Xia, W. Zhang, W. Li, N. A. Oyler, G. Liu and X. Chen, Nano Energy, 2013, 2, 826 CrossRef CAS
.
-
(a) X. Lu, G. Wang, T. Zhai, M. Yu, J. Gan, Y. Tong and Y. Li, Nano Lett., 2012, 12, 1690 CrossRef CAS PubMed
; (b) C. Zhang, H. Yu, Y. Li, Y. Gao, Y. Zhao, W. Song, Z. Shao and B. Yi, ChemSusChem, 2013, 6, 659 CrossRef CAS PubMed
; (c) W.-D. Zhu, C.-W. Wang, J.-B. Chen, D.-S. Li, F. Zhou and H.-L. Zhang, Nanotechnology, 2012, 23, 455204 CrossRef PubMed
; (d) T. Xia, C. Zhang, N. A. Oyler and X. Chen, Adv. Mater., 2013, 25, 6905 CrossRef CAS PubMed
; (e) T. Xia, C. Zhang, N. A. Oyler and X. Chen, J. Mater. Res., 2014, 29, 2198 CrossRef CAS
; (f) T. Xia, Y. Cao, N. A. Oyler, J. Murowchick, L. Liu and X. Chen, ACS Appl. Mater. Interfaces, 2015, 7, 10407 CrossRef CAS PubMed
.
-
(a) T. Xia, P. Wallenmeyer, A. Anderson, J. Murowchick, L. Liu and X. Chen, RSC Adv., 2014, 4, 41654 RSC
; (b) P. Yang, X. Xiao, Y. Li, Y. Ding, P. Qiang, X. Tan, W. Mai, Z. Lin, W. Wu, T. Li, H. Jin, P. Liu, J. Zhou, C. P. Wong and Z. L. Wang, ACS Nano, 2013, 7, 2617 CrossRef CAS PubMed
; (c) L. Tian, X. Yan, J. Xu, P. Wallenmeyer, J. B. Murowchick, L. Liu and X. Chen, J. Mater. Chem. A, 2015, 3, 12550 RSC
; (d) A. K. Singh, D. Sarkar, G. G. Khan and K. Mandal, ACS Appl. Mater. Interfaces, 2014, 6, 4684 CrossRef CAS PubMed
.
- S. X. Weng and X. Chen, Nano Energy, 2016, 19, 138 CrossRef CAS
.
- F. Song and X. Hu, Nat.
Commun., 2014, 5, 4477 CAS
.
-
(a) W. Liu, E. Hu, H. Jiang, Y. Xiang, Z. Weng, M. Li, Q. Fan, X. Yu, E. I. Altman and H. Wang, Nat. Commun., 2016, 7, 10771 CrossRef CAS PubMed
; (b) D. Merki, S. Fierro, H. Vrubel and X. Hu, Chem. Sci., 2011, 2, 1262 RSC
; (c) D. Merki and X. Hu, Energy Environ. Sci., 2011, 4, 3878 RSC
.
- D. Kong, J. J. Cha, H. Wang, H. R. Lee and Y. Cui, Energy Environ. Sci., 2013, 6, 3553 CAS
.
- E. J. Popczun, J. R. McKone, C. G. Read, A. J. Biacchi, A. M. Wiltrout, N. S. Lewis and R. E. Schaak, J. Am. Chem. Soc., 2013, 135, 9267 CrossRef CAS PubMed
.
- P. Jiang, Q. Liu, Y. Liang, J. Tian, A. M. Asiri and X. Sun, Angew. Chem., Int. Ed., 2014, 53, 12855 CrossRef CAS PubMed
.
- J. Kibsgaard and T. F. Jaramillo, Angew. Chem., Int. Ed., 2014, 53, 14433 CrossRef CAS PubMed
.
- J. F. Callejas, C. G. Read, E. J. Popczun, J. M. McEnaney and R. E. Schaak, Chem. Mater., 2015, 27, 3769 CrossRef CAS
.
-
(a) Y. Yang, H. Fei, G. Ruan and J. M. Tour, Adv. Mater., 2015, 27, 3175 CrossRef CAS PubMed
; (b) P. Jiang, Q. Liu, C. Ge, W. Cui, Z. Pu, A. M. Asiri and X. Sun, J. Mater. Chem. A, 2014, 2, 14634 RSC
; (c) Q. Liu, J. Tian, W. Cui, P. Jiang, N. Cheng, A. M. Asiri and X. Sun, Angew. Chem., 2014, 126, 6828 CrossRef
; (d) L. Tian, X. Yan, X. Chen, L. Liu and X. Chen, J. Mater. Chem. A, 2016, 4, 13011–13016 RSC
; (e) Q. Li, Z. Xing, A. M. Asiri, P. Jiang and X. Sun, Int. J. Hydrogen Energy, 2014, 39, 16806 CrossRef CAS
.
-
(a) X. Yan, L. Tian, M. He and X. Chen, Nano Lett., 2015, 15, 6015 CrossRef CAS PubMed
; (b) X. Yan, L. Tian and X. Chen, J. Power Sources, 2015, 300, 336 CrossRef CAS
; (c) X. Yan, K. Li, L. Lyu, F. Song, J. He, D. Niu, L. Liu, X. Hu and X. Chen, ACS Appl. Mater. Interfaces, 2016, 8, 3208 CrossRef CAS PubMed
; (d) X. Yan, L. Tian, J. B. Murowchick and X. Chen, J. Mater. Chem. A, 2016, 4, 3683 RSC
.
- Y. Xu, R. Wu, J. Zhang, Y. Shi and B. Zhang, Chem. Commun., 2013, 49, 6656 RSC
.
- P. Xiao, M. A. Sk, L. Thia, X. Ge, R. J. Lim, J. Y. Wang, K. H. Lim and X. Wang, Energy Environ. Sci., 2014, 7, 2624 CAS
.
- Z. Xing, Q. Liu, A. M. Asiri and X. Sun, ACS Catal., 2015, 5, 145 CrossRef CAS
.
- G. Dong, M. Fang, H. Wang, S. Yip, H.-Y. Cheung, F. Wang, C.-Y. Wong, S. Chu and J. C. Ho, J. Mater. Chem. A, 2015, 3, 13080 CAS
.
- Q. Li, Z. Xing, A. M. Asiri, P. Jiang and X. Sun, Int. J. Hydrogen Energy, 2014, 39, 16806 CrossRef CAS
.
- Z. Huang, Z. Chen, Z. Chen, C. Lv, M. G. Humphrey and C. Zhang, Nano Energy, 2014, 9, 373 CrossRef CAS
.
- F. H. Saadi, A. I. Carim, E. Verlage, J. C. Hemminger, N. S. Lewis and M. P. Soriaga, J. Phys. Chem. C, 2014, 118, 29294 CAS
.
- Z. Zhang, B. Lu, J. Hao, W. Yang and J. Tang, Chem. Commun., 2014, 50, 11554 RSC
.
- Y. Pan, Y. Liu and C. Liu, J. Power Sources, 2015, 285, 169 CrossRef CAS
.
-
(a) B. E. Conway and B. V. Tilak, Electrochim. Acta, 2002, 47, 3571–3594 CrossRef CAS
; (b) S. Marini, P. Salvi, P. Nelli, R. Pesenti, M. Villa, M. Berrettoni, G. Zangari and Y. Kiros, Electrochim. Acta, 2012, 82, 384–391 CrossRef CAS
.
- M. A. Lukowski, A. S. Daniel, F. Meng, A. Forticaux, L. Li and S. Jin, J. Am. Chem. Soc., 2013, 135, 10274 CrossRef CAS PubMed
.
- J. Tian, Q. Liu, N. Cheng, A. M. Asiri and X. Sun, Angew. Chem., Int. Ed., 2014, 53, 9577 CrossRef CAS PubMed
.
- Y. Zheng, Y. Jiao, L. H. Li, T. Xing, Y. Chen, M. Jaroniec and S. Z. Qiao, ACS Nano, 2014, 8, 5290 CrossRef CAS PubMed
.
- D. Voiry, M. Salehi, R. Silva, T. Fujita, M. Chen, T. Asefa, V. B. Shenoy, G. Eda and M. Chhowalla, Nano Lett., 2013, 13, 6222 CrossRef CAS PubMed
.
- D. Merki, S. Fierro, H. Vrubel and X. Hu, Chem. Sci., 2011, 2, 1262 RSC
.
- Z. Pu, Q. Liu, A. M. Asiri, A. Y. Obaid and X. Sun, J. Power Sources, 2014, 263, 181 CrossRef CAS
.
- J. Lin, Z. Peng, G. Wang, D. Zakhidov, E. Larios, M. J. Yacaman and J. M. Tour, Adv. Energy Mater., 2014, 4, 1614 Search PubMed
.
- M. Zou, J. Zhang, H. Zhu, M. Du, Q. Wang, M. Zhang and X. Zhang, J. Mater. Chem. A, 2015, 3, 12149 CAS
.
- Q. Liu, J. Shi, J. Hu, A. M. Asiri, Y. Luo and X. Sun, ACS Appl. Mater. Interfaces, 2015, 7, 3877 CAS
.
- Q. Gong, L. Cheng, C. Liu, M. Zhang, Q. Feng, H. Ye, M. Zeng, L. Xie, Z. Liu and Y. Li, ACS Catal., 2015, 5, 2213 CrossRef CAS
.
- L. Tian, X. Yan and X. Chen, ACS Catal., 2016, 6, 5441 CrossRef
.
Footnote |
| † Electronic supplementary information (ESI) available. See DOI: 10.1039/c6se00058d |
| This journal is © The Royal Society of Chemistry 2017 |

