 Open Access Article
Creative Commons Attribution 3.0 Unported Licence
Flow of wormlike micellar solutions around microfluidic cylinders with high aspect ratio and low blockage ratio†
Simon J.
Haward
 *a,
Naoyuki
Kitajima
b,
Kazumi
Toda-Peters
a,
Tsutomu
Takahashi
b and
Amy Q.
Shen
 a
a
aMicro/Bio/Nanofluidics Unit, Okinawa Institute of Science and Technology, Onna, Okinawa 904-0495, Japan. E-mail: simon.haward@oist.jp; Tel: +81 98 966 8289
bFaculty of Engineering, Nagaoka University of Technology, Nagaoka, Niigata 940-2188, Japan
First published on 18th January 2019
Abstract
We employ time-resolved flow velocimetry and birefringence imaging methods to study the flow of a well-characterized shear-banding wormlike micellar solution around a novel glass-fabricated microfluidic circular cylinder. In contrast with typical microfluidic cylinders, our geometry is characterized by a high aspect ratio α = H/W = 5 and a low blockage ratio β = 2r/W = 0.1, where H and W are the channel height and width, and the cylinder radius r = 20 μm. The small cylinder radius allows access up to very high Weissenberg numbers 1.9 ≤ Wi = λMU/r ≤ 3750 (where λM is the Maxwell relaxation time) while inertial effects remain entirely negligible (Reynolds number, Re < 10−4). At low Wi values, the flow remains steady and symmetric and a birefringent region (indicating micellar alignment and tensile stress) develops downstream of the cylinder. Above a critical value Wic ≈ 60 the flow transitions to a steady asymmetric state, characterized as a supercritical pitchfork bifurcation, in which the fluid takes a preferential path around one side of the cylinder. At a second critical value Wic2 ≈ 130, the flow becomes time-dependent, with a characteristic frequency f0 ≈ 1/λM. This initial transition to time dependence has characteristics of a subcritical Hopf bifurcation. Power spectra of the measured fluctuations become complex as Wi is increased further, showing a gradual slowing down of the dynamics and emergence of harmonics. A final transition at very high Wic3 corresponds to the re-emergence of a single peak in the power spectrum but at much higher frequency. We discuss this in terms of possible flow-induced breakage of micelles into shorter species with a faster relaxation time.
1 Introduction
In an aqueous solution above a critical micelle concentration, amphiphilic surfactant molecules spontaneously self-assemble into large aggregates known as micelles, organized so as to shield their hydrophobic tails from water.1 A wide variety of micelle morphologies are possible, depending on environmental conditions such as temperature, pH, concentration, salinity, and also on factors such as the surfactant packing parameter and flow conditions. For solutions of ionic surfactants such as cetyl pyridinium chloride (CPyCl), the combination with a strongly binding counterion (or co-surfactant) such as sodium salicylate (NaSal), leads to a transition from spherical micelles at low concentration through rodlike and eventually to giant wormlike micelles as the surfactant concentration is increased.2–4 Wormlike micelles (WLMs) are elongated, semi-flexible cylindrical aggregates, which similarly to polymer chains, impart elastic properties to their solutions, rendering the bulk fluid “viscoelastic”.5–7 However, unlike polymers, WLMs exist in a dynamic equilibrium, undergoing constant scission and recombination. This provides stress relaxation mechanisms unavailable to polymer chains, allows the possibility of morphological changes (e.g. micellar concatenation, or gel formation) to be caused by flow (referred to in general as flow-induced structures), and further means that bulk viscoelastic properties can recover subsequent to micellar degradation that can occur in strong flows. Their particular and highly tunable properties make wormlike micellar solutions extremely useful in a wide variety of industrial applications, as drag-reduction agents, in oilfield applications and also as rheology modifying additives in many household products.2–4,8–15 Given their widespread applications, gaining a thorough understanding of the behaviour of this imprortant class of fluids under different regimes of flow is of considerable importance.Flow around a cylinder is considered as a benchmark system for studying the dynamics of viscoelastic fluids.16–25 The flow field around a cylinder confined between two walls provides an interesting mix of shearing and extensional kinematics. The leading axial stagnation point upstream of the cylinder causes a compressional flow and divergence of streamlines around the sides of the cylinder. There are regions of transient elongational flow as fluid is accelerated into the gaps between the cylinder and the side walls. In these gaps the shear rate can be high relative to the bulk. Downstream of the cylinder, in the locality of the trailing axial stagnation point, fluid is subjected to high extensional rates and residence times.26–28 Flow around a cylinder can be considered as a two-dimensional (2D) representation of flow around a sphere, and by extension to flow around a canonical “object”, which is clearly relevant to understanding many situations (e.g. flow separation, particle suspension or sedimentation, and flow through porous beds). However, flow around a cylinder is far more convenient to study experimentally than a sphere since (1) it can be held stationary in a channel and studied under steady-state flow conditions, (2) the flow rate is more readily controllable, and (3) the planar nature of the flow is easier to visualize. 2D numerical simulation of flow around a cylinder is also much simpler and less computationally expensive than simulating the three-dimensional (3D) flow around a sphere. As such, the flow around a cylinder provides a convenient approach to test numerical solutions to constitutive equations against experimental results, with a variety of flow kinematics incorporated in a single geometry and with significant real-world relevance.
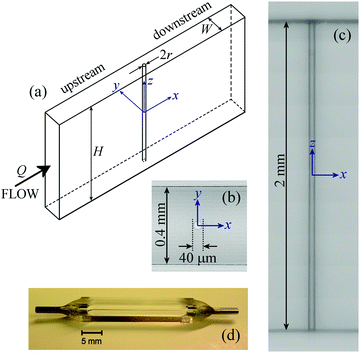
Geometrically, a cylinder of radius r confined inside a rectangular channel of height H and width W can be characterized by two ratios of lengthscales: (1) the aspect ratio of the channel α = H/W, and (2) the blockage ratio β = 2r/W. The aspect ratio of the cylinder itself is given by AR = H/2r = α/β, see schematic diagram presented in Fig. 1.
There are several previous experimental studies of wormlike micellar solutions flowing around macro-scale cylinders.29–31 Of particular interest, Moss and Rothstein30,31 used a combination of flow velocimetry, pressure drop measurements and flow-induced birefringence visualization to study the flow of two different wormlike micellar solutions around cylinders confined inside channels with H = W = 50 mm (α = 1) and with radii r = 2.5 and r = 5 mm (β = 0.1 and β = 0.2). The two micellar fluids were composed of 50 mM cetyltrimethyl ammonium bromide (CTAB) mixed with 50 mM NaSal, and 100 mM CPyCl mixed with 50 mM NaSal. For both fluids at low flow rates the flow around the cylinders was symmetric and steady. As the flow rate was increased, the appearance of birefringence (indicating micellar alignment and stress) around the cylinders and in an extended downstream wake was observed. For the CTAB/NaSal solution, the flow was found to become unstable above flow rates corresponding to a critical Weissenberg number Wic ≈ 4. Here, the Weissenberg number, which describes the relative importance of elastic to viscous forces in the flow, is defined by Wi = λMU/r, where U is the average velocity of the fluid in the channel, U/r describes a characteristic deformation rate around the cylinder and λM is the Maxwellian relaxation time of the fluid determined from its rheological response in linear oscillatory shear. The instability was manifested by asymmetry and motion of the stress birefringence in the downstream wake of the cylinder. Since inertial effects as characterized by the Reynolds number Re = ρUr/η (where ρ and η are the fluid density and viscosity, respectively) were low, and the flow destabilized above a critical Wi, the instability was considered as being elastic in origin. A growth of the stress followed by a sudden decay, considered to be due to micelle rupture, was reported, although the occurrence of rupture events was described as chaotic since no characteristic frequency for them was found. Such stress growth and micelle rupture in the downstream wake of the cylinder explains the unsteady settling of particles in wormlike micellar fluids,32–34 and confirms the importance of the strong extensional flow and high fluid strain in the wake for driving such phenomena. Dey et al. have recently shown how elastic instabilities caused by flow around a deformable elastic cylinder can feed back onto the cylinder itself, driving erratic motions of the structure, somewhat analogous to the vortex-induced-vibrations in high Re Newtonian flows around obstacles.35,36 We note that for Weissenberg numbers up to ≈10 (the maximum that could be achieved due to the scale of their experimental set up), Moss and Rothstein reported no elastic instability in the CPyCl/NaSal solution that they studied and the flow remained always steady and symmetric.30,31
Due to the small characteristic size scale (e.g. the cylinder radius), elastic forces can be considerably enhanced in micro-scale viscoelastic flows, in which extremely high Weissenberg numbers can be achieved while keeping the Reynolds number, and hence inertial forces, negligible. Microfluidic flow geometries thus provide ideal platforms for studying elastic instabilities and the non-linear dynamics arising from the feedback between flow-induced microstructural rearrangements and the flow field itself. Elastic instabilities are frequently manifested as asymmetries, where the fluid selects a preferential path through a geometrical configuration. A well studied example (with both viscoelastic polymer and WLM solutions) is the onset of asymmetric flow through the cross-slot geometry above a critical flow rate.37–44 Using the two-species Vasquez–Cook–McKinley (VCM) model for WLMs,45 that incorporates the possibility of chain halving and recombination into the constitutive equation, Kalb et al. have shown that micelle breakage rate has a significant impact on this phenomenon.43,44 WLMs that break more readily are less prone to instability.40,44
Flow of WLMs around micro-scale cylinders may be a relevant model for understanding, e.g. transport of proppant particles used in fracturing fluids and for flow around elements of microporous structures (frequently modelled by microfluidic post arrays) and in which elastic instabilities have been shown to play an important role.46–49 However, a drawback of most microfluidic cylinder experiments to date is that, due to typically employed fabrication techniques (such as soft lithography or micromilling), their geometries have been restricted to low aspect ratios (α < 1) and to high blockage ratios (typically β ≥ 0.5).50–55 The low aspect ratio means the flow field is strongly inhomogeneous along the cylinder axial direction. Perhaps more significantly, the high blockage ratio results in the formation of narrow gaps between the sides of the cylinder and the channel walls. In this case, viscoelastic fluids respond most strongly to the squeezing flow through the gaps, resulting in the generation of elastic instabilities and recirculations upstream of the cylinder.51,52,54 The similarity of such upstream recirculations with those seen for viscoelastic flows into simple abrupt or hyperbolic contractions,56–58 demonstrates that cylinder geometries with high values of β are really only examining the effects of the contractions and not of the cylinder per se. The effects of the stronger extensional flows in the up- and downstream wake regions, are significantly suppressed as a result. It is well-recognized that to clearly observe the extensional flow in the cylinder wake regions, the blockage ratio should be much lower than β = 0.5,59 but this is difficult to achieve at the microfluidic scale using mainstream microfabrication methods.
In a recent work, we used selective laser-induced etching (SLE)60 to fabricate glass microfluidic cylinder devices (r = 20 μm) in a new geometrical regime featuring both a high aspect ratio α = 5 and a low blockage ratio β = 0.1.61 We used the devices to study the steady viscoelastic flow of dilute polymer solutions, clearly demonstrating the enhancement of elastic effects visible in the cylinder wakes.61 In the present work, we employ one of the same devices to examine the flow of a well-studied wormlike micellar system composed of CPyCl and NaSal. The flow field around the cylinder is characterized in detail using time-resolved micro-particle image velocimetry (μ-PIV) and we also make time-resolved flow birefringence measurements using a state-of-the-art high-speed polarization camera. As the Weissenberg number is increased for negligible Reynolds number ≪ 1, we observe a rich progression of flow instabilities manifested in the downstream wake, beginning with a steady flow asymmetry that develops spatio-temporal fluctuations at higher Wi and that are evident in both the flow field and the birefringence imaging. In contrast to the work of Moss and Rothstein using a CTAB/NaSal solution,30,31 spectral analysis reveals specific characteristic frequencies for the fluctuations, that vary with the Wi in a complex way. We discuss these effects in terms of micellar structural transitions caused by the flow.
2 Experimental methods
2.1 Microchannel design and fabrication
The microfluidic cylinder device used in this study is represented schematically in Fig. 1a and photographically in Fig. 1b–d. The device was fabricated by SLE in fused silica glass using a “LightFab” 3D printer (LightFab GmbH, Germany).62 The SLE fabrication is a two-step process: firstly, the shape of the channel is written within an initially solid block of fused silica by irradiation with a femtosecond laser, and secondly, the irradiated material is preferentially removed by ultrasonication at 80 °C in a wet chemical etchant (KOH). The volume occupied by the cylinder is simply not irradiated during the laser writing step and is left behind within the channel following the chemical etching step, resulting in a monolithic glass construction. The device fabrication is completed by simply bonding stainless steel tubing connectors to the inlet and outlet to the glass channel using 2-part epoxy, see Fig. 1(d). The channel has inner dimensions of W = 400 μm and H = 2 mm. This provides a relatively high aspect ratio α = 5, and hence a good approximation to a two dimensional flow, which was confirmed in our earlier study.61 The total channel length is 25 mm and the cylinder is located half way along it. The cylinder radius is r = 20 μm, which provides a low blockage ratio β = 0.1 and a cylinder aspect ratio AR = 50. Due to the high modulus of fused silica (≈75 GPa), the cylinder can be made so long and slender without deforming under an imposed flow. Even at the high magnifications used in the visualization experiments to be described in the following sections, and at the highest imposed flow rates, there was no observable deflection of the cylinder. As can be seen from Fig. 1b–d, the completely transparent glass construction provides useful optical access to both the xy and xz planes, which allows a detailed characterization of the flow.2.2 Materials
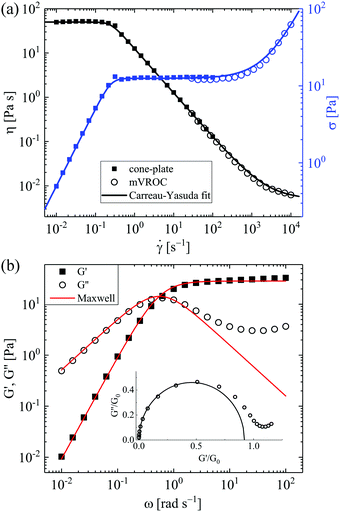
The wormlike micellar test solution used in this study is composed of 100 mM CPyCl and 60 mM NaSal (both supplied by Sigma Aldrich) dissolved in deionised water. This is a well-studied surfactant/counterion system known to form giant wormlike micelles at the selected concentrations.3,6 The solution was prepared by adding weighed quantities of the CPyCl and NaSal powders to the appropriate volume of deionised water and stirring the mixture vigorously for three days. The fluid was then allowed to equilibrate at room temperature in dry, unlit conditions for ten days prior to experimentation.The steady shear rheology of the test solution was measured at 24 °C (the same temperature as subsequent experiments around the microfluidic cylinder) using a DHR3 stress-controlled rotational rheometer (TA Instruments Inc.) fitted with a 40 mm diameter 1° stainless steel cone-and-plate fixture. In order to access higher shear rates, additional measurements were carried out using an m-VROC microfluidic slit rheometer (Rheosense Inc.) fitted with a 3 mm wide, 50 μm deep chip with flush-mounted 40 kPa full-scale pressure sensors.63 The results of these measurements are presented in Fig. 2a in the form of both viscosity η and shear stress σ as a function of the applied shear rate ![[small gamma, Greek, dot above]](https://www.rsc.org/images/entities/i_char_e0a2.gif) . The flow curve shows the typical features expected for this WLM fluid formulation.41,64,65 A constant viscosity (η ≈ 50 Pa s) is observed at low shear rates (
. The flow curve shows the typical features expected for this WLM fluid formulation.41,64,65 A constant viscosity (η ≈ 50 Pa s) is observed at low shear rates (![[small gamma, Greek, dot above]](https://www.rsc.org/images/entities/i_char_e0a2.gif) ≲ 0.2 s−1) followed by a rapid transition to a stress-plateau region where the viscosity thins with a power-law index n ≈ 0. The stress-plateau, indicative of shear-banding,66,67 spans around 3 decades in shear rate, before the stress begins to increase with shear rate according to σ ∼
≲ 0.2 s−1) followed by a rapid transition to a stress-plateau region where the viscosity thins with a power-law index n ≈ 0. The stress-plateau, indicative of shear-banding,66,67 spans around 3 decades in shear rate, before the stress begins to increase with shear rate according to σ ∼ ![[small gamma, Greek, dot above]](https://www.rsc.org/images/entities/i_char_e0a2.gif) 0.75 for
0.75 for ![[small gamma, Greek, dot above]](https://www.rsc.org/images/entities/i_char_e0a2.gif) ≳ 2000 s−1. The steady shear rheology is well described by the Carreau–Yasuda generalized Newtonian fluid (GNF) model,68 as shown by the solid lines in Fig. 2a:
≳ 2000 s−1. The steady shear rheology is well described by the Carreau–Yasuda generalized Newtonian fluid (GNF) model,68 as shown by the solid lines in Fig. 2a:
 | (1) |
![[small gamma, Greek, dot above]](https://www.rsc.org/images/entities/i_char_e0a2.gif) * is the characteristic shear rate for the onset of shear-thinning, n is the power-law exponent in the shear-thinning region and a is a dimensionless fitting parameter that controls the rate of the transition between the constant viscosity and the shear-thinning regions. Values for all of these parameters are provided in Table 1. This GNF model accurately describes the shear-thinning behaviour, but makes no account for fluid viscoelasticity, therefore its applicability is restricted. Nevertheless, this simple model can be used to predict fully developed velocity profiles, and to provide values for the characteristic viscosity of the fluid at arbitrary shear rates applied in the microfluidic channel.
* is the characteristic shear rate for the onset of shear-thinning, n is the power-law exponent in the shear-thinning region and a is a dimensionless fitting parameter that controls the rate of the transition between the constant viscosity and the shear-thinning regions. Values for all of these parameters are provided in Table 1. This GNF model accurately describes the shear-thinning behaviour, but makes no account for fluid viscoelasticity, therefore its applicability is restricted. Nevertheless, this simple model can be used to predict fully developed velocity profiles, and to provide values for the characteristic viscosity of the fluid at arbitrary shear rates applied in the microfluidic channel.
| η 0 [Pa s] | η ∞ [mPa s] |
![[small gamma, Greek, dot above]](https://www.rsc.org/images/entities/i_char_e0a2.gif) * [s−1] * [s−1] |
n | a | λ M [s] | G 0 [Pa] |
|---|---|---|---|---|---|---|
| 50 | 5 | 0.25 | 0 | 4 | 1.8 | 28.5 |
The storage and loss moduli, G′ and G′′ of the WLM test solution were determined by small angle oscillatory shear (SAOS) measurements made at 24 °C on the DHR3 rheometer with the 40 mm diameter 1° cone-and-plate oscillating over a range of angular frequency 0.01 ≤ ω ≤ 100 rad s−1 and with a 5% strain. Strain amplitude sweeps were carried out in order to ensure that a 5% strain was within the linear region over the full range of ω. The results of the SAOS measurements are presented in Fig. 2b, and are well-described over most of the frequency range using a simple single mode Maxwell model:
 | (2) |
The rheological response of viscoelastic fluids to extensional flows can be characterized from measurements of the necking rate of liquid bridges in the so-called “elasto-capillary” thinning regime.72,73 Such measurements are commonly performed using the commercially available capillary breakup extensional rheometer (CaBER, Thermo Haake), in which fluid is loaded between two circular end plates which are subsequently separated by a distance sufficient to initiate capillary-driven thinning. However, it has been shown that with CPyCl/NaSal WLM solutions the thinning dynamics are sensitive to the imposed experimental conditions (i.e. plate diameter, initial and final plate separation and also the rate of plate separation).74 Consequently, CaBER results for WLM solutions may not be entirely reliable, although experiments performed under typically employed conditions provide extensional relaxation times close to those obtained from linear oscillations in shear and also evidence a significant degree of strain hardening, with the extensional viscosity reaching ηE ≈ 10 to 100 × η0 at high strains.40,41,74
2.3 Flow control and dimensionless groups
The flow in the rectangular microchannel is driven at controlled volumetric flow rate Q using two Nemesys low-pressure syringe pumps (Cetoni GmbH), one infusing at the inlet and the second withdrawing at an equal and opposite rate from the outlet. The average flow velocity inside the channel is then U = Q/(WH). The dimensionless Reynolds number decribes the relative importance of inertial to viscous forces in a flow. For flow around the cylinder we define the Reynolds number as: | (3) |
A nominal deformation rate for the flow around a cylinder can be defined ![[small epsi, Greek, dot above]](https://www.rsc.org/images/entities/i_char_e0a1.gif) = U/r. On this basis, we define the dimensionless Weissenberg number for the flow, which describes the relative importance of elastic to viscous forces, as:
= U/r. On this basis, we define the dimensionless Weissenberg number for the flow, which describes the relative importance of elastic to viscous forces, as:
 | (4) |
An elasticity number can be defined as El = Wi/Re, thus describing the relative importance of elasticity and inertia. The elasticity number is independent of the imposed flow conditions, depending only on the fluid properties and the geometry. Due to the high fluid viscosity and long relaxation time of the WLM solution and the microscopic cylinder radius, the elasticity number of our experiment is very high (El ≈ 2 × 10⁸), indicating that elastic forces completely dominate over inertia.
2.4 Flow visualizations
![[small script l]](https://www.rsc.org/images/entities/char_e146.gif) , where
, where ![[small script l]](https://www.rsc.org/images/entities/char_e146.gif) is the pathlength through the birefringent material.76,77 In this paper we report the measured values of the retardation and we do not make a conversion to birefringence by assuming a value for
is the pathlength through the birefringent material.76,77 In this paper we report the measured values of the retardation and we do not make a conversion to birefringence by assuming a value for ![[small script l]](https://www.rsc.org/images/entities/char_e146.gif) . Images are captured at 125 Hz and have a spatial resolution of ≈3.6 μm per pixel.
. Images are captured at 125 Hz and have a spatial resolution of ≈3.6 μm per pixel.
3 Results and discussion
3.1 Preliminary control experiments
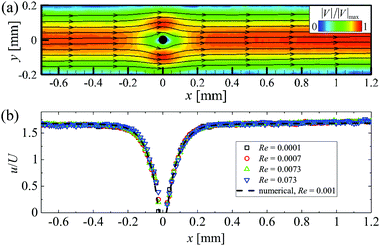
Before examining the flow of the WLM solution around the microfluidic cylinder, control experiments were made in order to check the nature of the Newtonian flow field around the cylinder. Fig. 3a shows the normalized Newtonian velocity magnitude field (|V|/|V|max, where ) around the cylinder as measured in the z = 0 plane at a low Reynolds number Re = 0.007. The flow is clearly symmetric about y = 0 and about x = 0, as expected for Newtonian flow at low Re. Fig. 3b shows profiles of the normalized streamwise velocity (u/U) taken along the line y = 0 for a range of Re. The experimental data is compared with the prediction of a 3D finite volume numerical simulation performed using ANSYS Fluent. For this we simulated the flow in a section of channel 6.5 mm in length with the cylinder located 4.5 mm downstream of the inlet. A uniform velocity profile was applied at the inlet, a constant pressure boundary condition was applied at the outlet and a no-slip condition was applied at all solid boundaries in the flow. The simulation volume was divided into 5
![[thin space (1/6-em)]](https://www.rsc.org/images/entities/char_2009.gif) 286
286![[thin space (1/6-em)]](https://www.rsc.org/images/entities/char_2009.gif) 526 cells with a minimum cell size of 0.0012 mm and the Navier–Stokes equations were solved using the semi-implicit method for pressure-linked equations (SIMPLE) algorithm. We ensured that flow was fully developed upstream of the cylinder and that flow profiles were independent of further mesh refinement. The good agreement between the numerical simulation and the experimental results provides confirmation that the microchannel is of good quality and that our experimental measurement protocols are sound.
526 cells with a minimum cell size of 0.0012 mm and the Navier–Stokes equations were solved using the semi-implicit method for pressure-linked equations (SIMPLE) algorithm. We ensured that flow was fully developed upstream of the cylinder and that flow profiles were independent of further mesh refinement. The good agreement between the numerical simulation and the experimental results provides confirmation that the microchannel is of good quality and that our experimental measurement protocols are sound.
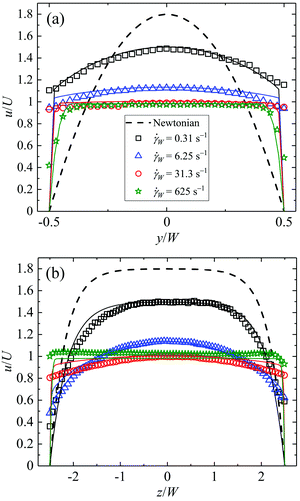
In addition, we measured the flow field in the channel upstream of the cylinder using both Newtonian and WLM fluid, see Fig. 4. At the low Re of our experiments, the Newtonian flow profiles through both the channel width and depth are independent of the flow rate and match the infinite series analytical solution given by Shah and London,61,78 which is shown by the dashed black curves. For Newtonian fluid, the fully-developed flow profile is parabolic across the channel width (Fig. 4a), but is more uniform through the channel depth (Fig. 4b), as expected for a channel of this high aspect ratio, α = 5.
For the shear-banding WLM solution, the measured velocity profiles depend strongly upon the imposed flow rate. In Fig. 4 we present examples for a few different values of the nominal wall shear rate ![[small gamma, Greek, dot above]](https://www.rsc.org/images/entities/i_char_e0a2.gif) W = 6U/W, spanning the range of flow rates used in the experiments around the cylinder. At the lowest wall shear rate
W = 6U/W, spanning the range of flow rates used in the experiments around the cylinder. At the lowest wall shear rate ![[small gamma, Greek, dot above]](https://www.rsc.org/images/entities/i_char_e0a2.gif) W = 0.31 s−1 (black squares), the flow profile across the channel width is significantly flattened compared with the Newtonian case, while through the depth the profile remains Newtonian-like in shape. As the wall shear rate is increased there is a general trend towards more pluglike flow through both the width and the depth directions. This is expected due to the localization of shear (or formation of shear bands) at the channel walls.41,65,79–81 We note the appearance of possible wall slip in some cases, however we cannot confirm this confidently from these results since the spacing of vectors precludes resolution arbitrarily close to the wall. Further, the solid lines (coloured according to the corresponding experimental data points) show the results of numerical predictions of the velocity profiles. These were computed using a time-marching scheme to numerically solve the transient Stokes equation, taking the Carreau–Yasuda GNF model as the constitutive equation for the shear-rate-dependent viscosity and assuming a no-slip boundary condition at the walls. In general the shape of the flow profile is predicted quite well by this simple model. We do not observe the occurrence of localized high velocity “jets” of fluid developing through the channel depth that have been reported by some authors for flows of WLM solutions in high aspect ratio rectangular channels.82,83
W = 0.31 s−1 (black squares), the flow profile across the channel width is significantly flattened compared with the Newtonian case, while through the depth the profile remains Newtonian-like in shape. As the wall shear rate is increased there is a general trend towards more pluglike flow through both the width and the depth directions. This is expected due to the localization of shear (or formation of shear bands) at the channel walls.41,65,79–81 We note the appearance of possible wall slip in some cases, however we cannot confirm this confidently from these results since the spacing of vectors precludes resolution arbitrarily close to the wall. Further, the solid lines (coloured according to the corresponding experimental data points) show the results of numerical predictions of the velocity profiles. These were computed using a time-marching scheme to numerically solve the transient Stokes equation, taking the Carreau–Yasuda GNF model as the constitutive equation for the shear-rate-dependent viscosity and assuming a no-slip boundary condition at the walls. In general the shape of the flow profile is predicted quite well by this simple model. We do not observe the occurrence of localized high velocity “jets” of fluid developing through the channel depth that have been reported by some authors for flows of WLM solutions in high aspect ratio rectangular channels.82,83
3.2 Wormlike micellar flow around the cylinder
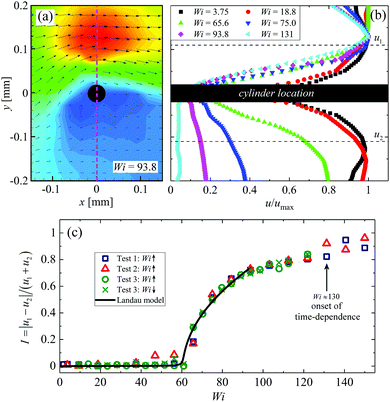
For the flow of the shear-banding wormlike micellar solution around the cylinder, we observe a complex sequence of flow transitions as the Weissenberg number is increased. Examples of time averaged flow velocimetry and FIB imaging results, broadly illustrating the nature of the flow over the range of imposed Wi are presented in Fig. 5. At low Wi = 3.75 (Fig. 5a), the flow is steady and symmetric about y = 0. The flow field contrasts with that of a Newtonian fluid (shown in Fig. 3a) due to the shear localization at the channel walls and the more pluglike flow profile. A weak birefringent signal is detected in a wide region around the cylinder, with a relatively intense signal measured in the immediate downstream wake. As the Weissenberg number is incremented, the flow remains steady and symmetric, and the FIB signal becomes more intense with an extended wake developing downstream of the cylinder (e.g.Fig. 5b, Wi = 37.5). The region of high birefringence indicates localized micellar alignment and tensile stress and has a qualitatively similar form to the birefringence reported by Moss and Rothstein for the steady symmetric flow of a similar WLM fluid around a macroscale cylinder.31 As the Weissenberg number is incremented further (e.g.Fig. 5c, Wi = 93.8), a clear asymmetry becomes apparent in the flow field, with the fluid taking a preferential path around one side of the cylinder. In the example shown, the flow is faster for y > 0 than for y < 0, but it is important to note that this asymmetry has also been observed to develop in the opposite sense, with the direction being selected seemingly at random. As the Weissenberg number is increased to Wi = 150 and beyond (see Fig. 5d and e), the degree of flow asymmetry increases, with virtually all of the fluid passing the cylinder for y > 0 and the development of an effectively stagnant region on the opposite side of the cylinder. The asymmetry is also evident in the birefringence downstream of the cylinder, which is progressively shifted towards the channel side wall at y = −0.2 mm.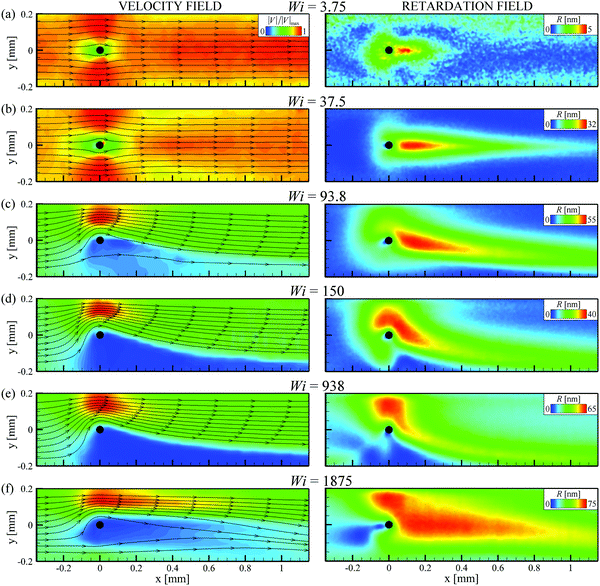 | ||
| Fig. 5 Time-averaged velocity fields (left column) and corresponding time-averaged retardation fields (right column) in the x–y plane (focus at z = 0) for the wormlike micellar solution flowing around the cylinder at the Wi indicated (the Reynolds number is always negligible Re < 10−4). Unsteadiness is apparent in both the velocity and retardation fields for Wi ≳ 130 see accompanying movies provided in the ESI.† | ||
The asymmetry shown in Fig. 5c–e contrasts significantly with flow patterns reported previously for WLM solutions in microscale cylinder geometries with higher blockage ratios.53,54 Such asymmetry in the flow was also not reported by Moss and Rothstein for a similar CPyCl/NaSal WLM fluid in a macroscale cylinder device of similar blockage ratio, however their experiments were restricted to Wi ≲ 10 due to limitations conferred by the scale of their setup.31 Similar-looking flow asymmetries were recently reported for the flow of a CTAB-based WLM fluid around a flexible macroscale cylinder and were attributed to the off-center displacement of the cylinder in the flow.36 However in the present experiment the cylinder is considered effectively rigid since no deflection of the cylinder is detectable at the magnifications employed in the experiments. Indeed, our best estimates of the deflection of the cylinder at its midpoint Δxmax, based on the solution to the Euler–Bernouli equation for a circular cylinder with two pinned ends and estimates of the force per unit length on the cylinder, indicate Δxmax ∼ O(1 μm), which is on the same scale as the cylinder surface roughness.
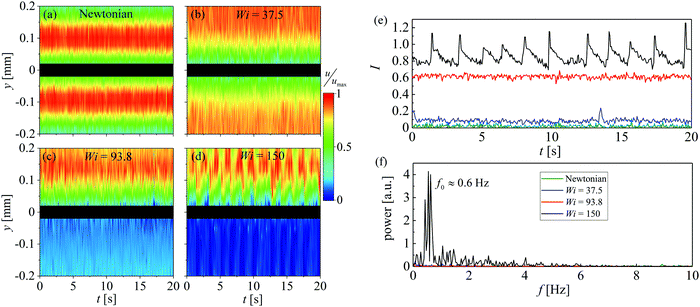
At the highest Weissenberg numbers examined in our experiments (see e.g.Fig. 5f for Wi = 1875), we observe that the flow field starts to recover some symmetry. This re-symmetrization, though not complete, is accompanied by a significant increase in the magnitude of the birefringence downstream of the cylinder. It is important to note that for Wi ≳ 130 time-dependence is evident in both the flow field and the birefringence. Representative movies to demonstrate these spatio-temporal fluctuations at higher values of the Weissenberg number are included in the ESI.† In the ESI,† we also present a similar sequence of time-averaged velocity and retardation fields as shown in Fig. 5 but viewed in the orthogonal (x, z) plane.†
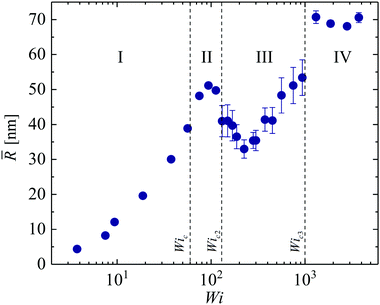
![[R with combining macron]](https://www.rsc.org/images/entities/i_char_0052_0304.gif) as a function of the imposed Wi, where the error bars represent a standard deviation about the mean. We observe transitions through four broad regimes of flow as the Weissenberg number is increased. At lower Wi, there is a regime (I) in which the birefringence increases steadily and monotonically with increasing Wi, and the standard deviation is low (error bars are smaller than the data points). Regime I corresponds to steady symmetric flow around the cylinder. As the curve passes through an inflection point at Wic ≈ 60, regime II corresponds to the steady flow asymmetry. In regime II, the mean birefringence in the wake tends towards a local maximum value while the standard deviation remains low since the flow remains steady. Regime II ends abruptly as the flow becomes time-dependent in regime III at Wic2 ≈ 130. Here, error bars are large due to the significant fluctuations and the mean birefringence in the wake initially decreases, then increases with the imposed Wi. Finally, at Wic3 ≈ 1000 a third transition to regime IV is marked by a distinct jump in the mean birefringence and a reduction in the standard deviation of the fluctuations. Regime IV corresponds to the re-symmetrization of the flow as depicted in Fig. 5f.
as a function of the imposed Wi, where the error bars represent a standard deviation about the mean. We observe transitions through four broad regimes of flow as the Weissenberg number is increased. At lower Wi, there is a regime (I) in which the birefringence increases steadily and monotonically with increasing Wi, and the standard deviation is low (error bars are smaller than the data points). Regime I corresponds to steady symmetric flow around the cylinder. As the curve passes through an inflection point at Wic ≈ 60, regime II corresponds to the steady flow asymmetry. In regime II, the mean birefringence in the wake tends towards a local maximum value while the standard deviation remains low since the flow remains steady. Regime II ends abruptly as the flow becomes time-dependent in regime III at Wic2 ≈ 130. Here, error bars are large due to the significant fluctuations and the mean birefringence in the wake initially decreases, then increases with the imposed Wi. Finally, at Wic3 ≈ 1000 a third transition to regime IV is marked by a distinct jump in the mean birefringence and a reduction in the standard deviation of the fluctuations. Regime IV corresponds to the re-symmetrization of the flow as depicted in Fig. 5f.
 | (5) |
For lower Weissenberg numbers u1 = u2 and hence I = 0. However, as the Weissenberg number exceeds a critical value Wic and the flow around the cylinder becomes unbalanced, u1 ≠ u2 and hence I increases, see Fig. 7c. Close to the transition, the growth of the asymmetry parameter with Wi is well described by a simple Landau-type quartic potential minimized as:
| Wi = Wic[gI2 + hI−1 + 1], | (6) |
The root cause of the flow asymmetry remains uncertain, but one possibility is that it develops from an initially random sideways fluctuation of the highly-stressed downstream birefringent wake. Due to the enhanced extensional viscosity in the wake, we propose that such a fluctuation would cause an (initially small) imbalance between the flow resistance around either side of the cylinder, forcing the fluid to prefer the least resistant path. If this occurs while the shear rate on either side of the cylinder is in the shear-thinning region of the flow curve, where n ≈ 0, the resulting mismatch between the fluid viscosity on either side of the cylinder would consolidate the imbalance in flow resistance and maintain the asymmetry. Further increases in Wi would then cause the instability to grow as the viscosity mismatch increases. At the critical Weissenberg number Wic = 61 the average shear rate in the fluid either side of the cylinder is ![[small gamma, Greek, dot above]](https://www.rsc.org/images/entities/i_char_e0a2.gif) side ≈17 s−1, which is firmly in the stress-plateau region (see Fig. 2a), providing some support to our conjecture. In principle, this hypothesis could be tested using devices with even lower blockage ratios, which would give access to the same range of Wi, allowing the downstream birefringence to develop, while maintaining
side ≈17 s−1, which is firmly in the stress-plateau region (see Fig. 2a), providing some support to our conjecture. In principle, this hypothesis could be tested using devices with even lower blockage ratios, which would give access to the same range of Wi, allowing the downstream birefringence to develop, while maintaining ![[small gamma, Greek, dot above]](https://www.rsc.org/images/entities/i_char_e0a2.gif) side <
side < ![[small gamma, Greek, dot above]](https://www.rsc.org/images/entities/i_char_e0a2.gif) *. However, calculations indicate that given the same WLM test fluid as used here, a blockage ratio β < 0.002 would be required to achieve such a scenario, which would present a significant technical challenge in terms of device fabrication. Insight could also be gained by comparing the responses of non-shear thinning viscoelastic (Boger) fluids with shear thinning but relatively inelastic fluids such as xanthan gum solutions, for example. The importance of micelle breakage and reformation could perhaps be understood by contrasting the responses of two structurally similar polymers such as ethyl hydroxy–ethyl cellulose (EHEC), which does not self-assemble in solution, and its hydrophobically modified analogue (hmEHEC), which is micelle forming.84
*. However, calculations indicate that given the same WLM test fluid as used here, a blockage ratio β < 0.002 would be required to achieve such a scenario, which would present a significant technical challenge in terms of device fabrication. Insight could also be gained by comparing the responses of non-shear thinning viscoelastic (Boger) fluids with shear thinning but relatively inelastic fluids such as xanthan gum solutions, for example. The importance of micelle breakage and reformation could perhaps be understood by contrasting the responses of two structurally similar polymers such as ethyl hydroxy–ethyl cellulose (EHEC), which does not self-assemble in solution, and its hydrophobically modified analogue (hmEHEC), which is micelle forming.84
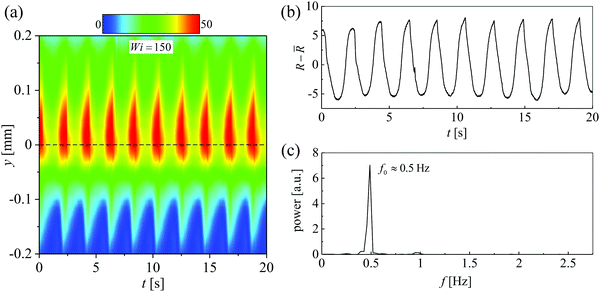
Time dependence in the birefringence measurements also show characteristic frequencies similar to those obtained from the μ-PIV. As illustrated in Fig. 9a and b, we extract a time-resolved retardation signal R(t) from the location (x, y) = (0.1 mm, 0 mm) and subtract the time-averaged value ![[R with combining macron]](https://www.rsc.org/images/entities/i_char_0052_0304.gif) . The signal appears highly sinusoidal, though we note a sudden cut off on some of the peaks that is reminiscent of the slow build up and subsequent rupture of stress, as reported previously for related kinds of flows.23,30,31,35,36,85 This suggests that a periodic breakage and reformation of micelles in the highly stressed birefringent region plays an important role in driving the flow to become time dependent. The birefringent signal shown in Fig. 9b results in a power spectrum with a clear single peak at a frequency f0 ≈ 0.5 Hz (Fig. 9c), close to that determined from the velocimetry data at the same Wi = 150 near the onset of time dependence.
. The signal appears highly sinusoidal, though we note a sudden cut off on some of the peaks that is reminiscent of the slow build up and subsequent rupture of stress, as reported previously for related kinds of flows.23,30,31,35,36,85 This suggests that a periodic breakage and reformation of micelles in the highly stressed birefringent region plays an important role in driving the flow to become time dependent. The birefringent signal shown in Fig. 9b results in a power spectrum with a clear single peak at a frequency f0 ≈ 0.5 Hz (Fig. 9c), close to that determined from the velocimetry data at the same Wi = 150 near the onset of time dependence.
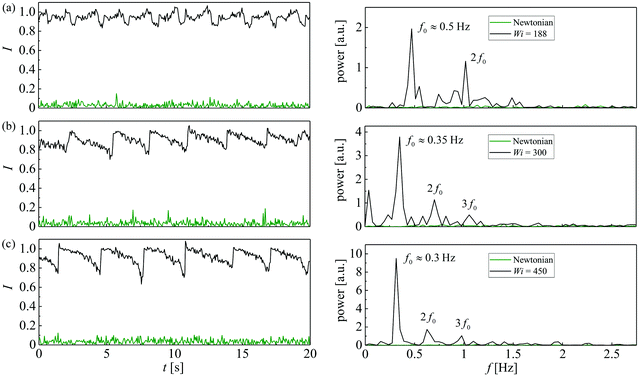
As the Weissenberg number is increased, we observe changes in the form of the temporal fluctuations in I and their power spectra (see Fig. 10a–c at Wi = 188, 375 and 450, respectively). In contrast to the time-dependence exhibited in Fig. 8e, at progressively higher Wi the asymmetry parameter appears to settle towards a value I ≈ 1 with periodic downward spikes to increasingly lower asymmetry. In the corresponding PSDs, we observe a gradual shift of the fundamental frequency to a lower value f0 ≈ 0.3 Hz (i.e. a kind of gradual period doubling transition) and the emergence of higher harmonics.
With increasing Wi, changes are also evident in the fluctuations observed in the retardation signal (see Fig. 11a for Wi = 938). Here we observe a generally rather low level of birefringence behind the cylinder, with periodic spikes to higher intensities. The intense peaks in the birefringence correspond approximately to the spikes of low asymmetry seen in the I(t) traces (such as in Fig. 10c, for example). As the asymmetry returns to a value I ≈ 1 subsequent to a downward spike, the birefringence slowly relaxes back to a low intensity. Similar to the I(t) traces in Fig. 10, the time-dependent birefringence signal at Wi = 938 also results in a complex PSD exhibiting harmonics, as illustrated in Fig. 11b.
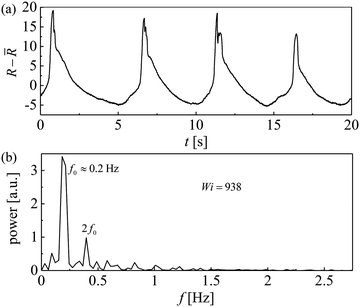 | ||
| Fig. 11 (a) Time-resolved retardation signals extracted at (x, y) = (0.1 mm, 0 mm) and, (b) corresponding power spectra of the fluctuations for Wi = 938. | ||
It is worth further clarifying the connection between the time-resolved asymmetry parameter and retardation signals under flow conditions approaching the onset of regime IV. The dynamics of these flows seem to result from the periodic accumulation and rinsing of the almost stagnant fluid located on one side of the cylinder (to negative y as depicted in the figures in this paper). As mentioned, the spike in birefringence correlates to a sudden reduction in the flow asymmetry parameter, which occurs as the stagnant fluid is suddenly washed downstream. Following this spike, the region of stagnant fluid re-establishes at negative y, once again forcing nearly all of the fluid to flow around the opposite side of the cylinder (i.e. to positive y). As a result, the geometry is effectively transformed into a 2![[thin space (1/6-em)]](https://www.rsc.org/images/entities/char_2009.gif) :
:![[thin space (1/6-em)]](https://www.rsc.org/images/entities/char_2009.gif) 1 asymmetric contraction. Rather than being due to the strong stagnation point extensional flow in the cylinder wake, the micellar alignment and stress in the fluid is now largely generated by the relatively weak squeezing flow between the cylinder and the channel side wall at y = 0.2 mm. Downstream of the cylinder, the birefringence is only maintained by the shear along the streamline dividing the stagnant and the flowing regions. Consequently, the downstream birefringence relaxes over time. Periodically (presumably due to a build up of pressure upstream), the stagnant accumulated material at negative y is swept away again and travels downstream; the asymmetry parameter displays a negative spike and the birefringence intensity increases dramatically as the fluid is (momentarily) subjected to the stagnation point.
1 asymmetric contraction. Rather than being due to the strong stagnation point extensional flow in the cylinder wake, the micellar alignment and stress in the fluid is now largely generated by the relatively weak squeezing flow between the cylinder and the channel side wall at y = 0.2 mm. Downstream of the cylinder, the birefringence is only maintained by the shear along the streamline dividing the stagnant and the flowing regions. Consequently, the downstream birefringence relaxes over time. Periodically (presumably due to a build up of pressure upstream), the stagnant accumulated material at negative y is swept away again and travels downstream; the asymmetry parameter displays a negative spike and the birefringence intensity increases dramatically as the fluid is (momentarily) subjected to the stagnation point.
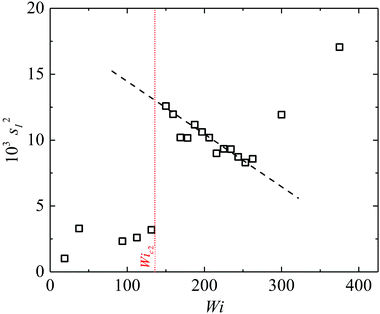
The appearance of a single characteristic peak in the power spectrum above Wic2 is potentially characteristic of a Hopf bifurcation, which have been observed previously in complex viscoelastic flows of polymer solutions through axisymmetric contractions.86,87 In an attempt to confirm this we examine the standard deviations of the fluctuations in the asymmetry parameter (sI), which are proportional to the amplitude of the fluctuations. In Fig. 12, we show sI2 as a function of the imposed Wi. At low Wi, fluctuations are small and sI2 is close to zero. At Wi = Wic2, the flow becomes time dependent and the amplitude of the fluctuations becomes suddenly large. Close to the transition, sI2 decays linearly with increasing Wi, which is characteristic of a subcritical (or backwards) Hopf bifurcation.88 This contrasts with earlier studies on the non-linear dynamics of polymer solutions in complex flows, for which transitions to time-dependent flows were characterized as supercritical Hopf bifurcations.86,87 The increase in sI2 observed in Fig. 12 for Wi ≳ 300 likely results from the onset of more complex dynamics, i.e. the presence of harmonics, as discussed above.
The progression of behaviour so far in the present experiments for 1.9 < Wi ≲ 1000 has quite strong similarities with earlier studies of the nonlinear dynamics of viscoelastic fluids in complex geometries. In particular, McKinley et al. (1991) studied a non-shear thinning polymeric Boger fluid composed of polyisobutylene in polybutene flowing through an abrupt axisymmetric contraction and used laser-Doppler velocimetry to characterize the time dependent fluctuations of the resulting corner vortices.87 The initial onset of time dependence (for Wi ≳ 1.5) was determined to be a supercritical Hopf bifurcation. Subsequently, at higher Wi period-doubling and quasi-periodic behaviour was reported. The sequence appears to be a classical route to chaos, and indeed at higher values of the Weissenberg number Wi ≳ 4, McKinley et al. reported an ultimate transition to a state of aperiodic fluctuations. Such a state would now most likely be referred to as ‘elastic turbulence’, which can be loosely described as self-sustained broadband spatio-temporally fluctuating motions driven by elasticity in the absence of inertia.89–92 Aperiodic fluctuations have been reported for strong extensional flows of viscoelastic WLM solutions in cross-slot devices at high Wi (including for similar CPyCl/NaSal solutions as used here).38,41 Elastic turbulence in WLM solutions has also been reported in shear-banded Taylor–Couette flows, due to the onset of an interfacial instabilitiy between the low and high shear rate bands.93–95
Given the aforementioned discussion, it might then be reasonable to expect a similar aperiodic or turbulent-like behaviour to emerge in the present system as the Weissenberg number is increased to even larger values into the regime IV beyond Wic3 ≈ 1000. However, this is not the case.
As shown in Fig. 13 for Wi = 1875 (i.e. within regime IV), a rather clear single peak arises at a high frequency f0 ≈ 11 Hz in the power spectrum of birefringence fluctuations.
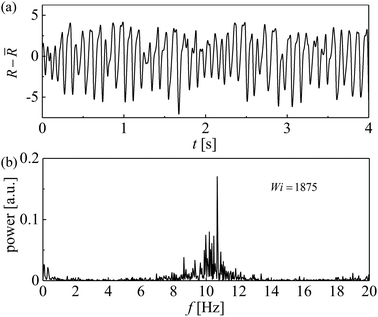 | ||
| Fig. 13 (a) Time-resolved retardation signals extracted at (x, y) = (0.1 mm, 0 mm) and, (b) corresponding power spectra for Wi = 1875. | ||
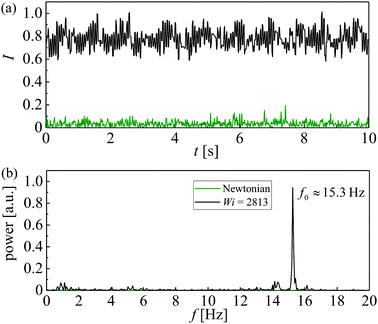
Fig. 14a and b show the time series and corresponding PSD for fluctuations in I in regime IV at a Weissenberg number of Wi = 2813. Here we very clearly observe a single sharp peak in the power spectrum at a frequency f0 ≈ 15 Hz (Fig. 14b). The Newtonian response under equivalent imposed flow conditions, shown for comparison, confirms that this frequency response is material and not the result of instrument noise. The transition into this fourth flow state occurs as the blockage of stagnant material to one side of the cylinder becomes permanently swept away; presumably, the pressure upstream of the cylinder reaches a level such that the presence of the blockage becomes unsustainable. With fluid now passing around both sides of the cylinder, a semblance of symmetry is recovered in the flow field. Fluid elements become once again subjected to the strong extensional flow in the downstream wake of the cylinder, leading to the observed jump in the time-averaged stress birefringence in the wake (shown in Fig. 6). We suggest that the fast temporal dynamics may emerge due to the consequent breakage of micelles into shorter species with a shorter relaxation time on the order λ* ∼ 1/15 s. Such a scenario would have a close consistency with the recent modeling work from Kalb et al., who used the two-species VCM model to study the effect of micelle breakage on asymmetries arising in flows of WLM solutions in the cross-slots geometry.38,40,41,43,44 Micellar solutions composed of long unbroken micelles displayed strong flow asymmetries above a certain Weissenberg number. The onset of asymmetry effectively weakened the streamwise velocity gradients, reducing the degree of micellar alignment and hence stress birefringence. In contrast, for solutions in which the WLMs broke easily into shorter species the flow remained symmetric, with consequently strong streamwise velocity gradients being maintained and hence a higher level of micellar orientation. The breakage of micelles in the cylinder wake, proposed to explain the present results, could potentially be confirmed directly by small-angle neutron scattering experiments.
4 Discussion and conclusions
In this work we have examined the flow of a well-known shear-banding wormlike micellar fluid around a novel type of microfluidic cylinder geometry with a high aspect ratio and a low blockage ratio. Using selective laser-induced etching to fabricate the geometry in fused silica allows the cylinder to be made with a small radius and high aspect ratio while remaining effectively rigid and undeformed under even quite high imposed flow rates. The small radius thus allows us to study very high Weissenberg number flows (up to Wi = 3750) around the cylinder (and also means the Reynolds number remains negligible). In studies with a similar fluid in a similar (but macroscale) geometry, Weissenberg numbers were restricted to Wi ≲ 10, and the flow was found to always remain steady and symmetric.31 By contrast, in our experiments the flow remains steady and symmetric at the lower range of Weissenberg numbers examined Wi ≲ 60, but we observe an extremely rich sequence of instabilities as Wi is increased beyond this value.A first instability is a supercritical pitchfork bifurcation at a critical Weissenberg number Wic ≈ 60, which is characterized by a steady flow asymmetry where more fluid passes around one side of the cylinder than the other. We suggest that this asymmetry may develop as a result of a small random fluctuation in the position of the initially symmetric birefringent wake downstream of the cylinder. A small random asymmetry in the location of the birefringence could lead to an imbalance in the flow resistance (and hence flow rate) at each side of the cylinder. Due to the difference in shear rate at either side of the cylinder and the strong shear thinning of the fluid viscosity, any small imbalance in the flow resistance could become compounded, hence leading to growth of the instability. As the asymmetry intensifies with increasing Wi an effectively stagnant blockage develops on one side of the cylinder while essentially all of the fluid is diverted around the opposite side of the cylinder. The flow geometry is thus effectively transformed from flow around a cylinder to flow through a 2![[thin space (1/6-em)]](https://www.rsc.org/images/entities/char_2009.gif) :
:![[thin space (1/6-em)]](https://www.rsc.org/images/entities/char_2009.gif) 1 asymmetric contraction.
1 asymmetric contraction.
Above a second critical Weissenberg number Wic2 ≈ 130, the flow becomes time dependent, displaying a single characteristic frequency f0 in the power spectra of both the flow field and stress birefringence fluctuations which appears to be robustly connected to the single mode Maxwell relaxation time of the fluid: f0 ≈ 1/λM. By examining the standard deviations of the fluctuations close to this transition, we characterized it as possibly being a backwards Hopf bifurcation. The time-dependence appears to be controlled by the periodic accumulation and washing away of the stagnant fluid blocking the flow around one side of the cylinder.
As the Weissenberg number is increased beyond Wi ≈ 300, we observe a progressive slowing down of the dynamics, and the emergence of harmonics in the power spectra of the fluctuations. The progression of instabilities appears to be a fairly standard route towards aperiodic behaviour (or ‘elastic turbulence’), however this progression is abruptly halted at a third transition occuring at Wic3 ≈ 1000. Beyond Wic3 the stagnant blockage is permanently washed away, the flow field regains a degree of symmetry and there is a marked increase in the flow birefringence in the wake of the cylinder. There is also a significant increase in the frequency of the fluctuations, with peaks arising in the power spectra at around 10 to 15 Hz. Based on recent numerical simulations using the 2-species VCM model to study the effect of micelle breakage on flow instabilities in the cross-slot geometry,43,44 these observations seem consistent with the possible breakage of WLM chains into shorter sections with shorter relaxation times.
While somewhat similar sequences of nonlinear transitions have been reported for flows of viscoelastic polymer solutions in complex flow geometries, we believe this is the first such study revealing related phenomena in more complex WLM solutions, which have the ability to break and reform dynamically in flow. Fruitful insights into the importance of self-assembly in driving such transitions could be extracted from a comparative study of structurally similar polymers which either remain isolated or self-assemble when in solution. An example of such a system could be EHEC (non-self-assembling) and its hydrophobically modified analogue hmEHEC, which forms micelles. The quantitative results reported here will be of fundamental relevance to optimizing processes involving flows of viscoelastic surfactant solutions, for example in oilfield operations, and provide insight into the anomalous motions of particles settling in WLM fluids. In addition they will provide valuable data for benchmarking numerical simulations of viscoelastic constitutive equations designed to describe WLM rheology.
Conflicts of interest
There are no conflicts to declare.Acknowledgements
SJH, KT-P and AQS gratefully acknowledge the support of the Okinawa Institute of Science and Technology Graduate University (OIST) with subsidy funding from the Cabinet Office, Government of Japan. SJH and AQS also acknowledge funding from the Japan Society for the Promotion of Science (Grants-in-Aid for Scientific Research (C), Grant No. 18K03958 and 17K06173, respectively). SJH is grateful to TA Instruments for the donation of a DHR3 rheometer through their Distinguished Young Rheologist Award. We thank Mr San To Chan (OIST) for performing Newtonian flow simulations using ANSYS Fluent and we thank Photron Ltd for the loan of a CRYSTA PI-1P high-speed polarization camera.References
- J. N. Israelachvili, Intermolecular and Surface Forces: With Applications to Colloidal and Biological Systems, Academic Press, London, 1985 Search PubMed.
- H. Hoffmann, H. Löbl, H. Rehage and I. Wunderlich, Tenside Deterg., 1985, 22, 290–298 CAS.
- H. Rehage and H. Hoffmann, J. Phys. Chem., 1988, 92, 4712–4719 CrossRef CAS.
- H. Hoffmann, Structure and Flow in Surfactant Solutions, 1994, ch. 1, pp. 2–31 Search PubMed.
- F. Nettesheim and N. J. Wagner, Langmuir, 2007, 23, 5267–5269 CrossRef CAS PubMed.
- H. Rehage and H. Hoffmann, Mol. Phys., 1991, 74, 933–973 CrossRef CAS.
- T. Shikata, S. J. Dahman and D. S. Pearson, Langmuir, 1994, 10, 3470–3476 CrossRef CAS.
- S. J. Candau and R. Oda, Colloids Surf., A, 2001, 183, 5–14 CrossRef.
- T. M. Clausen, P. K. Vinson, J. R. Minter, H. T. Davis, Y. Talmon and W. G. Miller, J. Phys. Chem., 1992, 96, 474–484 CrossRef CAS.
- T. S. Davies, A. M. Ketner and S. R. Raghavan, J. Am. Chem. Soc., 2006, 128, 6669–6675 CrossRef CAS PubMed.
- S. R. Raghavan, Langmuir, 2009, 25, 8382–8385 CrossRef CAS PubMed.
- K. Trickett and J. Eastoe, Adv. Colloid Interface Sci., 2008, 144, 66–74 CrossRef CAS PubMed.
- J. Yang, Curr. Opin. Colloid Interface Sci., 2002, 7, 276–281 CrossRef CAS.
- S. Kefi, J. Lee, T. Pope, P. Sullivan, E. Nelson, A. Hernandez, T. Olsen, M. Parlar, B. Powers, A. Roy, A. Wilson and A. Twynam, Oilfield Rev., 2005, 16, 10–23 Search PubMed.
- S. Ezrahi, E. Tuval and A. Aserin, Adv. Colloid Interface Sci., 2006, 128, 77–102 CrossRef PubMed.
- B. Kalpakci, E. E. Klaus, J. L. Duda and R. Nagrajan, Soc. Pet. Eng. J., 1981, 21, 709–720 CrossRef CAS.
- J. Holweg, P. O. Brunn and F. Durst, Proceedings, 4th Europ. Symp. on Enhanced Oil Recovery, DGMK, Hamburg, 1987, pp. 1007–1018 Search PubMed.
- J. Holweg, P. O. Brunn and F. Durst, in Progress and Trends in Rheology II, ed. H. Giesekus and M. Hibberd, Steinkopff, 1988, pp. 195–197 Search PubMed.
- P. O. Brunn and J. Holweg, J. Non-Newtonian Fluid Mech., 1988, 30, 317–324 CrossRef CAS.
- E. Ruckenstein, P. O. Brunn and J. Holweg, Langmuir, 1988, 4, 350–354 CrossRef CAS.
- P. O. Brunn and J. Holweg, The Flow of Surfactant Solutions Through Porous Media: Universal Laws, Springer, Netherlands, 1990, pp. 78–80 Search PubMed.
- J. Vorwerk and P. O. Brunn, J. Non-Newtonian Fluid Mech., 1994, 51, 79–95 CrossRef CAS.
- J. P. Rothstein, Rheol. Rev., 2008, 6, 1–46 Search PubMed.
- M. F. Torres, J. M. Gonzaléz, M. R. Rojas, A. J. Müller, A. E. Sáez, D. Löf and K. Schillén, J. Colloid Interface Sci., 2007, 307, 221–228 CrossRef CAS PubMed.
- M. R. Rojas, A. J. Müller and A. E. Sáez, J. Colloid Interface Sci., 2008, 326, 221–226 CrossRef CAS PubMed.
- R. Cressely and R. Hocquart, Optica Acta, 1980, 27, 699–711 CrossRef CAS.
- M. D. Chilcott and J. M. Rallison, J. Non-Newtonian Fluid Mech., 1988, 29, 381–432 CrossRef CAS.
- O. G. Harlen, J. M. Rallison and M. D. Chilcott, J. Non-Newtonian Fluid Mech., 1990, 34, 319–349 CrossRef CAS.
- J. R. Gladden and A. Belmonte, Phys. Rev. Lett., 2007, 98, 224501 CrossRef PubMed.
- G. R. Moss and J. P. Rothstein, J. Non-Newtonian Fluid Mech., 2010, 165, 1–13 CrossRef CAS.
- G. R. Moss and J. P. Rothstein, J. Non-Newtonian Fluid Mech., 2010, 165, 1505–1515 CrossRef CAS.
- A. Jayaraman and A. Belmonte, Phys. Rev. E: Stat., Nonlinear, Soft Matter Phys., 2003, 67, 065301 CrossRef PubMed.
- S. Chen and J. P. Rothstein, J. Non-Newtonian Fluid Mech., 2004, 116, 205–234 CrossRef CAS.
- H. Mohammadigoushki and S. J. Muller, J. Rheol., 2016, 60, 587–601 CrossRef CAS.
- A. A. Dey, Y. Modarres-Sadeghi and J. P. Rothstein, J. Fluid Mech., 2017, 813, R5 CrossRef.
- A. A. Dey, Y. Modarres-Sadeghi and J. P. Rothstein, Phys. Rev. Fluids, 2018, 3, 063301 CrossRef.
- P. E. Arratia, C. C. Thomas, J. Diorio and J. P. Gollub, Phys. Rev. Lett., 2006, 96, 144502 CrossRef CAS PubMed.
- J. A. Pathak and S. D. Hudson, Macromolecules, 2006, 39, 8782–8792 CrossRef CAS.
- R. J. Poole, M. A. Alves and P. J. Oliveira, Phys. Rev. Lett., 2007, 99, 164503 CrossRef CAS PubMed.
- S. J. Haward and G. H. McKinley, Phys. Rev. E: Stat., Nonlinear, Soft Matter Phys., 2012, 85, 031502 CrossRef PubMed.
- S. J. Haward, T. J. Ober, M. S. N. Oliveira, M. A. Alves and G. H. McKinley, Soft Matter, 2012, 8, 536–555 RSC.
- N. Dubash, P. Cheung and A. Q. Shen, Soft Matter, 2012, 8, 5847–5856 RSC.
- A. Kalb, L. A. Villasmil-Urdaneta and M. Cromer, Phys. Rev. Fluids, 2017, 2, 071301 CrossRef.
- A. Kalb, L. A. Villasmil-Urdaneta and M. Cromer, J. Non-Newtonian Fluid Mech., 2018, 262, 79–91 CrossRef CAS.
- P. A. Vasquez, G. H. McKinley and P. L. Cook, J. Non-Newtonian Fluid Mech., 2007, 144, 122–139 CrossRef CAS.
- S. De, J. van der Schaaf, J. A. M. Deen, N. G. Kuipers, E. A. J. F. Peters and J. T. Padding, Phys. Fluids, 2017, 29, 113102 CrossRef.
- D. Kawale, E. Marques, P. L. J. Zitha, M. T. Kreutzer, W. R. Rossen and P. E. Boukany, Soft Matter, 2017, 13, 765–775 RSC.
- D. Kawale, G. Bouwman, S. Sachdev, P. L. J. Zitha, M. T. Kreutzer, W. R. Rossen and P. E. Boukany, Soft Matter, 2017, 13, 8745–8755 RSC.
- S. De, P. Krishnan, J. van der Schaaf, J. A. M. Kuipers, E. A. J. F. Peters and J. T. Padding, J. Colloid Interface Sci., 2018, 510, 262–271 CrossRef CAS PubMed.
- N. François, D. Lasne, Y. Amarouchene, B. Lounis and H. Kellay, Phys. Rev. Lett., 2008, 100, 018302 CrossRef PubMed.
- S. Kenney, K. Poper, G. Chapagain and G. Christopher, Rheol. Acta, 2013, 52, 485–497 CrossRef CAS.
- X. Shi, S. Kenney, G. Chapagain and G. F. Christopher, Rheol. Acta, 2015, 54, 805–815 CrossRef CAS.
- C.-L. Sun and H.-Y. Huang, Biomicrofluidics, 2016, 10, 011903 CrossRef PubMed.
- Y. Zhao, A. Q. Shen and S. J. Haward, Soft Matter, 2016, 12, 8666–8681 RSC.
- K. P. Nolan, A. Agarwal, S. Lei and R. Shields, Microfluid. Nanofluid., 2016, 20, 101 CrossRef.
- L. E. Rodd, T. P. Scott, D. V. Boger, J. J. Cooper-White and G. H. McKinley, J. Non-Newtonian Fluid Mech., 2005, 129, 1–22 CrossRef CAS.
- L. E. Rodd, J. J. Cooper-White, D. V. Boger and G. H. McKinley, J. Non-Newtonian Fluid Mech., 2007, 143, 170–191 CrossRef CAS.
- T. J. Ober, S. J. Haward, C. J. Pipe, J. Soulages and G. H. McKinley, Rheol. Acta, 2013, 52, 529–546 CrossRef CAS.
- G. H. McKinley, R. C. Armstrong and R. A. Brown, Philos. Trans. R. Soc., A, 1993, 344, 265–304 CrossRef.
- J. Gottmann, M. Hermans and J. Ortmann, Phys. Procedia, 2012, 39, 534–541 CrossRef.
- S. J. Haward, K. Toda-Peters and A. Q. Shen, J. Non-Newtonian Fluid Mech., 2018, 254, 23–35 CrossRef CAS.
- G. Meineke, M. Hermans, J. Klos, A. Lenenbach and R. Noll, Lab Chip, 2016, 16, 820–828 RSC.
- C. J. Pipe, T. S. Majmudar and G. H. McKinley, Rheol. Acta, 2008, 47, 621–642 CrossRef CAS.
- J. Y. Lee, G. G. Fuller, N. E. Hudson and X. F. Yuan, J. Rheol., 2005, 49, 537–550 CrossRef CAS.
- T. J. Ober, J. Soulages and G. H. McKinley, J. Rheol., 2011, 55, 1127–1159 CrossRef CAS.
- R. W. Mair and P. T. Callaghan, Europhys. Lett., 1996, 36, 719–724 CrossRef CAS.
- S. M. Fielding, J. Rheol., 2016, 60, 821–834 CrossRef CAS.
- R. B. Bird, R. C. Armstrong and O. Hassager, Dynamics of Polymeric Liquids, John Wiley and Sons, New York, 1987 Search PubMed.
- M. E. Cates, Macromolecules, 1987, 20, 2289–2296 CrossRef CAS.
- M. S. Turner and M. E. Cates, Langmuir, 1991, 7, 1590–1594 CrossRef CAS.
- F. Kern, P. Lemarechal, S. J. Candau and M. E. Cates, Langmuir, 1992, 8, 837–840 CrossRef.
- V. M. Entov and E. J. Hinch, J. Non-Newtonian Fluid Mech., 1997, 72, 31–54 CrossRef CAS.
- S. L. Anna and G. H. McKinley, J. Rheol., 2001, 45, 115–138 CrossRef CAS.
- N. J. Kim, C. J. Pipe, K. H. Ahn, S. J. Lee and G. H. McKinley, Korea-Aust. Rheol. J., 2010, 22, 31–41 Search PubMed.
- C. D. Meinhart, S. T. Wereley and M. H. B. Gray, Meas. Sci. Technol., 2000, 11, 809–814 CrossRef CAS.
- G. G. Fuller, Optical Rheometry of Complex Fluids, Oxford University Press, New York, 1995 Search PubMed.
- J. A. Odell, in Handbook of Experimental Fluid Mechanics, ed. C. Tropea, A. L. Yarin and J. F. Foss, Springer-Verlag, Heidelberg, 2007, pp. 724–732 Search PubMed.
- R. K. Shah and A. L. London, Laminar flow forced convection in ducts: A source book for compact heat exchanger analytical data, Academic Press, New York, 1978 Search PubMed.
- C. Masselon, J. B. Salmon and A. Colin, Phys. Rev. Lett., 2008, 10, 038301 CrossRef PubMed.
- C. Masselon, A. Colin and P. D. Olmsted, Phys. Rev. E: Stat., Nonlinear, Soft Matter Phys., 2010, 81, 021502 CrossRef PubMed.
- V. Lutz-Bueno, R. Pasquino, S. J. Haward, A. Q. Shen and P. Fischer, J. Rheol., 2017, 61, 769–783 CrossRef CAS.
- S. J. Haward, F. J. Galindo-Rosales, P. Ballesta and M. A. Alves, Appl. Phys. Lett., 2014, 104, 124101 CrossRef.
- P. F. Salipante, C. A. E. Little and S. D. Hudson, Phys. Rev. Fluids, 2017, 2, 033302 CrossRef PubMed.
- V. Sharma, S. J. Haward, J. Serdy, B. Keshavarz, A. Soderlund, P. Threlfall-Holmes and G. H. McKinley, Soft Matter, 2015, 11, 3251–3270 RSC.
- J. P. Rothstein, J. Rheol., 2003, 47, 1227–1247 CrossRef CAS.
- J. V. Lawler, S. J. Muller, R. A. Brown and R. C. Armstrong, J. Non-Newtonian Fluid Mech., 1986, 20, 51–92 CrossRef CAS.
- G. H. McKinley, W. P. Raiford, R. A. Brown and R. C. Armstrong, J. Fluid Mech., 1991, 223, 411–456 CrossRef CAS.
- T. Kalmár-Nagy, G. Stépán and F. C. Moon, Nonlinear Dyn., 2001, 26, 121–142 CrossRef.
- A. Groisman and V. Steinberg, Nature, 2000, 405, 53–55 CrossRef CAS PubMed.
- R. G. Larson, Nature, 2000, 405, 27–28 CrossRef CAS PubMed.
- A. Groisman and V. Steinberg, Nature, 2001, 410, 905–908 CrossRef CAS PubMed.
- P. C. Sousa, F. T. Pinho and M. A. Alves, Soft Matter, 2018, 14, 1344–1354 RSC.
- M. A. Fardin, D. Lopez, J. Croso, G. Gregoire, O. Cardoso, G. H. McKinley and S. Lerouge, Phys. Rev. Lett., 2010, 104, 178303 CrossRef CAS PubMed.
- M. A. Fardin, T. J. Ober, V. Grenard, T. Divoux, S. Manneville, G. H. McKinley and S. Lerouge, Soft Matter, 2012, 8, 10072–10089 RSC.
- M. A. Fardin and S. Lerouge, Eur. Phys. J. E: Soft Matter Biol. Phys., 2012, 35, 91 CrossRef PubMed.
Footnote |
| † Electronic supplementary information (ESI) available: Movies showing time-resolved flow and retardation fields captured for the wormlike micellar test fluid around the cylinder at various Wi. See DOI: 10.1039/c8sm02099j |
| This journal is © The Royal Society of Chemistry 2019 |

