DOI:
10.1039/C8RA05515G
(Paper)
RSC Adv., 2018,
8, 25378-25386
Color-tunable phosphor of Sr3YNa(PO4)3F:Tb3+ via interionic cross-relaxation energy transfer
Received
27th June 2018
, Accepted 10th July 2018
First published on 16th July 2018
Abstract
A series of color-tunable Sr3YNa(PO4)3F:Tb3+ phosphors with a fluorapatite structure were synthesized by a traditional high-temperature solid state reaction. The emitting color tuning from blue to green can be observed by gradually increasing Tb3+ concentrations, which is attributed to the enhanced cross-relaxation (CR) between Tb3+ ions, as described by (5D3, 7F6)–(5D4, 7F0). The CR process is analyzed based on the Dexter and Inokuti–Hirayama model, which is assigned to the electric dipole–dipole interaction. The energy transfer critical distance between Tb3+ ions is evaluated to be 18.1 Å. In addition, the thermal quenching mechanism of Sr3YNa(PO4)3F:Tb3+ is also investigated. At the general working temperature of an LED (423 K), the luminescence intensity still maintains 81% and 92% with the Tb3+ concentration of 10 and 30 mol%, respectively, indicating an excellent thermal quenching performance of Tb3+. Due to the good optical and thermal properties, the Sr3YNa(PO4)3F:Tb3+ phosphor can be used as a promising green emitting phosphor candidate in the field of white light applications.
1. Introduction
White light-emitting diodes (WLEDs) considered as the next-generation green lighting sources, have attracted much interest in the solid-state lighting area.1,2 Compared with the conventional incandescent or fluorescent lamps, WLEDs have excellent physical and chemical characteristics, such as long lifetime, high brightness and efficiency, as well as environmental friendliness.3,4 The most used commercial WLED is a combination of an InGaN blue LED chip with a Ce-doped yttrium aluminium garnet (YAG:Ce) phosphor.5 However, this suffers from a low color rendering index (Ra < 80) and high correlated color temperature (Tc > 4500 K) due to color deficiency in the red and blue-green region.6,7 To solve the above problem, green and red phosphors with a blue LED, and a UV LED combining tricolor (red, green and blue) phosphors have been regarded as alternatives. Therefore, for an excellent color rendering index, it is necessary to develop efficient green phosphors that possess an excitation wavelength matching the emission wavelength of blue LEDs (440–470 nm) or UV LEDs (350–410 nm).
Recently, great efforts have been made to develop tricolor phosphors with high emission efficiency via doping with suitable ions. Rare earth (RE) ions have great attracted attention due to their abundant emission colors based of 4f–4f or 5d–4f transitions. Moreover, rare earth ions are generally multi-electron structures and have rich energy levels. Especially, when the rare earth ion is doped into the matrix materials, the electronic energy levels of rare earth ions split by the action of the surrounding crystal field. Among the RE ions, Tb3+ ion is a famous green-emitting activator due to the emission peaks located at 488, 545, 583 and 620 nm, assigned to the 5D4–7FJ (J = 6, 5, 4, 3) multiplet transitions, respectively.8 Besides the green emission from 5D4, blue emissions from higher level 5D3 can be also observed. However, owing to the multi-phonon relaxation and cross-relaxation (CR) occurring between Tb3+ ions, host lattice with low phonon frequency and low doping concentration of Tb3+ are required to detect the blue emissions, which will suppress the 5D3–5D4 nonradiative relaxation.9–11 Thus, it is essential to choose a suitable host with low phonon frequency doping with appropriate concentration to realize Tb3+ activated efficient phosphors.
In recent years, fluorophosphates have been widely investigated on account of their considerable thermal and chemical stability.12,13 In addition, the largest electronegative of fluorine atoms make them usually exhibit attractive electron ability. Apatite type alkaline-earth halophosphates belongs to the hexagonal symmetrical system (space group of P63/m) with a general formula of M5(PO4)3X (M = Na+, K+, Ca2+, Mg2+, Ba2+, Sr2+, Mn2+, Gd3+, Lu3+, Y3+, X = F, Cl, OH and O). So far, a variety of phosphates with the formula M3NaRE(PO4)3F have been reported in the literature, such as Sr3NaGd(PO4)3F, Ba3NaLa(PO4)3F, and Sr3NaLa(PO4)3F.14–16 To the best of our knowledge, there are no reports about the detailed CR property among the Tb3+ ions in Sr3YNa(PO4)3F host.
In this paper, we have synthesized the Sr3Y1−xNa(PO4)3F:xTb3+ (SYNPF:xTb3+) phosphors (0.002 ≤ x ≤ 0.50) via high temperature solid reaction. The dependence of tunable luminescence properties of SYNPF:Tb3+ on Tb3+ concentration is investigated. The quantitative theories for the nonradiative energy transfer are studied according to Förster and Dexter. The energy transfer critical distance and the critical concentration between the Tb3+ ions are evaluated based on the Dexter model. The thermal quenching mechanism of the phosphor was also studied by observing the luminescence variation of SYNPF:Tb3+ at different temperatures. The results indicate that the SYNPF:Tb3+ phosphors have potential applications for UV- or NUV-based WLEDs.
2. Experimental section
2.1 Materials and synthesis
The SYNPF:Tb3+ phosphors were synthesized by a traditional high temperature solid-state reaction. The starting materials include analytical grade SrCO3, SrF2, Na2CO3, NH4H2PO4, Y2O3 (99.99%), and Tb4O7 (99.99%). The SrF2 (A.R.), Na2CO3 (A.R.), and NH4H2PO4 (A.R.) were purchased from Guangfu Co. Ltd, Tianjin (China), SrCO3 (A.R.), Y2O3 (99.99%), and Tb4O7 (99.99%) were bought from Sinopharm Chemical Reagent Co. Ltd, Shanghai (China). The raw materials were weighted and thoroughly mixed homogeneously using an agate mortar for 30 min. After mixing and grinding, the mixtures were placed into a crucible and sintered at 1150 °C for 3 h with active carbon. Finally, all the samples were furnace-cooled to room temperature and reground into fine powder for further measurements.
2.2 Characterization
The crystal structure of the sintered samples was identified by powder X-ray diffraction (XRD) analysis (Bruker AXS D8), with Cu Kα radiation (λ = 1.5418 Å) operating at 40 kV and 40 mA. The photoluminescence (PL) and photoluminescence excitation (PLE) spectra were performed using a Hitachi F-4600 spectrometer equipped with a 150 W xenon lamp. The luminescence decay curves were measured by a Horiba Fluorolog FL3-111 spectrometer with a scintillating xenon lamp. The temperature-dependence luminescence properties were characterized on F4600, in which the prepared samples can be accurately heated to the temperature ranging from room temperature to 400 °C.
3. Results and discussion
3.1 Phase identification
Fig. 1 shows that the XRD patterns of SYNPF host and the SYNPF:xTb3+ (x = 0, 0.02, and 0.30) together with the standard XRD profile of Sr3(La,Ce)Na(PO4)3(F,OH) (JCPDS 50-1595) as a reference. The XRD patterns of all the samples cannot be indexed to any standard data in JCPDS. Fortunately, we found that all the diffraction peaks of the samples agree well with the standard data of JCPDS 50-1595 except a little shift to larger diffraction angle, which implies the prepared phosphor is isostructural with Sr3(La,Ce)Na(PO4)3(F,OH). The shifts of the diffraction peaks can be assigned to the shrinkage of the unit cell due to the substitution of Y3+ (1.015 Å) with La3+ (1.061 Å). Furthermore, with increasing of Tb3+ concentration, a little shift to the smaller 2θ angle can be observed in comparison with the XRD pattern of SYNPF host, which is due to the larger radius of Tb3+ (1.040 Å) than of Y3+. No other diffraction peaks were observed, indicating that the obtained phosphor were single phase and the doped ions were successful dissolved in the SYNPF host without inducing significant changes of the crystal structure. To further study the structure of the obtained samples, Rietveld structure refinement of SYNPF host was performed using the general structure analysis system (GSAS) program to obtain the detailed crystal information.17 Fig. 1(b) illustrates the refinement pattern of SYNPF. The reliability factors Rwp = 7.32%, Rp = 5.93% and χ2 = 7.82, indicating that all the observed peaks satisfy the reflection conditions and our prepared phosphor is of single phase. The prepared SYNPF sample possesses a trigonal system and a P![[3 with combining macron]](https://www.rsc.org/images/entities/char_0033_0304.gif) (no. 147) space group with the cell parameters being a = b = 9.623313 Å, c = 7.147825 Å and V = 573.263 Å3.
(no. 147) space group with the cell parameters being a = b = 9.623313 Å, c = 7.147825 Å and V = 573.263 Å3.
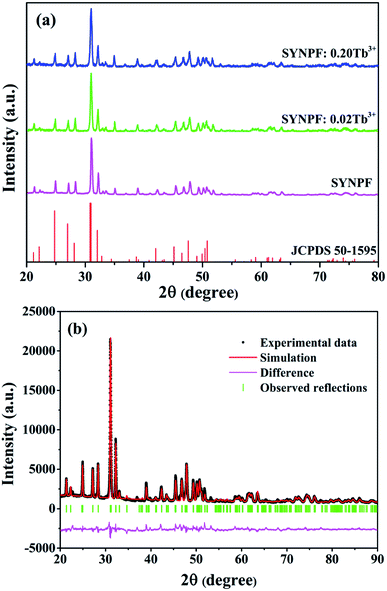 |
| | Fig. 1 (a) XRD patterns of as-synthesized SYNPF and SYNPF:xTb3+, (b) Rietveld structure pattern of the SYNPF host. | |
3.2 Luminescence properties of Tb3+ ions doped phosphors
Fig. 2 depicts the PL (λex = 225 nm) and PLE (λem = 545 nm) spectra of the SYNPF:0.02Tb3+ sample. The PLE spectrum consists with two broad bands. One is a strong broadband with the central peak located at 225 nm, originating from the parity allowed 4f8 → 4f75d1 transition of Tb3+ ions. The other is composed of several weak peaks in the wavelength range of 280–500 nm, which are attributed to the f–d transitions and intra 4f–4f transitions of the Tb3+ ions. Upon excitation by 225 nm, the emission spectrum of SYNPF:0.02Tb3+ exhibits both blue and green emissions in the regions of 350–475 nm and 475–650 nm, respectively. The blue emission peaks located at 380 nm, 414 nm, 436 nm, 456 nm, 472 nm can be assigned as the characteristic emission from 5D3 to 7FJ (J = 6, 5, 4, 3, 2) of Tb3+ ions. Besides the blue emission, some green emission peaks located at 490 nm, 545 nm, 586 nm, 621 nm, respectively are also detected, which are attributed to the transition of Tb3+ ions from 5D4 to 7FJ (J = 6, 5, 4, 3), as shown in Fig. 2.
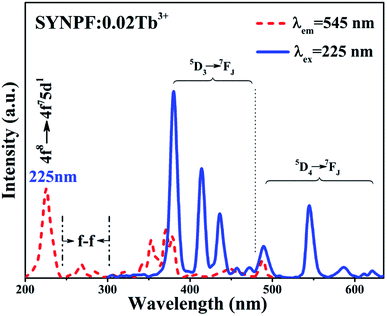 |
| | Fig. 2 PLE (λem = 545 nm) and PL (λex = 225 nm) spectra of SYNPF:0.02Tb3+. | |
In order to study the concentration-dependent luminescent properties (0.002 ≤ x ≤ 0.5) of Tb3+, a series of SYNPF:xTb3+ samples have been synthesized. Fig. 3(a) exhibits the PL spectra of SYNPF:xTb3+ phosphors under the excitation of 225 nm. All of the PL spectra of SYNPF:xTb3+ are composed of two bands (5D3 → 7FJ and 5D4 → 7FJ). When Tb3+ concentration reaches to 1 mol%, the emission intensity of the 5D3 shows the highest value. With the increasing of Tb3+ concentration, the blue emission intensity of 5D3 decreases gradually, meanwhile, the intensities of 5D4 increases, which is due to the reduction of distance of Tb3+ ions. With the decreasing of distance of Tb3+ ions, the interactions between Tb3+ ions becomes stronger, leading to enhancement of the probability of energy transfer from 5D3 to 5D4 level. When the Tb3+ concentration is up to 30 mol%, the emission intensity of 5D4 level starts to decrease, and concentration quenching occurred, as shown in Fig. 3(a). Fig. 3(b) shows the dependence of emission peak intensities at 380 nm (5D3 → 7F6) and at 552 nm (5D4 → 7F5) on the Tb3+ concentrations upon the 225 nm excitation. It can be clearly observed that the emission of 5D3 and 5D4 shows the inverse tendency with the increasing of Tb3+ concentrations, owing to the CR process and concentration quenching of Tb3+, respectively. Since the energy of 5D3 level of 5800 cm−1 is much higher than that of 5D4 level, the de-excitation from 5D3 to 5D4 is owing to CR and multi-phonon relaxation processes. As we know that the CR process is generally determined by the doping concentration of Tb3+ ions, and the multi-phonon relaxation process is related to the matrix frequency. Previous studies have demonstrated that CR process has taken place only if the host possesses low phonon frequency to achieve the tunable blue-green phosphor. Several researches have demonstrated that fluoride have a low phonon frequency (∼450 cm−1), which can realize the transmission from 5D3 to 5D4 of Tb3+ ions as long as the phonon frequency is low enough (∼1000 cm−1).14
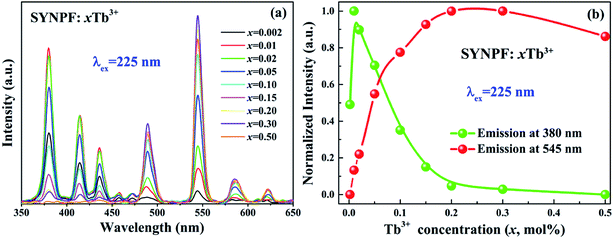 |
| | Fig. 3 Dependence of the (a) PL (λex = 225 nm) spectra and (b) emission intensity of Tb3+ in SYNPF phosphors with the variation of Tb3+ concentrations. | |
3.3 CR energy transfer
Fig. 4 presents the energy level schematic and the corresponding energy level transitions for SYNPF:xTb3+. When NUV light irradiates the fluorescent powder, electrons from the ground state 7F6 level are stimulated to excited state 5D3 level (process 1), then a part of electrons of Tb3+ ions shift from 5D3 excited state transitions of to the ground state of 7FJ (J = 5, 4, 3, 2, 1) level with blue emission. Furthermore, a part of electrons from 5D3 level decays nonradiatively to 5D4. Simultaneously, a nearby acceptor Tb3+ ion is excited from its ground state 7F6 to an intermediate state 7F0, and then returns to ground state via multi-phonon relaxation (process 2). As the similar values of the energy between 5D3 and 5D4 as well as 7F6 and 7F0, an energy transfer is expected to take place through the CR process in the host of SYNPF:Tb3+, resulting in the increasing of the green emission and the reduction of blue emission. The process can be described as: 5D3 (Tb3+) + 7F6 (Tb3+) → 5D4 (Tb3+) + 7F0 (Tb3+).
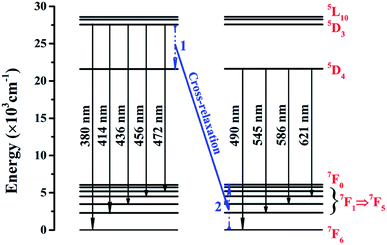 |
| | Fig. 4 Schematic energy levels of SYNPF:Tb3+ for cross-relaxation energy transfer. | |
In general, the energy transfer mechanism of the luminescent center can be classified into exchange interactions, and electric multipole interaction. As we know that the exchange interaction strongly depends on the distance R between donor and acceptor ions. When R is small enough (3 Å ∼ 4 Å), exchange interaction dominates in the host, otherwise, it is attributed to electrical multipole interaction. Thus, the distance between Tb3+ ions (RTb) was induced to specify the type of energy transfer mechanism, which can be estimated as follows:15,16
| |
 | (1) |
where
V is the volume of one unit cell,
N is the number of the cationic sites occupied by activators in one unit cell, and
x is the concentration of Tb
3+ ions. For SYNPF host,
V and
N equal to 573.263 Å
3 and 6. Therefore, by using
eqn (1), the value of
RTb can be calculated to be 45.2, 26.3, 20.9, 15.4, 12.2, 10.7, 9.7, 8.5 and 7.1 Å for the Tb
3+ concentration (the molar ration of Tb
3+ substitute the Y
3+) from 0.2 mol% to 50 mol%, respectively. According to theory of Van Uitert, it can be deduced that the CR between Tb
3+ originates from the electric multipole interaction.
In principle, the CR process can shorten the lifetime of 5D3. Thus, the fluorescence lifetimes (τ1) for the SYNPF:xTb3+ with various Tb3+ concentrations (x = 0.002–0.50) were measured by monitoring the 5D3–7F6 emission (λ = 380 nm), as shown in Fig. 5. For the low Tb3+ concentration of SYNPF, the decay curves can be well fitted into the single exponential function, which can be written as:
| |
 | (2) |
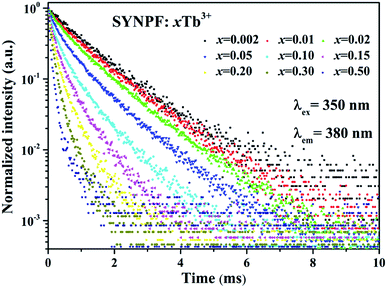 |
| | Fig. 5 Fluorescence decay curve of 5D3 (380 nm) in SYNPF:xTb3+ with various Tb3+ concentrations under 350 nm excitation. | |
With the increasing of Tb3+ concentration, the decays speed up and deviate from single exponential function significantly, which is due to the strengthened CR effects. That is to say the doping of the Tb3+ ions has gradually change the luminescence dynamics of the Tb3+ ions due to the CR energy transfer from the Tb3+ to Tb3+ ions.
The energy transfer process between Tb3+ ions can also be verified by the fluorescence decay of 5D4 (τ2). Fig. 6 shows the decay curves of 5D4 → 7F5 transition (λem = 545 nm) for SYNPF:xTb3+ with different Tb3+ concentration upon the excitation of 350 nm. All the samples exhibit the single exponential decay model, even at high Tb3+ concentration. When the decay time is limited in a small range of times, such as to 0–8 ms, it can be obviously observed the build-up process in the curves, which presents the trend of first increase and then decrease, especially at low Tb3+ concentration, as shown in Fig. 6(b). The above phenomena indicate that there exists a CR energy transfer between Tb3+ ions. The energy excited into the 5d levels of Tb3+ ion first transfers to the 5D4 level of a neighbor Tb3+ ion via CR in the build-up process, and then the 5D4 → 7F5 transition decays slowly. However, the initial rise processes were only observed at low Tb3+ concentrations (0.2–30 mol%), and the decay curve presents simple single-exponential decay processes at high Tb3+ concentrations (50 mol%), which implies the enhancement of CR with the increasing of Tb3+ ions concentration.
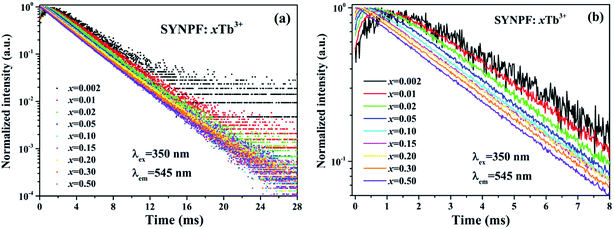 |
| | Fig. 6 Fluorescence decay curve of 5D4 (545 nm) in SYNPF:xTb3+ with various Tb3+ concentrations in (a) in a full time scale, and (b) a local time scale under 350 nm excitation. | |
According to the lifetimes of 5D3 (τ1) and 5D4 (τ2), it can be also found that the enhancement of CR decreases the lifetime of the 5D3 level, whereas the lifetime of the 5D4 level is unaffected if the Tb3+ concentration is below the quenching point. To analysis the dynamic process of the CR, the average fluorescence lifetimes can be defined by using I–H model. The expression is shown as follows:14
| |
 | (3) |
where
I(
t) represents the fluorescent intensity at time
t. The decay lifetimes of
5D
3 for various Tb
3+ concentrations were calculated to be 1.224, 0.970, 0.813, 0.574, 0.376, 0.281, 0.228, 0.172, and 0.143 ms for the Tb
3+ concentration increasing from 0.2 to 50 mol%, respectively. For reference, the lifetimes of
5D
4 were also calculated, as shown in
Fig. 7. It can be clearly observed that the lifetime of
5D
4 nearly unchanged below Tb
3+ concentration of 0.3, which indicates that CR process has little influence on the lifetime of the
5D
4. When the Tb
3+ concentration exceeds 30 mol%, the lifetime of
5D
4 decreases from 3.39 to 2.87 ms, due to the concentration quenching, as shown in
Fig. 7. In contrast to the lifetime of
5D
4, the lifetime of
5D
3 level gradually decreases with the increasing of Tb
3+ ions concentration, which is assigned to the energy transfer
via CR between Tb
3+ ions. To identify the interaction between Tb
3+ ions, the decay lifetimes of
5D
3 level are well fitted with the relationship established by Dexter:
15| |
 | (4) |
where
τ0 is the intrinsic decay lifetime of the donor (Tb
3+),
τ(
x) is fluorescent lifetime at accepter (Tb
3+) concentration
x,
x0 is the critical concentration with the same dimension as the doping concentration
x, and
s = 6, 8 or 10, indicating D–D, D–Q and Q–Q interactions, respectively. According to
eqn (4), the factor
s is defined to be 5.4, which is close to 6, indicating that the energy transfer mechanism is D–D interaction. For the slightly doped of Tb
3+ (0.2 mol%), the CR energy transfer from
5D
3 to
5D
4 is negligible, and the multi-phonon relaxation is supposed to be responsible for the
5D
4 populating.
14 The lifetime of the
5D
3 energy level with the Tb
3+ concentration of 0.002Tb
3+ (1.22 ms) is regarded to be the initial life of
5D
3 (
τ0). Thus, the critical concentration
x0 can be calculated to be 0.03 mol. By using
eqn (1), the average distance between Tb
3+ is determined with the value of 18.1 Å, which is regarded as the critical distance for the Tb
3+ in SYNPF.
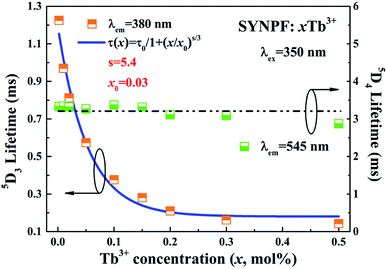 |
| | Fig. 7 Fluorescent lifetime of 5D3 and 5D4 lifetimes of a series of SYNPF:xTb3+ as function of Tb3+concentration with fitting line. | |
Base on the above discussion, the interaction mechanism of Tb3+, critical concentration and distance were determined. However, the above results were based on an intuitive method, and the values were approximated. For further verify the above investigations, I–H model was used to explain the CR energy transfer in SYNPF:xTb3+. As shown in Fig. 6(a), the decay of SYNPF:0.002Tb3+ is single exponential, whereas, with the increasing of Tb3+ concentration, the decay curves become non-exponential. Since the I–H model has succeeded in describing the non-exponential fluorescent decay, the intensity can be expressed as follows:18
| |
 | (5) |
where
ID(
t) is the fluorescent intensity at time
t for the system in the presence of energy transfer, and
s = 6, 8, and corresponding to 10, are for D–D, D–Q, and Q–Q interactions, respectively.
Γ(1 − 3/
s) is a gamma function,
nA is the number of acceptor ions per unit volume, and
R0 is the critical distance. According to
eqn (2) and
(5), we can obtain that
| |
 | (6) |
The ratio ID(t)/ID0(t) characterizes the decay of excited donors to the acceptors via CR. From eqn (6), one has
| |
 | (7) |
and
| |
 | (8) |
According to eqn (8), log10{ln[ID0(t)/ID(t)]} acts as a linear function of log10![[thin space (1/6-em)]](https://www.rsc.org/images/entities/char_2009.gif) t with a slope of 3/s. Fig. 8 depicts the log–log plot of ln[ID(t)/ID0(t)] as a function of t for sample of SYNPF:0.05Tb3+. By using the value of the slope (0.49), the parameter s was calculated to be 6, which implies that the interaction of CR energy transfer is the dipole–dipole interaction, which agrees well with the results obtained by the Dexter model.
t with a slope of 3/s. Fig. 8 depicts the log–log plot of ln[ID(t)/ID0(t)] as a function of t for sample of SYNPF:0.05Tb3+. By using the value of the slope (0.49), the parameter s was calculated to be 6, which implies that the interaction of CR energy transfer is the dipole–dipole interaction, which agrees well with the results obtained by the Dexter model.
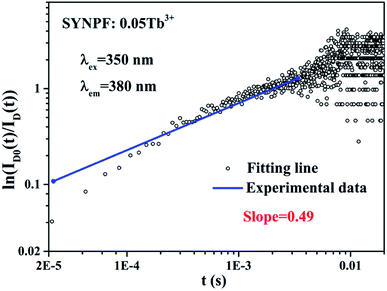 |
| | Fig. 8 The relationship of ln(ID0(t)/ID(t)) vs. t plotted in a double logarithmic coordinate for sample SYNPF:0.05Tb3+. | |
In order to further confirm the process of energy transfer, the CR rate (WCR) and CR efficiency were calculated, as shown in Fig. 9. The WCR of different Tb3+ concentration can be determined by using eqn (9):19,20
| |
 | (9) |
where
τ10 is the fluorescence lifetime of
5D
3 at the lowest doping concentration of Tb
3+ (
x = 0.002) where the CR is negligible.
14 τ10 is then written as:
19| |
 | (10) |
where
W0 is the multi-phonon relaxation rate and
γ1 is the radiative transition rate of
5D
3, both of which are independent of Tb
3+ ions concentration.
Fig. 9(a) illustrates the dependence of
WCR on Tb
3+ concentration with a nearly linear relationship. Thus, the CR rate can be written as:
where
A is a proportional constant and
x is the concentration of Tb
3+ ions. As we know that the multi-phonon relaxation rate is independent of concentration for the luminescent centers. Therefore,
via using
eqn (9)–(11),
τ1 can be fitted by the function as
τ1 = 1/(
Ax +
B), where
B is the sum of
W0 and
τ1. In addition, the CR efficiency of the
5D
3 to
5D
4 of the Tb
3+ ions of SYNPF:
xTb
3+ is also calculated by using
eqn (12):
20| |
 | (12) |
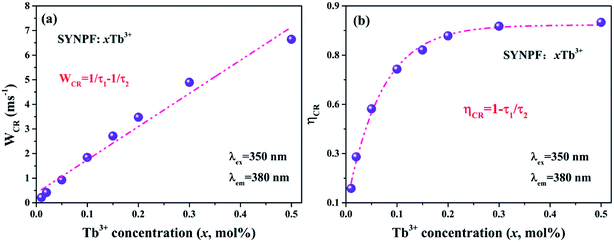 |
| | Fig. 9 Dependence of (a) CR rate (WCR), and (b) CR efficiency ηCR in SYNPF:xTb3+ on Tb3+ concentration. | |
And shown in Fig. 9(b), it can be seen that the CR efficiency increases gradually and reaches to 88% with the increase of Tb3+ ions concentration.
Due to the CR between Tb3+, the intensity ratios of green and blue emissions show significant dependence on WCR, as shown in Fig. 10. The relationship between RG/B and WCR can be written as:19
| |
 | (13) |
where
R0 is the initial value of the ratio and
τ20 is the lifetime of
5D
4 at the lowest concentration of Tb
3+ ions.
τ2 and
τ20 can be eliminated due to
τ2 remains nearly unchanged with different Tb
3+ concentrations, as shown in
Fig. (7). Therefore,
eqn (13) can be rewritten as:
| |
 | (14) |
where
RG/B and
R0 at different Tb
3+ concentrations can be calculated from the emission spectra. It can be found that the dependence of
RG/B/
R0 on
WCR is close to a linear relationship, indicating a strong dependence of
RG/B on Tb
3+ concentration.
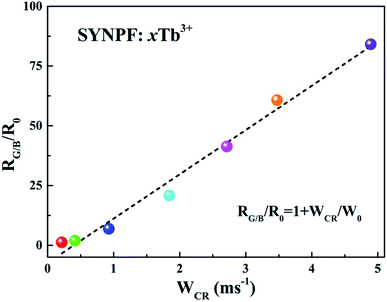 |
| | Fig. 10 Dependence of RG/B/R0 as a function of WCR for SYNPF:xTb3+ with various Tb3+ concentration. | |
3.4 Color chromaticity
Due to the energy transfer between Tb3+ and Tb3+ ions, the emission color tunes of SYNPF:xTb3+ phosphors can be realized from blue to green in the single Tb3+ doped upon UV excitation. As shown in Fig. 11, the values of x and y of SYNPF:xTb3+ color coordinates and correlated color temperatures are calculated. It can be seen that the CIE chromaticity coordinates of SYNPF:xTb3+ are changed from (0.2481, 0.209) to (0.3004, 0.5554) corresponding to light purple blue to green emission. The CIE chromaticity coordinate of SYNPF:0.05Tb3+ (0.2511, 0.3721) is very close to an ideal white chromaticity coordinate (0.33, 0.33). Additionally, the color coordinate of SYNPF:0.3Tb3+ (0.2885, 0.5423) is close to commercial fluorescent powder MgAl11O19: 0.67Ce3+, 0.33Tb3+ (0.3300, 0.5950), suggesting that SYNPF:Tb3+ is a potential candidate in the solid white light field. The above results indicate that SYNPF:Tb3+ has a potential application in the field of lighting with low correlation color temperature, which can be emitted from white light.
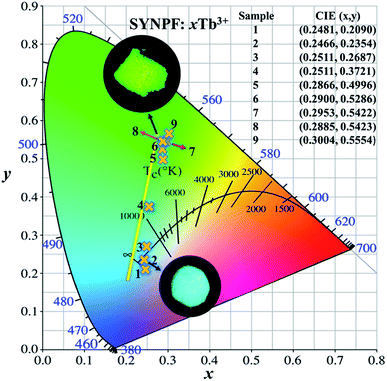 |
| | Fig. 11 CIE chromaticity diagram for SYNPF:xTb3+ with various Tb3+ concentrations. | |
3.5 Thermal quenching
As we know that the stable working temperature of a phosphor converted LED is generally at 150 °C.21,22 Thus, the thermal characteristics of the SYNPF:Tb3+ phosphor were also investigated. Fig. 12(a) and (b) exhibit the temperature-dependent PL spectra of SYNPF:Tb3+ with Tb3+ concentration of 10 mol% and 30 mol% under the excitation of 225 nm. It can be observed that with the increasing of the temperature from 298 K to 673 K, the emission intensity of all the samples decrease very slowly. Fig. 12(c) and (d) show the emission intensity of the 5D3 and 5D4 of Tb3+ ions under different temperature. When the temperature ups to 423 K, the intensity of the 5D3 and 5D4 emission for Tb3+ concentration of 0.1 mol% and 0.3 mol% decreased to 80% and 90%, as well as 82% and 94% of the initial value, respectively. For the best sample (SYNPF:0.3Tb3+), the intensity of green emission still exceeds 85% as the temperature ups to 675 K. The inset of Fig. 12(c) and (d) show the detailed tendency of the entire emission intensity of SYNPF:Tb3+ under different temperature. According to the above results, SYNPF:Tb3+ phosphor exhibits excellent thermal quenching performance with the increase of concentration.
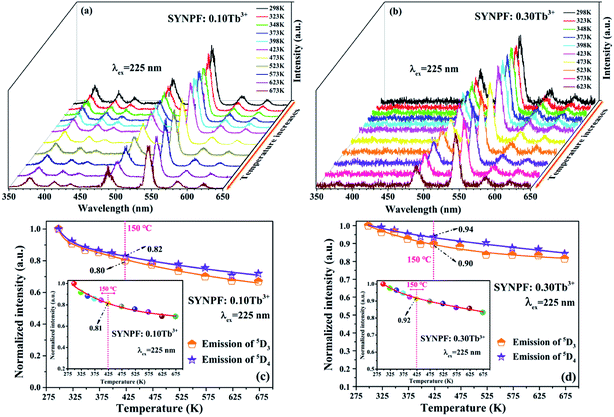 |
| | Fig. 12 PL spectra of (a) SYNPF:0.1Tb3+, and (b) SYNPF:0.3Tb3+ with different temperatures in the range from 298 K to 673 K. Integrated intensity of both the emission intensity peak of 5D3 and 5D4 for (c) SYNPF:0.1Tb3+ and (d) SYNPF:0.3Tb3+ under different temperatures. The inset is the integrated intensity of the entire spectra for SYNPF:0.1Tb3+ and 0.3 Tb3+. | |
4. Conclusion
The Tb3+ doped SYNPF phosphors have been prepared by a traditional high-temperature solid-state reaction. The PL spectra of SYNPF: Tb3+ exhibit two groups of emissions originating from the 5D3 and 5D4 energy level. With increasing of Tb3+ concentrations, SYNPF:Tb3+ exhibits tunable emissions from the blue to green region, and the intensity ratio of blue to green emission is reduced via the CR described by (5D3, 7F6)–(5D4, 7F0). According to the I–H model and critical distance, the electronic dipole–dipole interaction between Tb3+ governs the dynamic CR process. The CR parameters are determined with the critical CR distance R0 = 18.1 Å and the critical concentration x0 = 0.03 mol. Moreover, the CR efficiency and the CR rate increase rapidly with the increasing of Tb3+ doping concentration. When the doping concentration is up to 50 mol%, the CR efficiency is as high as 86%, and the CR rate increases linearly. The thermal quenching of SYNPF:Tb3+ has also been studied. No obvious thermal quenching of SYNPF:Tb3+ can be observed. At the LED operating temperature of 423 K, the luminescence intensity of 5D3 and 5D4 for SYNPF:0.1Tb3+ and 0.3Tb3+ decreases to the 80% and 90%, and 82% and 94% compared to the values at room temperature, respectively. The above results indicate that due to the good luminescence characteristics and thermal properties of SYNPF:Tb3+, it is one of the potential candidates for fluorescence in the field of white light.
Conflicts of interest
There are no conflicts to declare.
Acknowledgements
This work is financially supported by the National Natural Science Foundation of China (Grant No. 61604029, and 11774042), the high-level personnel in Dalian innovation support program (Grant No. 2017RQ070), and Fundamental Research Funds for the Central Universities (Grant No. DUT18LK48, and 3132018239).
References
- Y. L. Zhu, Y. J. Liang, M. F. Zhang, M. H. Tong, G. G. Li and S. Wang, RSC Adv., 2015, 5, 98350–98360 RSC.
- K. X. Song, J. X. Zhang, Y. F. Liu, C. H. Zhang, J. Jiang, H. C. Jiang and H. B. Qin, J. Phys. Chem. C, 2015, 119, 24558–24563 CrossRef.
- M. Y. Chen, Z. G. Xia, M. S. Molokeev and Q. L. Liu, J. Mater. Chem. C, 2015, 3, 12477–12483 RSC.
- M. M. Jiao, Q. F. Xu, C. L. Yang and H. P. You, RSC Adv., 2017, 7, 28647–28654 RSC.
- C. Liang, H. P. You, Y. B. Fu, X. M. Teng, K. Liu and J. H. He, Dalton Trans., 2015, 44, 8100–8106 RSC.
- C. Zeng, H. W. Huang, Y. M. Hu, S. M. Jun and J. Zhou, Mater. Res. Bull., 2016, 76, 62–66 CrossRef.
- J. S. Zhang, Z. D. Hao, X. Zhang, Y. S. Luo, X. G. Ren, X. J. Wang and J. H. Zhang, J. Appl. Phys., 2009, 106, 034915 CrossRef.
- S. Li, N. Guo, Q. M. Liang, Y. Ding, H. T. Zhou, R. Z. Ouyang and W. Lv, Spectrochim. Acta, Part A, 2018, 190, 246–252 CrossRef PubMed.
- Y. Zhang, X. J. Zhang, H. R. Zhang, L. L. Zheng, Y. Zeng, Y. Lin, Y. L. Liu and B. F. Lei, RSC Adv., 2018, 8, 3530–3535 RSC.
- D. W. Wen, J. J. Feng, J. H. Li, J. X. Shi, M. W. Wu and Q. Su, J. Mater. Chem. C, 2015, 3, 2107–2114 RSC.
- Y. J. Hua, D. W. Zhang, H. P. Ma, D. G. Deng and S. Q. Xu, RSC Adv., 2016, 6, 113249–113259 RSC.
- M. M. Jiao, N. Guo, W. Lv, Y. C. Jia, W. Z. Lv, Q. Zhao, B. Q. Shao and H. P. You, Inorg. Chem., 2013, 52, 10340–10346 CrossRef PubMed.
- Z. F. Yang, D. H. Xu, J. N. Du, X. D. Gao and J. Y. Sun, RSC Adv., 2016, 6, 87493–87501 RSC.
- J. S. Zhang, B. J. Chen, Z. Q. Liang, X. P. Li, J. S. Sun, R. X. Zhong, L. H. Cheng and H. Y. Zhong, J. Fluorine Chem., 2012, 144, 1–6 CrossRef.
- D. L. Dexter and J. H. Schulman, J. Chem. Phys., 1954, 22, 1063–1070 CrossRef.
- W. Lenth, G. Huber and D. Fay, Phys. Rev. B: Condens. Matter Mater. Phys., 1981, 23, 3877–3885 CrossRef.
- A. C. Larson and R. B. Von Dreele, Los Alamos Natl. Lab., 1994, pp. 1–221.
- M. Inokuti and F. Hirayama, J. Chem. Phys., 1965, 43, 1978–1989 CrossRef.
- Z. D. Hao, J. H. Zhang, X. Zhang, S. Z. Lu and X. J. Wang, J. Electrochem. Soc., 2009, 156, 193–196 CrossRef.
- Y. F. Liu, J. X. Zhang, C. H. Zhang, J. Jiang and H. C. Jiang, J. Phys. Chem. C, 2016, 120, 2362–2370 CrossRef.
- J. Y. Chen, N. M. Zhang, C. F. Guo, F. J. Pan, X. J. Zhu, H. Suo, X. Q. Zhao and E. M. Goldys, ACS Appl. Mater. Interfaces, 2016, 8, 20856–20864 CrossRef PubMed.
- X. G. Zhang, J. L. Zhang and M. L. Gong, Opt. Mater., 2014, 36, 850–853 CrossRef.
|
| This journal is © The Royal Society of Chemistry 2018 |
Click here to see how this site uses Cookies. View our privacy policy here.  Open Access Article
 *a,
Shitian Yinga,
Lu Hana,
Jinsu Zhang*b and
Baojiu Chen
 b
b
![[3 with combining macron]](https://www.rsc.org/images/entities/char_0033_0304.gif) (no. 147) space group with the cell parameters being a = b = 9.623313 Å, c = 7.147825 Å and V = 573.263 Å3.
(no. 147) space group with the cell parameters being a = b = 9.623313 Å, c = 7.147825 Å and V = 573.263 Å3.


![[thin space (1/6-em)]](https://www.rsc.org/images/entities/char_2009.gif) t with a slope of 3/s. Fig. 8 depicts the log–log plot of ln[ID(t)/ID0(t)] as a function of t for sample of SYNPF:0.05Tb3+. By using the value of the slope (0.49), the parameter s was calculated to be 6, which implies that the interaction of CR energy transfer is the dipole–dipole interaction, which agrees well with the results obtained by the Dexter model.
t with a slope of 3/s. Fig. 8 depicts the log–log plot of ln[ID(t)/ID0(t)] as a function of t for sample of SYNPF:0.05Tb3+. By using the value of the slope (0.49), the parameter s was calculated to be 6, which implies that the interaction of CR energy transfer is the dipole–dipole interaction, which agrees well with the results obtained by the Dexter model.


