 Open Access Article
Creative Commons Attribution 3.0 Unported Licence
Transition metal redox switches for reversible “on/off” and “slow/fast” single-molecule magnet behaviour in dysprosium and erbium bis-diamidoferrocene complexes†
Courtney M.
Dickie
a,
Alexander L.
Laughlin
b,
Joshua D.
Wofford
a,
Nattamai S.
Bhuvanesh
a and
Michael
Nippe
 *a
*a
aDepartment of Chemistry, Texas A&M University, 3255 TAMU, College Station, TX, 77843 USA. E-mail: nippe@chem.tamu.edu
bDepartment of Chemistry and Biochemistry, University of California, 607 Charles E. Young Drive East, Los Angeles, California 90095, USA
First published on 2nd October 2017
Abstract
Single-molecule magnets (SMMs) are considered viable candidates for next-generation data storage and quantum computing. Systems featuring switchability of their magnetization dynamics are particularly interesting with respect to accessing more complex logic gates and device architectures. Here we show that transition metal based redox events can be exploited to enable reversible switchability of slow magnetic relaxation of magnetically anisotropic lanthanide ions. Specifically, we report anionic homoleptic bis-diamidoferrocene complexes of Dy3+ (oblate) and Er3+ (prolate) which can be reversibly oxidized by one electron to yield their respective charge neutral redox partners (Dy: [1]−, 1; Er: [2]−, 2). Importantly, compounds 1 and 2 are thermally stable which allowed for detailed studies of their magnetization dynamics. We show that the Dy3+[1]−/1 system can function as an “on”/“off” or a “slow”/“fast” redox switchable SMM system in the absence or presence of applied dc fields, respectively. The Er3+ based [2]−/2 system features “on”/“off” switchability of SMM properties in the presence of applied fields. Results from electrochemical investigations, UV-vis-NIR spectroscopy, and 57Fe Mössbauer spectroscopy indicate the presence of significant electronic communication between the mixed-valent Fe ions in 1 and 2 in both solution and solid state. This comparative evaluation of redox-switchable magnetization dynamics in low coordinate lanthanide complexes may be used as a potential blueprint toward the development of future switchable magnetic materials.
Introduction
Single-molecule magnets (SMMs) have been attracting considerable attention for potential applications in quantum computing, high-density data storage and molecular spintronics.1–5 This fascinating class of compounds is defined by a bistable magnetic ground state and an energy barrier (Ueff) to reorientation of their molecular spin.6–8 The height of this barrier is determined by the magnetic anisotropy of the system and tunable via ligand field considerations. While initial efforts in the field focused on slow magnetic relaxation in multi-nuclear transition metal complexes,9,10 complementary efforts have led to the development of lanthanide-based single-ion magnets (SIMs).11,12 Lanthanide ions are attractive candidates for SIM applications, due to their large inherent magnetic single-ion anisotropy, leading to the development of SIMs with record barriers to spin reorientation, Ueff.13–16With the ultimate-goal of utilizing SMMs in devices, the development of methodologies that will allow for the control of dynamic magnetic properties reversibly via external stimuli is an essential aspect. Possible stimuli include light, temperature, pressure, chemical, dc field, and electric potential.17–22 Redox-active SMMs present an exciting route for the reversible modulation of magnetic properties using an electric potential.23–30 Notably, the first reported class of lanthanide ion-based SIMs, the Tb3+ phthalocyanine double-decker complexes, are redox-switchable SIMs, undergoing changes in magnetization dynamics and hysteretic behaviour upon electrochemical generation of an open shell π-system.12,31,32
There have been several reported examples of redox-switchability in multinuclear transition metal and lanthanide based SMMs. In these systems, the oxidation and/or reduction of either a ligand23,33–35 or a metal centre24–26,36 facilitates magnetic exchange interactions; turning the SMM properties “on” or “off”. In addition to these “on”/“off” examples, in some cases adding and/or removing an electron has been shown to improve SMM properties.27–30
Aside from the Tb3+ and Dy3+ double-decker lanthanide(III) phthalocyanine complexes,12,37 to our knowledge there is only one previously reported example of proven redox controllable dynamic magnetic properties in a mononuclear lanthanide(III)-based SIM. In that example an intramolecularly attached Ru2/3+ redox switch was utilized to modify the magnetic relaxation dynamics of a Dy3+-based SIM.29 The oxidation of Ru2+ to Ru3+ was found to enhance slow magnetic relaxation, either through perturbations of the ligand field or the addition of another spin-carrier to the system. However, this interesting system suffered from limited thermal stability at room temperature.
The reversible redox properties of ferrocene, FeCp2, make it an attractive moiety to include in complexes for redox switchability applications.38 This inspired us to evaluate the possibility of utilizing the redox properties of ferrocene-containing ligands to modulate the dynamic magnetic properties of a nearby lanthanide(III) ion. Previously, Diaconescu et al. reported a homoleptic uranium(IV) compound stabilized by two bidentate diamidoferrocene ligands.39,40 Notably, one-electron oxidation of the complex resulted in a mixed-valent species, indicating strong uranium-mediated electronic communication between the two iron sites. Interestingly, there have been no similar studies reported with lanthanide(III) bis-diamidoferrocene compounds.
Herein, we present the first class of Ln3+ ion-based redox switchable SMMs using the redox chemistry of ferrocene/ferrocenium in the ligand scaffold.41–46 We show how the reversible one-electron oxidation of Fe2+ to Fe3+ in Dy3+ (oblate electron density) and Er3+ (prolate electron density) bis-diaminoferrocene compounds modulates dynamic magnetic properties. Depending on the experimental conditions, these materials can exhibit switchability of their slow magnetic relaxation either between “on” and “off” or between “slow” and “fast”. Remarkably, this is the first example of redox switchable SMM properties observed in an Er3+ compound. Additionally, this is the first magnetic investigation of homoleptic, four-coordinate Dy3+ and Er3+ complexes. This set of compounds has been characterized using X-ray crystallography, dc/ac magnetometry, 57Fe Mössbauer spectroscopy, UV-vis-NIR spectroscopy and cyclic voltammetry.
Notably, this is the first example of using the redox chemistry of a transition metal to alter the magnetization dynamics of a lanthanide ion, while maintaining thermal stability of all redox partners. This molecular level study is intended to provide design guidelines for future switchable solid materials.
Results and discussion
Synthesis and structural characterisation
The reaction between LnI3 (Ln = Dy or Er) and two equivalents of [K2(OEt2)]fc[NSi(t-Bu)Me2]2 in thf yielded the anionic lanthanide(III) species K(thf)5[Ln(fc[NSi(t-Bu)Me2]2)2] (Dy = [1]−, Er = [2]−) (Scheme 1). Yellow plate crystals were grown from a concentrated thf solution layered with hexanes at −30 °C over 24 hours. One-electron oxidation of K(thf)5[Ln(fc[NSi(t-Bu)Me2]2)2] with half an equivalent of iodine afforded the neutral mixed valent Fe3+/Fe2+ compounds Dy(fc[NSi(t-Bu)Me2]2)21 and Er(fc[NSi(t-Bu)Me2]2)22 (Scheme 1). Dark purple (1) and dark red-brown (2) block crystals were grown from concentrated hexanes solutions at −30 °C over 24 h.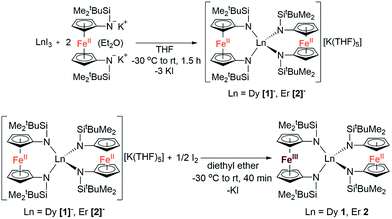 | ||
| Scheme 1 Synthesis of K(thf)5[Ln(fc(NSi(t-Bu)Me2)2)2] (Ln = Dy [1]−, Er [2]−) and Ln(fc[NSi(t-Bu)Me2]2)2 (Ln = Dy 1, Er 2). | ||
Although [1]− and [2]− readily crystallize under the experimental conditions, single crystal X-ray diffraction data indicated severe disorder. However, the connectivity of [1]− and [2]− could be established and equivalent distances between the Ln3+ ion and the two Fe2+ ions were found. The neutral, mixed-valent compounds 1 and 2 are isostructural to each other and crystallize in the orthorhombic space group Pbca (Fig. 1, Tables S1 and S2†). The central Ln3+ ion is four-coordinate, ligated through the nitrogen atoms of the amide moieties of two bidentate diamidoferrocene ligands. Notably, the one-electron oxidized complexes feature lower symmetry around the Ln3+ ion. The coordination geometry around the Ln3+ ion is distorted tetrahedral, with N-Ln–N angles varying from 100.3(2)° to 131.9(2)° and 102.2(6)° to 126.7(6)° for 1 and 2, respectively. The differences in Fe–C bond lengths of the two crystallographically independent Fe sites indicate valence localization in the solid state at this temperature (110 K). The two Ln⋯Fe distances in 1 and 2 are inequivalent, with long Ln⋯Fe distances of 3.792(2) Å and 3.819(5) Å and short Ln⋯Fe distances of 3.368(2) Å and 3.498(4) Å (Fig. S1†). The Ln–N distances in 1 and 2 are also inequivalent with longer Ln–N distances (2.370(4), 2.338(4) Å and 2.29(1), 2.27(2) Å) and shorter distances (2.262(4), 2.252(4) Å and 2.22(2), 2.21(2) Å). In the solid state, the closest Fe⋯Fe distances are intermolecular with separations of 6.464(2) Å and 6.478(5) Å, while the intramolecular Fe⋯Fe distances are 7.098(2) Å and 7.267(5) Å for 1 and 2, respectively (Fig. 2 and S2†).
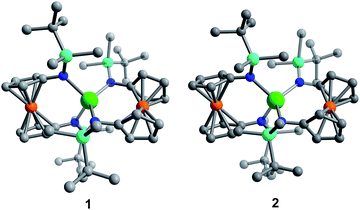 | ||
| Fig. 1 Molecular structure of Dy(fc[NSi(t-Bu)Me2]2)21 (left) and Er(fc[NSi(t-Bu)Me2]2)22 (right). Green = Ln, orange = Fe, cyan = Si, blue = N, grey = C. Hydrogen atoms omitted for clarity. | ||
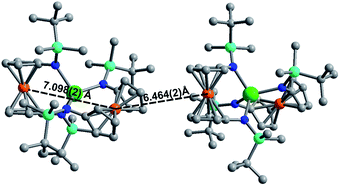 | ||
| Fig. 2 Solid state intra- and intermolecular Fe⋯Fe distances in 1 at 110 K. Hydrogen atoms omitted for clarity. | ||
Magnetic properties
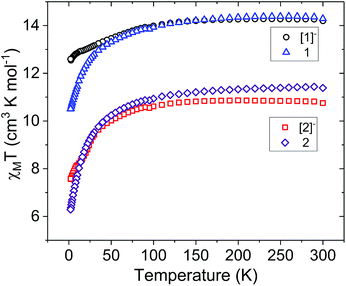
For the Er3+ analogues, the room temperature χMT value for [2]− is 10.82 cm3 K mol−1. This value is only slightly lower than the expected value of 11.28 cm3 K mol−1 for a single isolated Er3+ ion (4I15/2, S = 3/2, L = 6, g = 6/5). After one-electron oxidation to 2, the room temperature χMT value increases to 11.43 cm3 K mol−1, corresponding to one Er3+ ion and one non-interacting Fe3+ ion. As observed in the analogous Dy3+ compounds, there is a more rapid decrease in the χMT of the oxidized mixed-valent compound 2 at low temperatures.
The field dependence of the magnetization (M) was measured for each compound with fields up to 70 kOe (7 T) over a temperature range of 2–8 K (Fig. S3–S10†). In the Dy3+ compound [1]− at 2 K, the magnetization increases sharply until 1 T, followed by a more gradual increase, reaching a saturated moment of 5.34 μB at 7 T (Fig. S3†). This is near to the expected value of 5.23 μB for one uncorrelated Dy3+ ion in the presence of ligand field effects.48 The non-superposition in the temperature dependence (M vs. H/T) suggests the presence of significant magnetic anisotropy in [1]− (Fig. S4†). In 1 at 2 K, the magnetization increases sharply until 1 T and then gradually increases, reaching an unsaturated moment of 5.07 μB at 7 T (Fig. S5†). The lack of obvious saturation along with the non-superposition in the M vs. H/T data suggests the presence of low-lying excited states and/or significant anisotropy (Fig. S6†).47 The Er3+ compounds [2]− and 2 reach unsaturated moments at 7 T of 4.97 μB and 4.86 μB, respectively (Fig. S7 and S9†). These unsaturated moments are in accordance with previously characterized mononuclear Er3+ complexes.49–51 The lack of clear saturation in the M vs. H data along with the non-superposition of M vs. H/T (Fig. S8 and S10†), implies low-lying excited states and/or magnetic anisotropy.
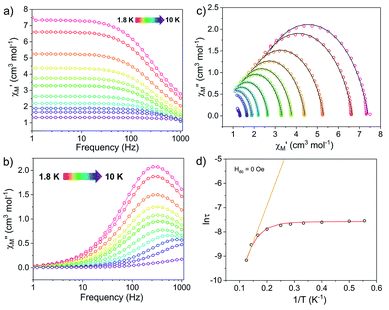 | ||
Fig. 4 Ac susceptibility measurements for [1]− under zero dc field. (Left) Frequency dependence of the (a) in-phase, χ′, and (b) out-of-phase, χ′′, components of the ac susceptibility. (c) Cole–Cole plots, open circles are experimental data and black lines are fits to the generalized Debye equation.52 (d) Arrhenius plot, open circles are experimental data points. The orange line represents fit of the linear region, using the three highest temperature points, to the equation using the expression τ−1 = τ0−1![[thin space (1/6-em)]](https://www.rsc.org/images/entities/char_2009.gif) exp(−Ueff/kBT); with Ueff = 20.9 cm−1 and τ0 = 2.43 × 10⁻⁶ s. The red curve represents the fit to eqn (1), with Ueff = 27.3(8) cm−1 and τ0 = 1.63(2) × 10−6 s. exp(−Ueff/kBT); with Ueff = 20.9 cm−1 and τ0 = 2.43 × 10⁻⁶ s. The red curve represents the fit to eqn (1), with Ueff = 27.3(8) cm−1 and τ0 = 1.63(2) × 10−6 s. | ||
The Arrhenius plot of [1]− (Fig. 4d) was fit using least squares regression to a model that accounted for multiple relaxation processes, including, QTM, Raman, and Orbach processes (eqn (1)).
 | (1) |
The parameters τQTM, C (Raman coefficient), τ0 (pre-exponential factor), and Ueff (thermal barrier for Orbach relaxation) were treated as free-fit parameters. For Kramers ions, parameter n2 in the Raman pathway is expected to be 9; although allowing n2 to be a free-fit parameter resulted in a value of n = 5. A value lower than 9 may be expected in systems with low-lying excited states if optical phonons are taken into consideration.53,54 Only the Orbach process, the “over the barrier” pathway, appears linear on the plot of ln![[thin space (1/6-em)]](https://www.rsc.org/images/entities/char_2009.gif) τ vs. T−1.
τ vs. T−1.
Due to the predominance of quantum tunnelling of magnetization (QTM) at low temperatures, few temperature dependent points were obtained. However, a barrier height, Ueff = 27.3(8) cm−1 (τ0 = 1.63(2) × 10−6 s), for the thermally activated Orbach process was calculated for [1]− under Hdc = 0 Oe using eqn (1). All parameters of the fit are listed in Table S5.†
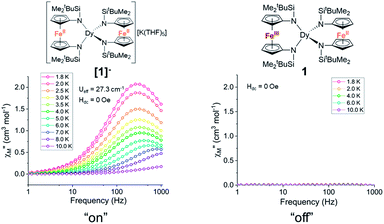
Notably, the one-electron oxidation product 1 shows no evidence of slow relaxation under zero applied dc field at ac frequencies up to 1000 Hz (Fig. S11 and S12†). This is likely due to faster QTM in the oxidized species 1 than in the non-oxidized species [1]−. This could be attributed to both the lower symmetry around the Dy3+ ion in the mixed-valent compound and/or the introduction of an S = 1/2 site nearby the magnetically anisotropic Dy3+ ion. In detail, changes in ligand field and dipole-dipole interactions have been shown to facilitate mixing of magnetic states through which QTM can be introduced. Structural changes (and potentially packing effects) likely make the largest contribution to the change in magnetization dynamics. The appreciable loss of symmetry upon oxidation and change in ligand field would undoubtedly influence the orientation of the magnetic anisotropy axis and therefore the magnetization dynamics. In the absence of applied dc fields, the changes in magnetization dynamics upon reversible one-electron oxidation of [1]− to 1 can be thought of as “on”/“off” switching of the slow magnetic relaxation (frequencies up to 1000 Hz) (Fig. 5).
For both Er3+ compounds, [2]− and 2, no signal was observed in the out-of-phase component (χ′′) of the ac susceptibility under zero dc field at ac frequencies up to 1000 Hz (Fig. S14 and S16†); likely a result of efficient ground state QTM processes for these species.
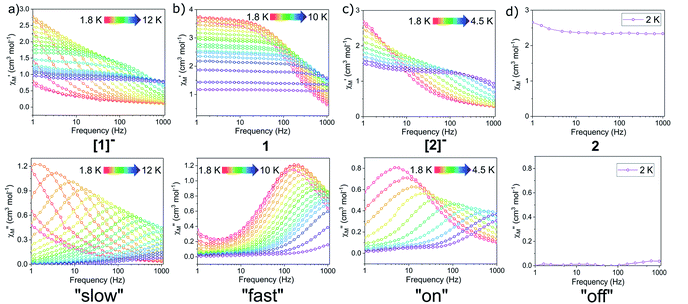
QTM between orthogonal Kramers ground states is typically caused by a perturbation Hamiltonian that allows for mixing of energetically close lying states. Examples of such perturbations include the presence of transverse anisotropy and dipole–dipole interactions between paramagnetic metal centres.55 To mitigate QTM in this series of compounds, various dc fields were applied during ac susceptibility measurements. Application of the static dc field lifts the degeneracy of the Kramers states, thereby reducing QTM. In the presence of a dc field, compounds [1]−, 1, and [2]− show clear evidence of slow relaxation of the magnetization, with a signal in the out-of-phase component (χ′′) observed within the ac frequency range of 1 to 1000 Hz (Fig. S18, S22 and S26†). Notably, the oxidized mixed-valent Er3+ compound 2 displayed no evidence of slow relaxation at any investigated temperature or field (Fig. S30†).
In the variable field ac measurements for [1]− at 5 K, a transition from a faster relaxation process to a slower relaxation process is observed around 300 Oe (Fig. S18†). An optimal static field of 1000 Oe was determined from the maximum (slowest relaxation) in the plot of the field dependence of τ (Fig. 7, inset, Fig. S20†). Therefore, variable temperature ac susceptibility measurements for [1]− were collected with a dc field of 1000 Oe (Fig. 6a). At 1000 Oe, the maxima of the out-of-phase signals (χ′′) are shifted to lower frequencies relative to the zero field measurements, as the reduction of QTM results in slower magnetic relaxation. Furthermore, with the application of the 1000 Oe dc field, the Arrhenius plot displays temperature dependence over the entire temperature regime (Fig. 7).
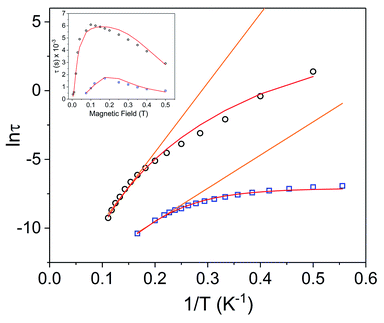 | ||
Fig. 7 Arrhenius plots for Dy3+ complexes [1]− (black circles) and 1 (blue squares) under 1000 Oe applied dc field. The orange lines represent fits of the linear regions to the expression τ−1 = τ0−1![[thin space (1/6-em)]](https://www.rsc.org/images/entities/char_2009.gif) exp(−Ueff/kBT) (Orbach only); resulting in Ueff values of 35.0 cm−1 (τ0 = 4.79 × 10⁻⁷ s) for [1]− and 16.8 cm−1 (τ0 = 5.79 × 10⁻⁷ s) for 1. Red lines represent fits of the entire temperature region to eqn (2), giving Ueff values of 46(2) cm−1 (τ0 = 7.3(7) × 10−7 s) for [1]− and 27.2(5) cm−1 (5.0(4) × 10−7 s) for 1. Inset: field dependence of the relaxation times (τ) for [1]− (black circles) and 1 (blue squares), red lines are fits to eqn (3). See Table S5† for all fitting parameters. exp(−Ueff/kBT) (Orbach only); resulting in Ueff values of 35.0 cm−1 (τ0 = 4.79 × 10⁻⁷ s) for [1]− and 16.8 cm−1 (τ0 = 5.79 × 10⁻⁷ s) for 1. Red lines represent fits of the entire temperature region to eqn (2), giving Ueff values of 46(2) cm−1 (τ0 = 7.3(7) × 10−7 s) for [1]− and 27.2(5) cm−1 (5.0(4) × 10−7 s) for 1. Inset: field dependence of the relaxation times (τ) for [1]− (black circles) and 1 (blue squares), red lines are fits to eqn (3). See Table S5† for all fitting parameters. | ||
Arrhenius plots (ln![[thin space (1/6-em)]](https://www.rsc.org/images/entities/char_2009.gif) τ vs. T−1) for the applied field measurements were fit using least squares regression to a model that accounted for multiple relaxation pathways, including direct, QTM, Raman, and Orbach (eqn (2)).
τ vs. T−1) for the applied field measurements were fit using least squares regression to a model that accounted for multiple relaxation pathways, including direct, QTM, Raman, and Orbach (eqn (2)).
 | (2) |
To avoid over-parameterization during fitting, the field dependence of τ was initially fit for the two field dependent processes, direct and QTM, to obtain the direct relaxation parameter A and the QTM parameters B1 and B2, according to eqn (3).53 Typically, n1 = 4 for Kramers ions in the absence of hyperfine interactions.54 Parameter D was added to account for the field independent contributions from Raman and Orbach relaxation processes.53 Parameters A, B1, B2, and D were treated as free fit parameters. All fitting parameters are listed in Tables S5 and S6.† For [1]− at 5 K, the very gradual decrease in τ values at fields above 1000 Oe suggests minimal contributions of single phonon direction relaxation mechanisms (Fig. 7, inset, Fig. S20†).53 At fields below 1000 Oe, the increase in τ with increasing field was modelled successfully by the QTM term.
 | (3) |
The parameters obtained from eqn (3) were held fixed while fitting the temperature dependent Arrhenius plots (ln![[thin space (1/6-em)]](https://www.rsc.org/images/entities/char_2009.gif) τ vs. T−1), according to eqn (2). For [1]−, the temperature dependence of τ was fit to direct, Raman, and Orbach relaxation processes (Fig. 7). Allowing the Raman exponent n2 to be a free fit parameter resulted in a value of n2 = 7. For Kramers ions, an n2 value of 9 is expected; however, lower n2 values may be anticipated if optical phonons are taken into consideration.53 A barrier height of Ueff = 46(2) cm−1 (τ0 = 7.3(7) × 10−7 s) was obtained; 18.7 cm−1 larger than the barrier calculated under zero dc field.
τ vs. T−1), according to eqn (2). For [1]−, the temperature dependence of τ was fit to direct, Raman, and Orbach relaxation processes (Fig. 7). Allowing the Raman exponent n2 to be a free fit parameter resulted in a value of n2 = 7. For Kramers ions, an n2 value of 9 is expected; however, lower n2 values may be anticipated if optical phonons are taken into consideration.53 A barrier height of Ueff = 46(2) cm−1 (τ0 = 7.3(7) × 10−7 s) was obtained; 18.7 cm−1 larger than the barrier calculated under zero dc field.
Variable field ac measurements for 1 at 2 K are displayed in Fig. S21–S22.† The field dependence of τ was fit for both direct and QTM processes according to eqn (3) (Fig. 7 (inset), Fig. S24†). A value of n1 = 2 was used to obtain a fit, corresponding to a Kramers ion in a hyperfine field.54,56 The maximum τ value (slowest relaxation) occurs at a field of 1750 Oe at 2 K. However, to maintain consistency with the ac measurements for [1]−, variable temperature ac measurements for 1 were carried out using a 1000 Oe dc field (Fig. 6b). The maxima of χ′′ for the mixed-valent compound 1 are shifted to higher frequencies relative to [1]−, implying faster magnetic relaxation for a given temperature of the mixed valent compound 1 (Fig. 6b). The Arrhenius plot was fit using eqn (2), accounting for direct, Raman, QTM and, Orbach processes, to give Ueff = 27.2(5) cm−1 (τ0 = 5.0(4) × 10−7 s) (Fig. 7). Notably, the Ueff for the mixed-valent species 1 is 18.8 cm−1 lower than the non-oxidized species [1]−. All fitting parameters for 1 are listed in Table S5.†
Redox switchability of the dynamic magnetic properties is best illustrated by comparing the relaxation times in the Arrhenius plot of [1]− and 1 (Fig. 7): the one-electron oxidation of [1]− to 1 results in faster relaxation times at a given temperature and a lower Ueff value.
Using the above described methodology, variable-field ac measurements were collected for the Er3+ compound [2]− at 2 K (Fig. S25–S27†). The field dependence of τ was successfully fit using eqn (3) (Fig. 8 (inset), Fig. S28, Table S6†). Variable temperature ac susceptibility data were collected using an applied field of 500 Oe (Fig. 6c). The corresponding relaxation times were fit over the entire temperature region of the Arrhenius plot (Fig. 8), according to eqn (2), resulting in an extracted value of Ueff = 29(2) cm−1 (τ0 = 4(1) × 10−7 s). The one-electron oxidized species, 2, did not display any signs of slow magnetic relaxation under dc fields as high as 1500 Oe in ac experiments (Fig. S30†).
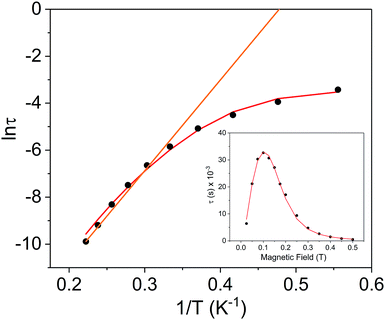 | ||
Fig. 8 Arrhenius plot for the Er3+ complex [2]− (black circles) under a 500 Oe applied dc field. The orange line represents the fit of the linear region (six highest temperature points) to the expression τ−1 = τ0−1![[thin space (1/6-em)]](https://www.rsc.org/images/entities/char_2009.gif) exp(−Ueff/kBT) (Orbach only); resulting in a Ueff value of 26.9 cm−1 (τ0 = 9.52 × 10⁻⁹ s). The red line represents fit of the entire temperature region to eqn (2), giving a Ueff value of 29(2) cm−1 (τ0 = 4(1) × 10−7 s). Inset: field dependence of the relaxation times (τ) for [2]− (black circles), red line is fit to eqn (3). See Table S6† for all fitting parameters. exp(−Ueff/kBT) (Orbach only); resulting in a Ueff value of 26.9 cm−1 (τ0 = 9.52 × 10⁻⁹ s). The red line represents fit of the entire temperature region to eqn (2), giving a Ueff value of 29(2) cm−1 (τ0 = 4(1) × 10−7 s). Inset: field dependence of the relaxation times (τ) for [2]− (black circles), red line is fit to eqn (3). See Table S6† for all fitting parameters. | ||
In summarizing the magnetic results, we find that the prolate Er3+ ion in the [2]−/2 system allows solely for reversible “on”/“off” switching of the slow magnetic relaxation (in the presence of a small dc field) (Fig. 6c and d), while the oblate Dy3+ ion in the [1]−/1 redox system enables bi-functional redox switchability of magnetic properties: “on”/“off” (no dc field) (Fig. 5) and “slow”/“fast” (with dc field) (Fig. 6a, b and 7).
The distinct shapes of f-electron density of Dy3+ (oblate) and Er3+ (prolate) result in very different magnetic anisotropy axes and therefore different magnetization dynamics under the same ligand field and molecular symmetry conditions. Previously, isostructural Dy3+ and Er3+ complexes have been shown to exhibit different magnetization dynamics. In the four-coordinate, trigonal pyramidal series of compounds [Li(thf)4][Ln{N(SiMe3)2}3Cl]·2 thf, the Er3+ analogue displayed SMM behaviour under zero dc field, whereas the Dy3+ analogue exhibited only field induced SMM behaviour.57–59 This difference was mainly attributed to the local symmetry and orientation of the magnetic anisotropic axis. The trigonal pyramidal geometry was found to not be ideal for either oblate or prolate ions but was relatively more favourable for prolate type ions, such as Er3+.59
The coordination geometry of the bis-diamidoferrocene complexes presented here was found to be relatively more favourable for the oblate Dy3+ ion than for the prolate Er3+ ion. The differences in behaviour between the Dy3+ and Er3+ complexes are attributed to the orientation of the anisotropy axis under the same ligand field conditions due to the difference in f-electron density. We believe the largest contributor to the change in magnetization dynamics upon oxidation to be the change in ligand field and lowering of local symmetry. In detail, the oxidation of one of the diamidoferrocene ligands (in going from [1]− and [2]− to 1 and 2) results in inequivalent binding of the two ligands to the central lanthanide ion. Additionally, packing effects and the presence or absence of counter ions may contribute to the structural changes.
The magnetic anisotropy axis of 1 was determined utilizing a quantitative electrostatic model for the prediction of the orientation of the ground state anisotropy axis in Dy3+ compounds described by Chilton et al. (MAGELLAN).60 Considering charged ligands as point charges, the method minimizes electrostatic repulsion between the point charges and f-electron density. Using the molecular structure of 1, the anisotropy axis was determined under three different scenarios: (1) assigning both Fe centres as neutral, (2) assigning a +1 charge to the Fe centre closer to the Dy3+ ion, and (3) assigning a +1 charge to the Fe centre further from the Dy3+ ion (Fig. S35†). The addition and location of the +1 point charge did not lead to considerable differences in the orientation of the anisotropic axis (Fig. S35†). The location of the negative point charges (amide ligands) was found to be the largest contributor, with the magnetic anisotropy axis aligned in the same plane as the shorter Dy–N bonds.
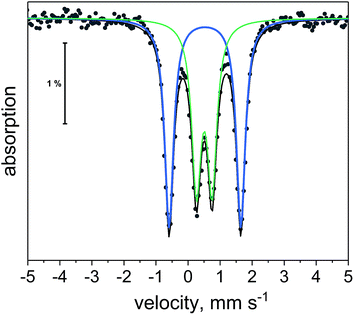 | ||
| Fig. 10 57Fe Mössbauer spectrum of 1 at 5 K. Black dots are experimental points. Black line is overall two-site fit. Blue and green lines are the individual sub-spectra for the two-site fit. | ||
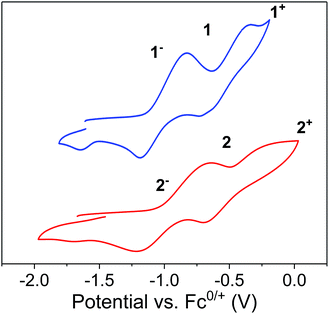
We utilized UV-vis-NIR absorption spectroscopy to probe the degree of electronic communication in solution. A broad band associated with an intervalence charge transfer (IVCT) transition was observed in the near-IR region of dilute thf solutions of the mixed-valent compounds 1 and 2 at λmax = 1056 nm and 1043 nm, respectively (Fig. S40 and S42†). This broad, low-energy IVCT band is indicative of electronic communication in solution and is consistent with a Class II system,63 supporting the observations from CV and 57Fe Mössbauer spectroscopy. Moreover, in solution, intermolecular communication is assumed to be negligible, indicating the presence of intramolecular electronic communication in these mixed valent systems. The UV-vis-NIR absorption spectra of [1]− and [2]− in thf displayed no bands in the NIR region (Fig. S39 and S41†).
Conclusions
Our studies highlight the utility of diamidoferrocene ligands in the construction of redox switchable SMMs. The high chemical reversibility of the Fe2+/3+ redox couples can be exploited to alter magnetization dynamics of Dy3+ and Er3+ based SMMs. The mixed valent Fe ions in complexes 1 and 2 feature electronic communication with each other. Importantly, redox-switchable “on”/“off” and “slow”/“fast” SMM behaviour can be obtained depending on the experimental conditions and the nature of the four-coordinate lanthanide ion. The combined results of this comprehensive molecular level study are important contributions towards the development of rational molecular design guidelines for future switchable magnetic molecules and materials.Experimental section
General considerations
All reactions and manipulations were carried out under anaerobic and anhydrous conditions in an argon filled glovebox (Vigor). All syntheses and manipulations were carried out using disposable plastic spatulas. Tetrahydrofuran (thf), hexanes, toluene and diethyl ether were dried and deoxygenated using a solvent purification system (JC Meyer Solvent Systems) and were stored over molecular sieves in an argon-filled glovebox. Anhydrous dysprosium(III) iodide and iodine were purchased from Alfa Aesar. Eicosane was purchased from Acros Organics. Sublimed anhydrous erbium(III) iodide was generously donated by Prof. Tim Hughbanks' group (Texas A&M). fc[HNSi(t-Bu)Me2]2 was prepared as previously described.39 Benzyl potassium was prepared via the deprotonation of toluene by nBuLi/KOtBu as described previously.64 UV-vis-NIR spectra were recorded using a Shimadzu SolidSpec-3700 spectrophotometer over a range of 300 nm to 2000 nm and matched screw-capped quartz cuvettes. Elemental analyses were carried out by Midwest Microlab (Indianapolis, IN).Experimental procedures
X-ray structure determination
Crystals suitable for X-ray diffraction were mounted on a nylon loop and placed in a cold N2 stream (Oxford) maintained at 110 K. A BRUKER APEX 2 Duo X-ray (three-circle) diffractometer was used for crystal screening, unit cell determination, and data collection. The X-ray radiation employed was generated from a Mo sealed X-ray tube (Kα = 0.70173 Å with a potential of 40 kV and a current of 40 mA). Bruker AXS APEX II software was used for data collection and reduction. Absorption corrections were applied using the program SADABS.65 A solution was obtained using XT/XS in APEX2.66–69 Hydrogen atoms were placed in idealized positions and were set riding on the respective parent atoms. All non-hydrogen atoms were refined with anisotropic thermal parameters. Absence of additional symmetry and voids were confirmed using PLATON (ADDSYM).70,71 The structure was refined (weighted least squares refinement on F2) to convergence.68,72 For 1, the Si4(C39–C44) group was found disordered between two positions and was modeled successfully with an occupancy ratio of 0.55![[thin space (1/6-em)]](https://www.rsc.org/images/entities/char_2009.gif) :
:![[thin space (1/6-em)]](https://www.rsc.org/images/entities/char_2009.gif) 0.45.
0.45.
Magnetic measurements
A representative procedure for the preparation of the samples for magnetic characterization is as follows. Crystalline sample was crushed up into a fine powder before loading into a high purity 7 mm NMR tube (Norell). A layer of eicosane was added to the tube, covering the sample. The tube was then flame sealed under vacuum. To restrain the sample, the sealed tube was placed in a water bath (39 °C) until the eicosane melted and was evenly distributed throughout the sample. The sample was loaded into a straw affixed to the end of the sample rod. Magnetic measurements were carried out using a Quantum Design MPMS 3 SQUID magnetometer (TAMU Vice President of Research). Dc susceptibility measurements were carried out over a temperature range of 1.8 to 300 K. Ac measurements were carried out using a 2 Oe switching field. Data was corrected for diamagnetic contributions from the straw, sample tube, eicosane and core diamagnetism using Pascal's constants.73 Cole–Cole plots were fitted to the generalized Debye equation using least-squares regression.52 Arrhenius plots and tau vs. H plots were fit using least squares regression.57Fe Mössbauer spectroscopy
Crystalline samples were loaded into a Teflon cup inside a glovebox and covered with a layer of paraffin oil. The cup was brought out of the glovebox and immediately stored frozen in liquid nitrogen until measured. Mössbauer spectra were collected on a model MS4 WRC low-field, variable temperature spectrometer (See Co., Edina, MN). Zero magnetic field spectra were obtained by removing the 500 G magnets from the exterior of the instrument. Temperatures were varied using a temperature controller on the heating coil on the sample holder. The instrument was calibrated using an α-Fe foil at room temperature. Obtained spectra were fitted using WMOSS software (See Co.).Electrochemistry
Cyclic voltammograms were measured in an argon filled glovebox (Vigor). Data were collected using a Gamry Instruments Reference 600 potentiostat with Gamry Framework software. Glassy carbon working electrode, 1 mm diameter Pt wire counter electrode, and silver-wire pseudo-reference electrode were used. Scan rates of 100 mV s−1 to 250 mV s−1 were used. Ferrocene was added at the end of each data collection and the ferrocene/ferrocenium couple was used as an internal standard.Conflicts of interest
There are no conflicts to declare.Acknowledgements
We acknowledge Tim Hughbanks and his group (Texas A&M) for anhydrous erbium(III) iodide. CMD acknowledges NSERC for fellowship support. MN is grateful to the TAMU Chemistry Department for start-up funds and financial support by the Welch Foundation (A-1880). 57Fe Mössbauer spectra were acquired on instruments housed in the Dr P. A. Lindahl research group (NIH, GM084266). We are grateful to Prof. Jodie Lutkenhaus, Shaoyang Wang and Yanpu Zhang (Texas A&M) for use of the spectrophotometer and assistance with the UV-vis-NIR measurements. The synthesis of fc[HNSi(t-Bu)Me2]2 was supported by NSF Grant 1362999 to Prof. Paula L. Diaconescu.Notes and references
- L. Bogani and W. Wernsdorfer, Nat. Mater., 2008, 7, 179–186 CrossRef CAS PubMed.
- M. Affronte, J. Mater. Chem., 2009, 19, 1731–1737 RSC.
- M. Mannini, F. Pineider, C. Danieli, F. Totti, L. Sorace, P. Sainctavit, M.-A. Arrio, E. Otero, L. Joly, J. C. Cezar, A. Cornia and R. Sessoli, Nature, 2010, 468, 417–421 CrossRef CAS PubMed.
- F. Troiani and M. Affronte, Chem. Soc. Rev., 2011, 40, 3119–3129 RSC.
- R. Vincent, S. Klyatskaya, M. Ruben, W. Wernsdorfer and F. Balestro, Nature, 2012, 488, 357–360 CrossRef CAS PubMed.
- D. Gatteschi, R. Sessoli and J. Villain, Molecular Nanomagnets, Oxford University Press, 2006 Search PubMed.
- R. A. Layfield and M. Murugesu, Lanthanides and Actinides in Molecular Magnetism, Wiley, 1st edn, 2015 Search PubMed.
- C. Benelli and D. Gatteschi, Introduction to Molecular Magnetism: From Transition Metals to Lanthanides, John Wiley & Sons, Inc., 1st edn, 2015 Search PubMed.
- R. Sessoli, D. Gatteschi, A. Caneschi and M. A. Novak, Nature, 1993, 365, 141–143 CrossRef CAS.
- R. Bagai and G. Christou, Chem. Soc. Rev., 2009, 38, 1011–1026 RSC.
- D. N. Woodruff, R. E. P. Winpenny and R. A. Layfield, Chem. Rev., 2013, 113, 5110–5148 CrossRef CAS PubMed.
- N. Ishikawa, M. Sugita, T. Ishikawa, S. Koshihara and Y. Kaizu, J. Am. Chem. Soc., 2003, 125, 8694–8695 CrossRef CAS PubMed.
- F.-S. Guo, B. M. Day, Y.-C. Chen, M.-L. Tong, A. Mansikkamäki and R. A. Layfield, Angew. Chem., Int. Ed., 2017, 56, 11445–11449 CrossRef CAS PubMed.
- Y.-S. Ding, N. F. Chilton, R. E. P. Winpenny and Y.-Z. Zheng, Angew. Chem., Int. Ed., 2016, 55, 16071–16074 CrossRef CAS PubMed.
- J. Liu, Y.-C. Chen, J.-L. Liu, V. Vieru, L. Ungur, J.-H. Jia, L. F. Chibotaru, Y. Lan, W. Wernsdorfer, S. Gao, X.-M. Chen and M.-L. Tong, J. Am. Chem. Soc., 2016, 138, 5441–5450 CrossRef CAS PubMed.
- K. L. M. Harriman, J. L. Brosmer, L. Ungur, P. L. Diaconescu and M. Murugesu, J. Am. Chem. Soc., 2017, 139, 1420–1423 CrossRef CAS PubMed.
- K. Suzuki, R. Sato and N. Mizuno, Chem. Sci., 2013, 4, 596–600 RSC.
- O. Sato, Nat. Chem., 2016, 8, 644–656 CrossRef CAS PubMed.
- T. Liu, H. Zheng, S. Kang, Y. Shiota, S. Hayami, M. Mito, O. Sato, K. Yoshizawa, S. Kanegawa and C. Duan, Nat. Commun., 2013, 4, 2826 Search PubMed.
- M. Nihei, Y. Okamoto, Y. Sekine, N. Hoshino, T. Shiga, I. P.-C. Liu and H. Oshio, Angew. Chem., Int. Ed., 2012, 51, 6361–6364 CrossRef CAS PubMed.
- E. M. Fatila, R. Rouzières, M. C. Jennings, A. J. Lough, R. Clérac and K. E. Preuss, J. Am. Chem. Soc., 2013, 135, 9596 CrossRef CAS PubMed.
- D. Pinkowicz, H. I. Southerland, C. Avendaño, A. Prosvirin, C. Sanders, W. Wernsdorfer, K. S. Pedersen, J. Dreiser, R. Clérac, J. Nehrkorn, G. G. Simeoni, A. Schnegg, K. Holldack and K. R. Dunbar, J. Am. Chem. Soc., 2015, 137, 14406–14422 CrossRef CAS PubMed.
- S. Fortier, J. J. Le Roy, C.-H. Chen, V. Vieru, M. Murugesu, L. F. Chibotaru, D. J. Mindiola and K. G. Caulton, J. Am. Chem. Soc., 2013, 135, 14670–14678 CrossRef CAS PubMed.
- D. E. Freedman, D. M. Jenkins, A. T. Iavarone and J. R. Long, J. Am. Chem. Soc., 2008, 130, 2884–2885 CrossRef CAS PubMed.
- J. Tong, S. Demeshko, M. John, S. Dechert and F. Meyer, Inorg. Chem., 2016, 55, 4362–4372 CrossRef CAS PubMed.
- X. Zhu, S. Su, W. Cao, Y. Wen, S. Hu, X. Wu and T. Sheng, Dalton Trans., 2017, 46, 7267–7272 RSC.
- G. N. Newton, S. Yamashita, K. Hasumi, J. Matsuno, N. Yoshida, M. Nihei, T. Shiga, M. Nakano, H. Nojiri, W. Wernsdorfer and H. Oshio, Angew. Chem., Int. Ed., 2011, 50, 5716–5720 CrossRef CAS PubMed.
- A. Nava, L. Rigamonti, E. Zangrando, R. Sessoli, W. Wernsdorfer and A. Cornia, Angew. Chem., Int. Ed., 2015, 54, 8777–8782 CrossRef CAS PubMed.
- L. Norel, M. Feng, K. Bernot, T. Roisnel, T. Guizouarn, K. Costuas and S. Rigaut, Inorg. Chem., 2014, 53, 2361–2363 CrossRef CAS PubMed.
- B. S. Dolinar, S. Gómez-Coca, D. I. Alexandropoulos and K. R. Dunbar, Chem. Commun., 2017, 53, 2283–2286 RSC.
- N. Ishikawa, M. Sugita, N. Tanaka, T. Ishikawa, S. Koshihara and Y. Kaizu, Inorg. Chem., 2004, 43, 5498–5500 CrossRef CAS PubMed.
- M. Gonidec, E. S. Davies, J. McMaster, D. B. Amabilino and J. Veciana, J. Am. Chem. Soc., 2010, 132, 1756–1757 CrossRef CAS PubMed.
- J. D. Rinehart, M. Fang, W. J. Evans and J. R. Long, Nat. Chem., 2011, 3, 538–542 CrossRef CAS PubMed.
- J. D. Rinehart, M. Fang, W. J. Evans and J. R. Long, J. Am. Chem. Soc., 2011, 133, 14236–14239 CrossRef CAS PubMed.
- I.-R. Jeon, J. G. Park, D. J. Xiao and T. D. Harris, J. Am. Chem. Soc., 2013, 135, 16845–16848 CrossRef CAS PubMed.
- A. I. Gaudette, I.-R. Jeon, J. S. Anderson, F. Grandjean, G. J. Long and T. D. Harris, J. Am. Chem. Soc., 2015, 137, 12617–12626 CrossRef CAS PubMed.
- N. Ishikawa, Y. Mizuno, S. Takamatsu, T. Ishikawa and S. Koshihara, Inorg. Chem., 2008, 47, 10217–10219 CrossRef CAS PubMed.
- M. R. Ringenberg, F. Wittkamp, U.-P. Apfel and W. Kaim, Inorg. Chem., 2017, 56, 7501–7511 CrossRef CAS PubMed.
- M. J. Monreal, C. T. Carver and P. L. Diaconescu, Inorg. Chem., 2007, 46, 7226–7228 CrossRef CAS PubMed.
- S. Duhović, J. V. Oria, S. O. Odoh, G. Schreckenbach, E. R. Batista and P. L. Diaconescu, Organometallics, 2013, 32, 6012–6021 CrossRef.
- E. M. Broderick, N. Guo, C. S. Vogel, C. Xu, J. Sutter, J. T. Miller, K. Meyer, P. Mehrkhodavandi and P. L. Diaconescu, J. Am. Chem. Soc., 2011, 133, 9278–9281 CrossRef CAS PubMed.
- X. Wang, A. Thevenon, J. L. Brosmer, I. Yu, S. I. Khan, P. Mehrkhodavandi and P. L. Diaconescu, J. Am. Chem. Soc., 2014, 136, 11264–11267 CrossRef CAS PubMed.
- S. M. Quan, X. Wang, R. Zhang and P. L. Diaconescu, Macromolecules, 2016, 49, 6768–6778 CrossRef CAS.
- M. Abubekerov, S. M. Shepard and P. L. Diaconescu, Eur. J. Inorg. Chem., 2016, 2016, 2634–2640 CrossRef CAS.
- W. Huang and P. L. Diaconescu, Inorg. Chem., 2016, 55, 10013–10023 CrossRef CAS PubMed.
- S. M. Shepard and P. L. Diaconescu, Organometallics, 2016, 35, 2446–2453 CrossRef CAS.
- S.-D. Jiang, B.-W. Wang, G. Su, Z.-M. Wang and S. Gao, Angew. Chem., Int. Ed., 2010, 49, 7448–7451 CrossRef CAS PubMed.
- R. A. Layfield, J. J. W. McDouall, S. A. Sulway, F. Tuna, D. Collison and R. E. P. Winpenny, Chem.–Eur. J., 2010, 16, 4442–4446 CrossRef CAS PubMed.
- T. Han, Y.-S. Ding, J.-D. Leng, Z. Zheng and Y.-Z. Zheng, Inorg. Chem., 2015, 54, 4588–4590 CrossRef CAS PubMed.
- C. Das, A. Upadhyay, S. Vaidya, S. K. Singh, G. Rajaraman and M. Shanmugam, Chem. Commun., 2015, 51, 6137–6140 RSC.
- Y. Rechkemmer, J. E. Fischer, R. Marx, M. Dörfel, P. Neugebauer, S. Horvath, M. Gysler, T. Brock-Nannestad, W. Frey, M. F. Reid and J. van Slageren, J. Am. Chem. Soc., 2015, 137, 13114–13120 CrossRef CAS PubMed.
- S. M. J. Aubin, Z. Sun, L. Pardi, J. Krzystek, K. Folting, L.-C. Brunel, A. L. Rheingold, G. Christou and D. N. Hendrickson, Inorg. Chem., 1999, 38, 5329–5340 CrossRef CAS.
- V. V. Novikov, A. A. Pavlov, Y. V. Nelyubina, M.-E. Boulon, O. A. Varzatskii, Y. Z. Voloshin and R. E. P. Winpenny, J. Am. Chem. Soc., 2015, 137, 9792–9795 CrossRef CAS PubMed.
- S. T. Liddle and J. van Slageren, Chem. Soc. Rev., 2015, 44, 6655–6669 RSC.
- D. Gatteschi and R. Sessoli, Angew. Chem., Int. Ed., 2003, 42, 268–297 CrossRef CAS PubMed.
- E. Lucaccini, L. Sorace, M. Perfetti, J.-P. Costes and R. Sessoli, Chem. Commun., 2014, 50, 1648–1651 RSC.
- A. J. Brown, D. Pinkowicz, M. R. Saber and K. R. Dunbar, Angew. Chem., Int. Ed., 2015, 54, 5864–5868 CrossRef CAS PubMed.
- P. Zhang, J. Jung, L. Zhang, J. Tang and B. Le Guennic, Inorg. Chem., 2016, 55, 1905–1911 CrossRef CAS PubMed.
- S. Kumar Singh, B. Pandey, G. Velmurugan and G. Rajaraman, Dalton Trans., 2017, 46, 11913 RSC.
- N. F. Chilton, D. Collison, E. J. L. McInnes, R. E. P. Winpenny and A. Soncini, Nat. Commun., 2013, 4, 1–7 Search PubMed.
- B. S. Brunschwig, C. Creutz and N. Sutin, Chem. Soc. Rev., 2002, 31, 168–184 RSC.
- J. M. Manriquez, M. D. Ward, W. M. Reiff, J. C. Calabrese, N. L. Jones, P. J. Carroll, E. E. Bunel and J. S. Miller, J. Am. Chem. Soc., 1995, 117, 6182–6193 CrossRef CAS.
- S. Patra, T. A. Miller, B. Sarkar, M. Niemeyer, M. D. Ward and G. K. Lahiri, Inorg. Chem., 2003, 42, 4707–4713 CrossRef CAS PubMed.
- P. J. Bailey, R. A. Coxall, C. M. Dick, S. Fabre, L. C. Henderson, C. Herber, S. T. Liddle, D. Loroño-González, A. Parkin and S. Parsons, Chem.–Eur. J., 2003, 9, 4820–4828 CrossRef CAS PubMed.
- G. M. Sheldrick, SADABS Program for Absorption Correction of Area Detector Frame, BRUKER AXS Inc., 5465 East Cheryl Parkway, Madison, WI, USA, 2000, pp. 53711–5373 Search PubMed.
- G. M. Sheldrick, Acta Crystallogr., Sect. A: Found. Crystallogr., 2008, 64, 112–122 CrossRef CAS PubMed.
- G. M. Sheldrick, Acta Crystallogr., Sect. C: Struct. Chem., 2015, 71, 3–8 CrossRef PubMed.
- XT, XS, BRUKER AXS Inc., 5465 East Cheryl Parkway, Madison, WI, USA, pp. 53711–5373 Search PubMed.
- APEX2 Program for Data Collection on Area Detectors, BRUKER AXS Inc., 5465 East Cheryl Parkway, Madison, WI, USA, pp. 53711–5373 Search PubMed.
- A. L. Spek, J. Appl. Crystallogr., 2003, 36, 7–13 CrossRef CAS.
- A. L. Spek, PLATON, University of Utrecht, The Netherlands, 2008 Search PubMed.
- O. V. Dolomanov, L. J. Bourhis, R. J. Gildea, J. A. K. Howard and H. Puschmann, J. Appl. Crystallogr., 2009, 42, 339–341 CrossRef CAS.
- G. A. Bain and J. F. Berry, J. Chem. Educ., 2008, 85, 532–536 CrossRef CAS.
Footnote |
| † Electronic supplementary information (ESI) available: Additional figures and tables. CCDC 1566080 and 1566081. For ESI and crystallographic data in CIF or other electronic format see DOI: 10.1039/c7sc03380j |
| This journal is © The Royal Society of Chemistry 2017 |

