
 Open Access Article
 This Open Access Article is licensed under a Creative Commons Attribution-Non Commercial 3.0 Unported Licence
Efficient cross-effect dynamic nuclear polarization without depolarization in high-resolution MAS NMR†
Frédéric
Mentink-Vigier
 a,
Guinevere
Mathies
b,
Yangping
Liu
c,
Anne-Laure
Barra
d,
Marc A.
Caporini
e,
Daniel
Lee
a,
Sabine
Hediger
a,
Robert
G. Griffin
b and
Gaël
De Paëpe
*a
a,
Guinevere
Mathies
b,
Yangping
Liu
c,
Anne-Laure
Barra
d,
Marc A.
Caporini
e,
Daniel
Lee
a,
Sabine
Hediger
a,
Robert
G. Griffin
b and
Gaël
De Paëpe
*a
aUniv. Grenoble Alpes, CEA, CNRS, INAC-MEM, F-38000 Grenoble, France. E-mail: gael.depaepe@cea.fr
bFrancis Bitter Magnet Laboratory, Department of Chemistry, Massachusetts Institute of Technology, Cambridge, MA 02139, USA
cTianjin Key Laboratory on Technologies Enabling Development of Clinical Therapeutics and Diagnostics, School of Pharmacy, Tianjin Medical University, Tianjin 300070, China
dLaboratoire National des Champs Magnétiques Intenses – CNRS, Univ. Grenoble Alpes, F-38042 Grenoble, France
eBruker BioSpin Corporation, 15 Fortune Drive, Billerica, MA 01821, USA
First published on 2nd October 2017
Abstract
Dynamic nuclear polarization (DNP) has the potential to enhance the sensitivity of magic-angle spinning (MAS) NMR by many orders of magnitude and therefore to revolutionize atomic resolution structural analysis. Currently, the most widely used approach to DNP for studies of chemical, material, and biological systems involves the cross-effect (CE) mechanism, which relies on biradicals as polarizing agents. However, at high magnetic fields (≥5 T), the best biradicals used for CE MAS-DNP are still far from optimal, primarily because of the nuclear depolarization effects they induce. In the presence of bisnitroxide biradicals, magic-angle rotation results in a reverse CE that can deplete the initial proton Boltzmann polarization by more than a factor of 2. In this paper we show that these depolarization losses can be avoided by using a polarizing agent composed of a narrow-line trityl radical tethered to a broad-line TEMPO. Consequently, we show that a biocompatible trityl-nitroxide biradical, TEMTriPol-1, provides the highest MAS NMR sensitivity at ≥10 T, and its relative efficiency increases with the magnetic field strength. We use numerical simulations to explain the absence of depolarization for TEMTriPol-1 and its high efficiency, paving the way for the next generation of polarizing agents for DNP. We demonstrate the superior sensitivity enhancement using TEMTriPol-1 by recording the first solid-state 2D 13C–13C correlation spectrum at natural isotopic abundance at a magnetic field of 18.8 T.
Introduction
Magic-angle angle spinning (MAS) NMR is a powerful method to obtain atomic resolution structures of many systems of chemical, biological, and physical interest. Unfortunately, the inherent low sensitivity of the method places limitations on the size and complexity of the structural studies for which it can be used.1 Dynamic nuclear polarization (DNP) represents an approach to address this sensitivity problem2–6 and in recent years DNP was successfully employed to answer structural questions in complex chemical and biological systems,7–15 and in materials science.16–23MAS-DNP NMR spectrometers typically rely on NMR probes compatible with operation under cryogenic conditions (80–100 K)24–26 and dedicated gyrotrons for the required high-frequency, high-power continuous microwave irradiation at frequencies up to 527 GHz.27–31 Paramagnetic polarizing agents are introduced into the NMR sample, usually in the form of stable free radicals such as bisnitroxides.32 Continuous microwave (μw) irradiation at or near the electron Larmor frequency (ω0S) induces the transfer of the large electron spin polarization to surrounding nuclear spins, generating 1H NMR signal enhancements up to a factor of 658.
The cross-effect (CE) mechanism33–37 is currently the most efficient way to enhance this nuclear polarization and as it requires two interacting electrons, biradicals are the polarizing agents of choice.38–43 The combination of CE and MAS generates the polarization transfer through a series of energy level crossings/anti-crossings (rotor events).44–46 Specifically, during the sample rotation the μw irradiation periodically generates a large polarization difference between the two electron spins and this polarization difference is periodically transferred to the nuclei during CE rotor events (where |ω0,Sa − ω0,Sb| ∼ |ωn|).44–46 However, recent contributions47–49 have also shown that the Boltzmann equilibrium nuclear polarization can be substantially depleted by the presence of bisnitroxide polarizing agents and sample spinning alone. For instance, 1H NMR signals at 9.4 T and 100 K from samples doped with bisnitroxides TOTAPOL39 and AMUPol42 show a decrease of the equilibrium intensity in the absence of μw irradiation and during MAS of ∼20 and ∼60% compared to an undoped sample, respectively.48 This phenomenon, called depolarization,47 corresponds to the CE mechanism in absence of μw irradiation and it has been shown to limit the DNP efficiency.48,49 Additionally, like most continuous-wave DNP mechanisms (with the recent exception of the Overhauser effect50), the CE efficiency decreases at higher magnetic fields.2,28,31,48,50,51 Although current bisnitroxide polarizing agents have provided success in a variety of challenging applications at moderate magnetic field (up to 10 T), the actual sensitivity gain at higher magnetic fields (14.1 and 18.8 T, corresponding to 600 and 800 MHz for 1H, respectively) is drastically decreased and thus directly compromises the study of more complex systems that require higher resolution.6,27–30,48,51
In this paper we show that the current sensitivity limitation at high magnetic field can be overcome through the use of heteroradical polarizing agents, e.g. trityl-nitroxide biradicals. Notably, we report unprecedented sensitivity gains that translate into one order of magnitude of additional time-savings compared to the best polarizing agents currently in use at 18.8 T (the highest magnetic field available to date for DNP). The improved NMR sensitivity achievable using TEMTriPol-1, a trityl-nitroxide biradical recently introduced by Mathies et al. (Fig. 1),51 is shown to enable the acquisition of the first natural isotopic abundance 2D 13C–13C correlation spectrum at very high magnetic field (18.8 T). Note that the natural isotopic abundance of 13C nuclei is 1.1% and that the corresponding sensitivity for this type of 2D experiment is thus reduced by a factor of 104 compared to 13C-labeled materials. This type of experiment, which provides direct access to atomic-scale spatial proximities and structural constraints (e.g. internuclear distances), was thus far not reported at such a high magnetic field.
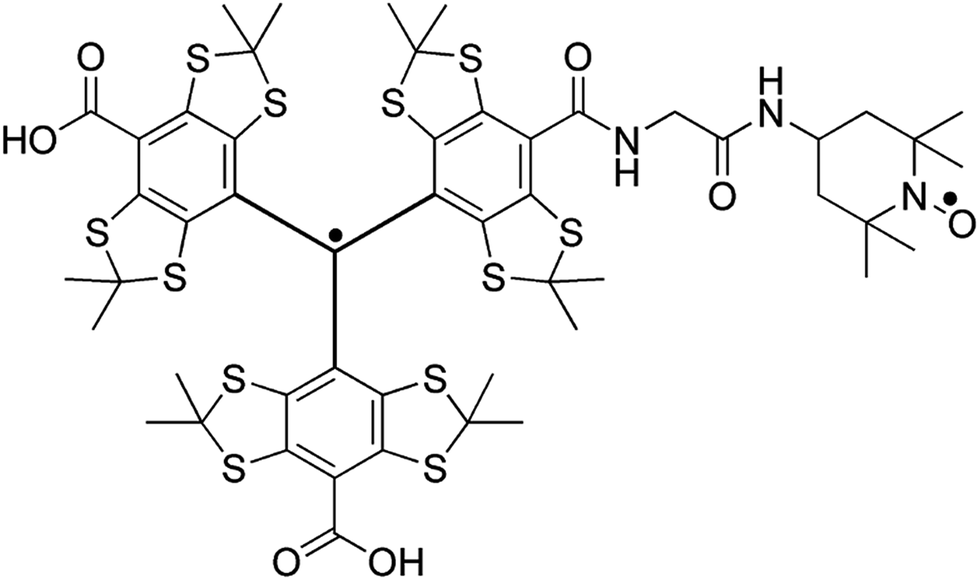 | ||
| Fig. 1 The molecular structure of TEMTriPol-1.52 The unpaired spin density of the trityl radical is highly delocalized and extends well into the linker with the nitroxide. The exchange interaction between the two unpaired electrons can therefore be modulated by changing the chemical structure of the linker.51,53,54 | ||
More specifically, we show that unlike the bisnitroxides currently in use for CE DNP (e.g. AMUPol, TOTAPOL),39,42 TEMTriPol-1![[thin space (1/6-em)]](https://www.rsc.org/images/entities/char_2009.gif) 51 does not produce an observable depolarization effect and yields the highest absolute polarization enhancement at 9.4, 14.1 and 18.8 T, for MAS frequencies up to 14 kHz. The rationale behind these observations is explained through the use of advanced numerical simulations. The absence of depolarization can be explained as a consequence of the EPR lineshapes (width and position) of the two electron spins within a trityl-nitroxide biradical: a narrow line from trityl and a broad pattern from TEMPO, with their isotropic g-values separated approximately by the 1H Larmor frequency. In absence of electron–electron coupling and upon spinning, the average electron polarization of each radical moiety tends towards its isotropic value which thus avoids 1H depolarization through CE. This polarization difference is maintained as long as inefficient electron–electron rotor events are minimized which is the case for TEMTriPol-1. The present study also explains the improved performance as a result of the combined effect of efficient CE rotor events, due to large exchange interactions (>10 MHz), and the ability to saturate narrow line radicals, like trityl, with less μw power even at high field and during fast spinning. In addition, high-frequency EPR of TEMTriPol-1 shows the presence of a broad distribution of exchange interactions, arising from a corresponding distribution of molecular conformations, which rationalizes why the efficiency of TEMTriPol-1 is preserved over a large field range, as previously observed by Mathies et al.51 This understanding of the performance of TEMTriPol-1 will undoubtedly lead to the design of new polarizing agents for high-field DNP/MAS NMR based on heteroradicals, bringing subsequent improvements and thus allowing detailed studies of systems with greater complexity.
51 does not produce an observable depolarization effect and yields the highest absolute polarization enhancement at 9.4, 14.1 and 18.8 T, for MAS frequencies up to 14 kHz. The rationale behind these observations is explained through the use of advanced numerical simulations. The absence of depolarization can be explained as a consequence of the EPR lineshapes (width and position) of the two electron spins within a trityl-nitroxide biradical: a narrow line from trityl and a broad pattern from TEMPO, with their isotropic g-values separated approximately by the 1H Larmor frequency. In absence of electron–electron coupling and upon spinning, the average electron polarization of each radical moiety tends towards its isotropic value which thus avoids 1H depolarization through CE. This polarization difference is maintained as long as inefficient electron–electron rotor events are minimized which is the case for TEMTriPol-1. The present study also explains the improved performance as a result of the combined effect of efficient CE rotor events, due to large exchange interactions (>10 MHz), and the ability to saturate narrow line radicals, like trityl, with less μw power even at high field and during fast spinning. In addition, high-frequency EPR of TEMTriPol-1 shows the presence of a broad distribution of exchange interactions, arising from a corresponding distribution of molecular conformations, which rationalizes why the efficiency of TEMTriPol-1 is preserved over a large field range, as previously observed by Mathies et al.51 This understanding of the performance of TEMTriPol-1 will undoubtedly lead to the design of new polarizing agents for high-field DNP/MAS NMR based on heteroradicals, bringing subsequent improvements and thus allowing detailed studies of systems with greater complexity.
Materials and methods
Sample preparation
TEMTriPol-1 was synthesized as described earlier.52,55,56 AMUPol was purchased from CortecNet, France. DNP experiments were performed on frozen solutions of 10 mM biradical in d8-glycerol:D2O:H2O 60:30:10 v/v/v with 1 or 2 M 13C-urea (as indicated in the text) (Cambridge Isotope Laboratories Inc., Andover, MA), packed into 3.2 mm sapphire rotors. For the cellulose sample, isotopic natural abundance (NA) microcrystalline cellulose powder from Sigma-Aldrich was impregnated with a 10 mM TEMTriPol-1, 2 M 13C-urea, d8-glycerol/D2O/H2O (60:30:10 v/v/v) solution (previously used to perform the measurements reported in Table 1) and packed into a 3.2 mm sapphire rotor.
| ε on/off | χ depo | χ bleach | ε abs | T B/s |
|
E | |
|---|---|---|---|---|---|---|---|
| Unless otherwise specified the biradical concentration was 10 mM and the sample contained 1 M 13C-urea.a Measured at ωr/2π = 10 kHz.b Measured at ωr/2π = 8 kHz.c Data from the series of experiments reported in Mentink-Vigier et al.48 using 12 mM AMUPol.d 2 M 13C-urea.e Data from the series of experiments reported in Mathies et al.51f χdepoχbleach = 0.36 and 0.54 for 14.1 and 18.8 T, respectively.g T1,undoped = 45 s.h T1,undoped = 65 s.i T1,undoped = 76 s.j T1,undoped = 86 s.k T1,undoped = 80 s. | |||||||
| 9.4 T/∼110 K | |||||||
| TEMTriPol-1 | 60 | 1 | 0.85 | 51 | 1.9 | 37 | 248g |
| AMUPolc,d | 190 | 0.4 | 0.79 | 60 | 2.9 | 35 | 284h |
|
|||||||
| 14.1 T/∼100 K | |||||||
| TEMTriPol-1e | 87 | 1 | 0.81 | 70 | 3.0 | 40 | 352i |
| AMUPole | 158 | 57 | 3.3 | 31 | 290j | ||
|
|||||||
| 18.8 T/∼125 K | |||||||
| TEMTriPol-1d | 51 | 1 | 0.84 | 43 | 6.6 | 17 | 152k |
| AMUPold | 19 | 10 | 6.5 | 4 | 37k | ||
MAS-DNP NMR spectroscopy
| εon/off = Ion(ωr)/Ioff(ωr) |
| εabs = Ion(ωr)/Iundoped = εon/offχbleachχdepo |
To facilitate the comparison between different polarizing agents, and independently of the DNP mechanism involved, the effective signal per unit square root of time should be compared, which can be done straightforwardly by calculating  (or
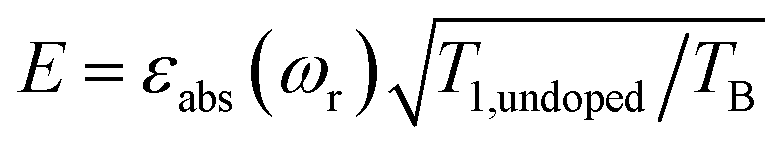
(or  ), where TB is the time constant for the build-up of nuclear polarization, measured on a doped sample.17 Alternatively, one can also use the “practical sensitivity gain”, E, introduced by Corzilius et al.57 With the definitions given above, E takes the following form
EPR spectroscopy – 285 GHz EPR
The 285 GHz continuous-wave (CW) EPR spectra were recorded at the Laboratoire National des Champs Magnétiques Intenses (LNCMI, Grenoble, France) on a custom-built CW EPR spectrometer.58,59 Spectra shown in Fig. 3 were obtained using double-pass transmission in Faraday configuration at a μw frequency of 285.00 GHz. The detection of absorption was performed with a hot electron InSb bolometer. The sample, a solution of 5 mM TEMTriPol-1 in d8-glycerol:D2O:H2O (60:30:10; v/v/v) with 1 M 13C-urea, was placed in a Teflon cup and inserted at liquid N2 temperature in the variable temperature insert of the superconducting magnet. The Teflon cup was filled over a height of about 8 mm, leading to a sample volume of about 30 μL. The temperature was measured with a Cernox resistor placed outside the modulation coil at the height of the sample. In this configuration, it is possible to detect heating due to the modulation. The temperature was maintained at 100 K, the field sweep rate was 0.30 mT s−1, with a field modulation of 0.4 mT. The μw power was carefully set to avoid saturation of the signal. Note that the presence of urea molecules has some effect on the EPR spectrum of TEMTriPol-1. Hence, to be consistent with the DNP experiments, the 285 GHz EPR spectrum of TEMTriPol-1 reported and analyzed here was recorded with ∼1 M urea in the DNP matrix.
MAS-DNP simulations
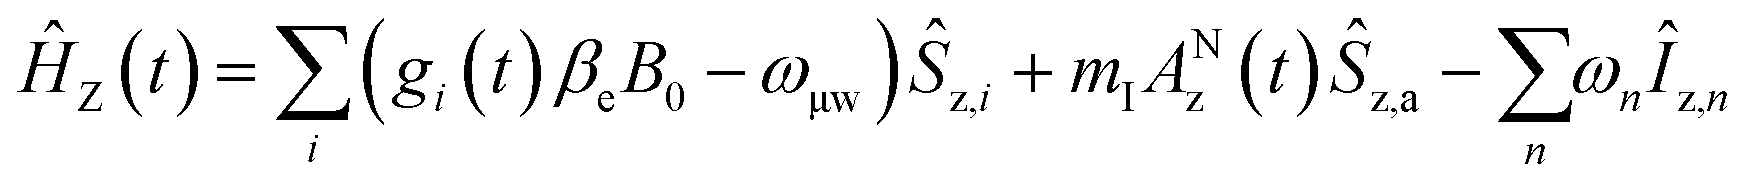
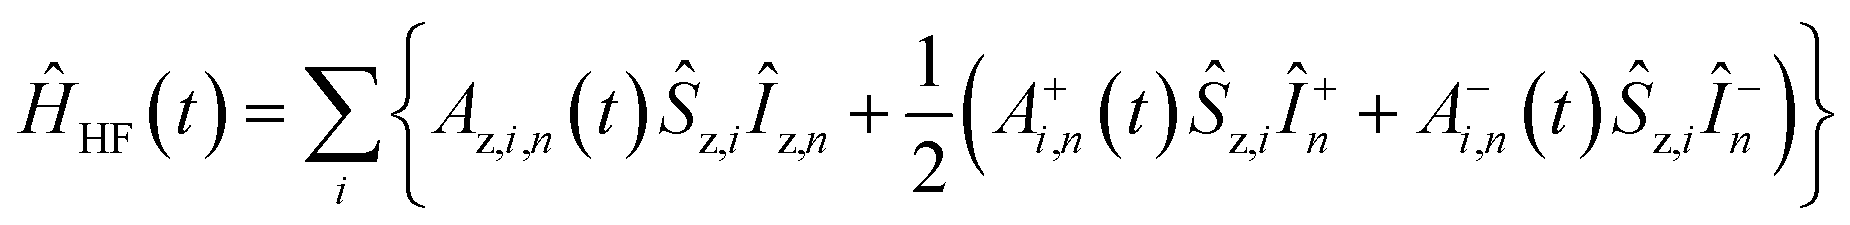
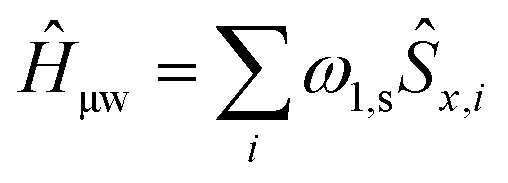
The MAS-DNP simulations were performed using the computational optimization approach described elsewhere.45,46,48 The spin systems are composed of two electrons and one proton {1H–ea–eb}. In the μw rotating frame, the time-dependent Hamiltonian can be written as:| Ĥ(t) = ĤZ(t) + ĤHF(t) + ĤD(t) + ĤJ + Ĥμw = Ĥ0(t) + Ĥμw |

| ĤJ = −2Ja,b(Ŝz,aŜz,b + 1/2(Ŝ+aŜ−b + Ŝ−aŜ+b)) |
where gi is the g-tensor value for electron i, ωμw the μw irradiation frequency, ANz the secular part of the hyperfine interaction between electron a (the nitroxide) and 14N, ωn the nuclear Larmor frequency, Ai,n the hyperfine coupling between electron i and nucleus n, Di,j the dipolar coupling between electrons i and j, and Ja,b the exchange interaction between electrons a and b (the nitroxide and trityl moieties, respectively). The μw Rabi frequency, ω1,s, is assumed to be small and is treated as a perturbation. Evolution superoperators are calculated as described in detail in ref. 46. The nuclear Boltzmann enhancement is then calculated as
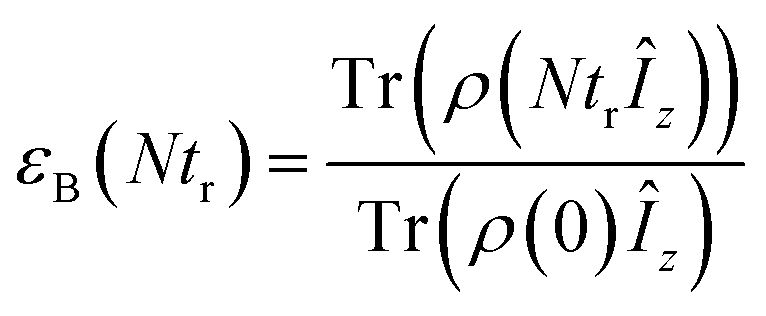 or the ratio between the steady state nuclear magnetization with μw irradiation, which we assume is achieved for Ntr ≥ 5T1,n, and the thermal equilibrium magnetization at t = 0. Powder averaging was performed over 144 crystal orientations using the ZCW sampling scheme.60–62 For each crystal orientation the nuclear quantum number mI of the 14N atom linked to electron a was randomly selected between the three possible values −1, 0, 1. The simulation code enables the computation of 4 types of energy-level crossings/anti-crossings, namely the μw, the electron–electron, the CE and the SE “rotor events”.44–46,48,49
The g-tensor principal values for the nitroxide and the trityl electron spin were set to ga = [gx, gy, gz] = [2.0098, 2.0064, 2.0024] and gb = [2.0034, 2.0031, 2.0027], respectively. The hyperfine coupling tensor between electron a and 14N was set to [ANx, ANy, ANz]/2π = [16, 15, 95] MHz expressed in the Principal Axis Frame. The coupling between the electrons and the 1H spin were assumed to be purely dipolar, with Aa,n/2π = 1 MHz and Ab/c,n/2π = 0 MHz. The conformation of TEMTriPol-1 in a frozen DNP matrix is unknown and therefore the relative orientations of the g and dipolar tensors were chosen arbitrarily. For transformation of the principal axis system of the g-tensor of electron a (nitroxide) onto the g-tensor of electron b (trityl) the Euler angles were set to Ωg,b = [90°, 90°, 90°]. Note that due to trityl's small g-anisotropy, this has negligible impact on the outcome of the calculations. The dipolar interaction was arbitrarily chosen to be aligned with the x-axis of the g-tensor of electron a, with ΩD(a,b) = [0°, 90°, 0] and the hyperfine coupling was aligned with the z-axis of the g-tensor of electron a, with ΩA(a,n) = [0°, 0°, 0°]. The μw irradiation strength was set to ω1,s/2π = 0.3 MHz. The longitudinal electron and nuclear relaxation time constants were set to T1,a = 0.3 ms (TEMPO), T1,b = 1 ms (trityl), T1,n = 4 s and the transverse relaxation time constants to T2,e = 4 μs and T2,n = 0.2 ms. For the nitroxide–nitroxide simulations, the dipolar coupling was set to 35 MHz, the exchange interaction to 15 MHz, the irradiation strength to ω1,s/2π = 0.85 MHz (ref. 63) and the T1,e to 0.5 ms. These values are close to those recently reported by Sauvée et al.64 All the calculations were conducted assuming a temperature of 100 K.
Simulation of the EPR spectra
Simulations of the 285 GHz CW EPR spectrum of TEMTriPol-1 were performed using the Easyspin EPR simulation toolbox.65 The spin system consisted of two electrons spins with two g-tensors characteristic of a nitroxide and a trityl radical, coupled via the exchange interaction, J. The presence of the 14N was accounted for by assuming a hyperfine coupling of [16, 15, 95] MHz in the nitroxide's g tensor frame. In the fitting procedure the g-tensor principal values, the relative g-tensor orientations, and the J-value were allowed to vary. In the TEMTriPol biradicals, the electron–electron dipolar interaction is small compared the exchange interaction and it was neglected in the fitting procedure. The linewidth was fixed at a combination of Gaussian and Lorentzian broadenings, both of 0.3 mT.A first fit was obtained using a Monte–Carlo procedure, which performs a series of random trial simulations and chooses the optimal one. Two components with different exchange interactions were included, for which the values of J and the relative contributions to the EPR spectrum were allowed to vary independently.
The best parameters obtained from this procedure yielded a library of EPR spectra calculated for different J-values ranging from 2 to 200 MHz in steps of 2 MHz. The g-tensor principal values were fixed to [gx, gy, gz] = [2.003(4), 2.003(0), 2.002(7)] for the trityl (gb) and [2.009(2), 2.006(0), 2.002(2)] for the nitroxide (ga) moieties, with a relative orientation of ga with respect to gb of Ωgb = [90°, 90°, −45°]. Note that the g values are not exact since the magnetic field in the EPR spectrum has not been precisely calibrated. The experimental spectrum was then simulated again with a Levenberg–Marquardt algorithm to find the optimal variance and relative weight of 7 Gaussian distributions centered around 7 randomly picked values of the exchange interaction. After 10000 random calculations, the best fit was selected.
Results and discussion
Absence of depolarization and DNP efficiency of TEMTriPol-1 at 9.4, 14.1, and 18.8 T
ε on/off and the depolarization contribution factor χdepo were determined as a function of ωr/2π for TEMTriPol-1 at 9.4 T, see Fig. 2a, and compared to those of AMUPol, see Fig. 2b. The ωr/2π ≤ 10 kHz dependence of εon/off for TEMTriPol-1 qualitatively resembles that of AMUPol. εon/off increases with the MAS frequency until it reaches a plateau around 5 kHz, then remains constant up to ωr/2π = 14 kHz. The bleaching contribution factor, χbleach, was measured as ≈0.85, in agreement with values measured for other frozen radical solutions with similar concentrations.48,57 However, the depolarization contribution factor, χdepo, for TEMTriPol-1 differs significantly from what has been previously observed for bisnitroxides.47,48 The contribution factor accounting for depolarization decreases with increasing MAS frequency to 0.4 for AMUPol at ωr/2π = 10 kHz (Fig. 2b) whereas for TEMTriPol-1, χdepo is constant at approximately 1 up to ωr/2π = 14 kHz (Fig. 2a). In other words, we do not observe depolarization for TEMTriPol-1 at 9.4 T. Also in experiments at higher magnetic fields (14.1 and 18.8 T) the integrated μw-OFF signal of the DNP matrix doped with TEMTriPol-1 remains constant from static conditions up to a MAS frequency of 14 kHz, which shows that the absence of depolarization is field independent, see Table 1.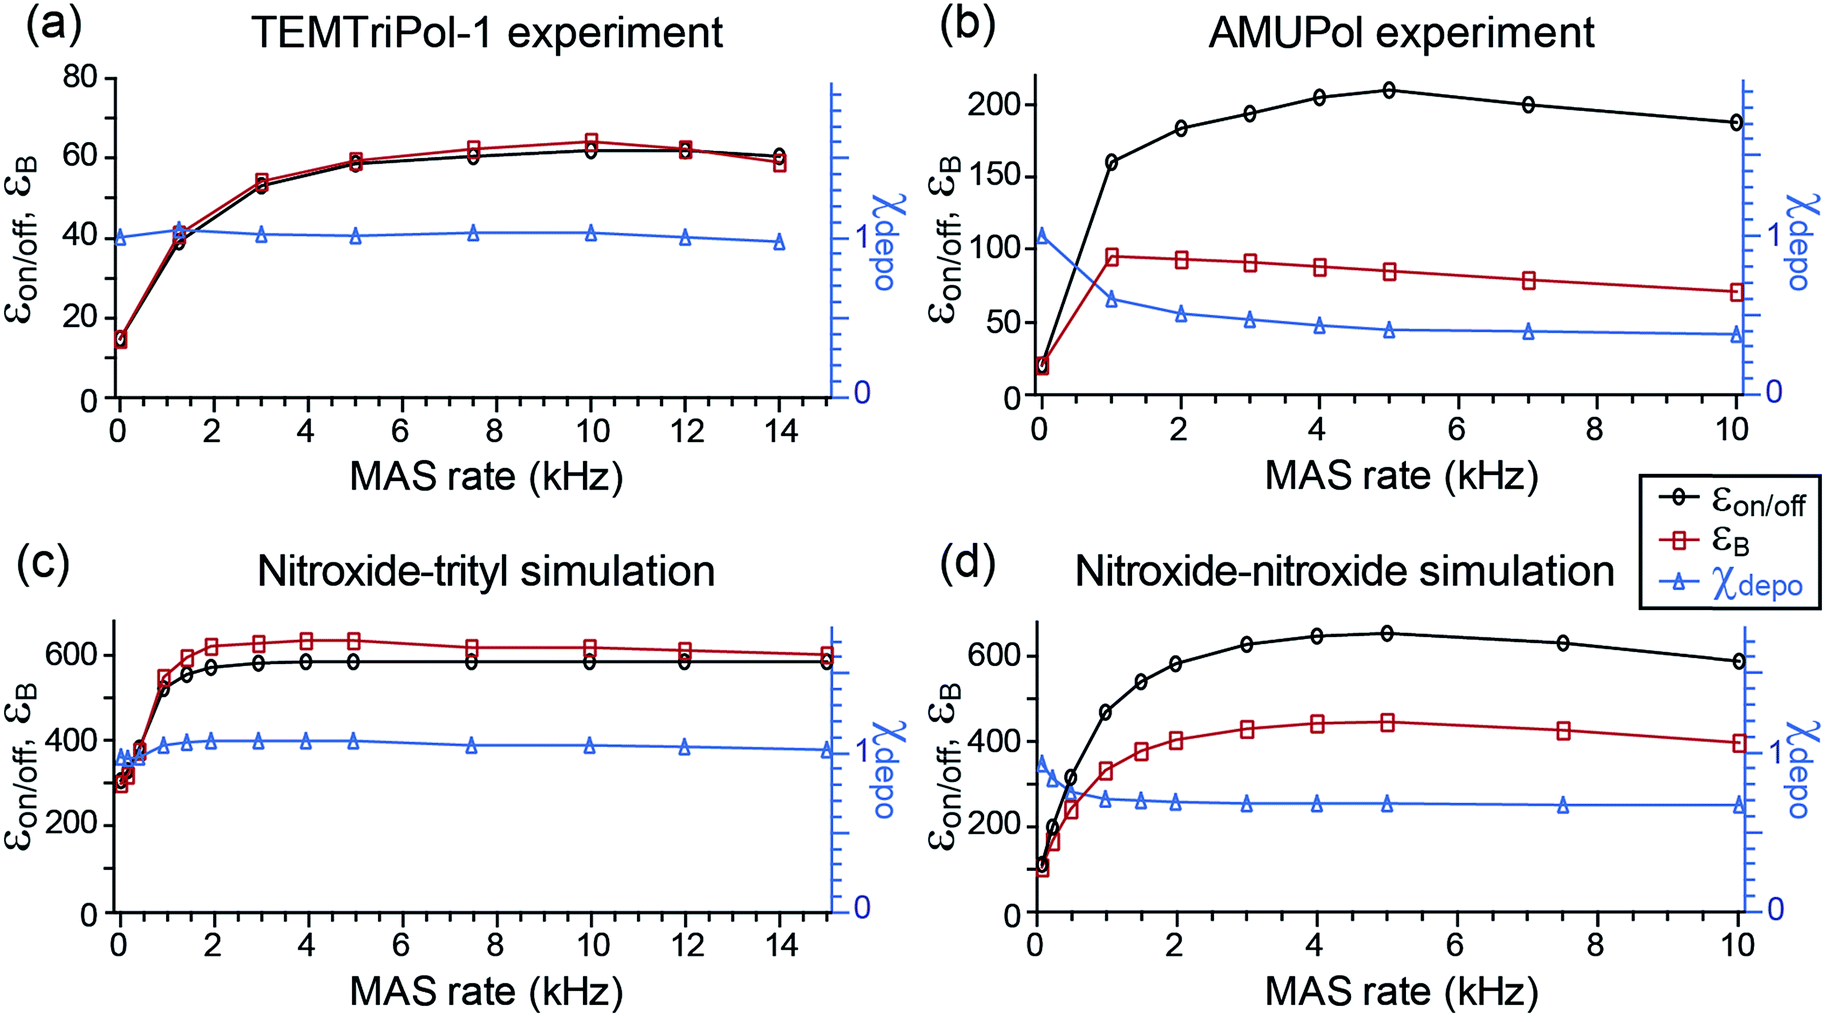 | ||
| Fig. 2 Experimental (a, b) and simulated (c, d) MAS frequency dependence of εon/off (left axis, black), εB (left axis, red), and χdepo (right axis, blue) for trityl-nitroxide (a, c) and nitroxide–nitroxide (b, d) based biradicals. Nuclear polarization was determined via the 1H signal integral. The μw frequency was 263.67 GHz and the magnetic field set to the position giving maximum 1H signal intensity. Experimental data from Mentink-Vigier et al.48 is reproduced here in (b) as a comparison to the data in (a). Definitions for εon/off, εB, and χdepo and. the biradical geometry are given in the Materials and method, For trityl-nitroxide Ja,b/2π = 30 MHz, Da,b/2π = 23 MHz, and for AMUPol, Ja,b/2π = 15 MHz and Da,b/2π = 35 MHz. | ||
The experimental results recorded at 9.4 T shown in Fig. 2a and b for TEMTriPol-1 and AMUPol, respectively, are compared to corresponding simulations in Fig. 2c and d. The simulations use the g-tensors as given in the Materials and methods section and average exchange interactions of 30 and 15 MHz, and dipolar couplings of 23 and 35 MHz for the trityl-nitroxide (TEMTriPol-1-type) and nitroxide–nitroxide (AMUPol-type) biradicals respectively. These qualitative simulations reproduce the absence of depolarization for the TEMTriPol-1-type biradical while showing the presence of depolarization for the AMUPol-type bis-nitroxides. Furthermore, the TEMTriPol-1-type biradical accordingly shows a theoretical nuclear Boltzmann enhancement, εB, that remains at the maximum value when increasing the MAS frequency above 5 kHz, whereas εB decreases with increasing MAS frequency in this regime for the AMUPol-type biradical, as illustrated earlier.48 Note that the simulated nuclear Boltzmann enhancements are larger than the corresponding experimental values owing to the model 3-spin system used in the simulations; the inclusion of a large number of coupled nuclei is required to produce values closer to those found experimentally.49 The presence or absence of depolarization effect (depending on the biradical) is rationalized in the section: Absence of depolarization and the CE DNP efficiency.
With these observations of differing depolarization effects in mind, we reevaluated the CE DNP efficiencies of TEMTriPol-1 and AMUPol as shown in Table 1. For AMUPol at 9.4 T the absolute signal gain, εabs, decreases linearly from 75 to 60 when ωr/2π increases from 1 to 10 kHz. For TEMTriPol-1 εabs increases with ωr/2π to stabilize at a value of 51 above 5 kHz.
Thus, despite the large “enhancement” value of AMUPol based on εon/off values (190 for AMUPol, 60 for TEMTriPol-1; see Table 1), the absolute signal gain of TEMTriPol-1 is actually close to that of AMUPol. Moreover, if the polarization build-up time is taken into account, then a comparison of the absolute signal gain per unit square root of time (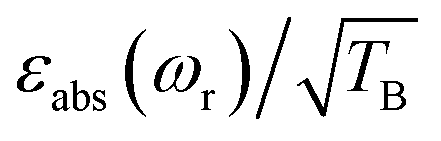 ) between polarizing agents shows that TEMTriPol-1 is just as efficient as AMUPol at 9.4 T and under typical cryogenic DNP conditions (T ∼ 100 K), see Table 1. Due to the absence of depolarization for TEMTriPol-1, εabs is preserved at MAS frequencies up to 14 kHz and we therefore expect that TEMTriPol-1 will become even more pertinent than AMUPol for high sample spinning frequency (>15 kHz) applications. The preservation of a large εabs for TEMTriPol-1 at high MAS frequencies persists at higher magnetic fields. Significantly, the superiority, which is given by the absolute signal gain per unit square root of time, of TEMTriPol-1 over AMUPol increases with the magnetic field (see Table 1). This is also expressed in the practical enhancement factor E reported in the right column. Note that the amount of nuclear depolarization has been observed to decrease with AMUPol with increasing magnetic field strength48 but that it is still substantial (cf. χdepoχbleach = 0.54 and 0.84 for AMUPol and TEMTriPol-1, respectively, at 18.8 T and 10 kHz MAS rate).
EPR experiments and analysis
Fig. 3 shows the experimental CW EPR spectrum of TEMTriPol-1 recorded at 285 GHz (10.2 T). The spectrum shows features around 10.137, 10.151, and 10.175 T that arise from the broad powder pattern of the TEMPO moiety and correspond to the principal values gx, gy, and gz, respectively. The strong resonance around 10.165 T arises from the trityl moiety. This resonance has broadened compared to the resonance expected for isolated trityl,51,66 presumably due to interaction with the TEMPO radical. Upon closer inspection two resonances are apparent, a relatively narrow component and a broader one, which is most apparent from the shoulder at 10.162 T, possibly corresponding to two different values of the exchange interaction.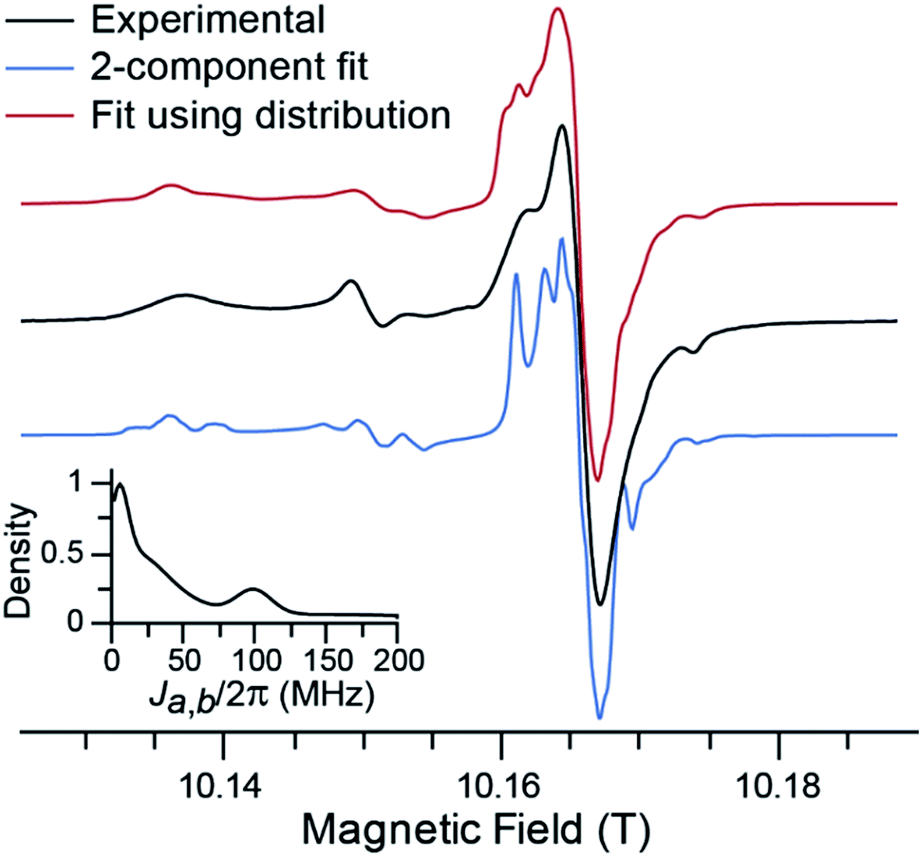 | ||
| Fig. 3 Black curve: experimental 285.0 GHz CW EPR spectrum of 5 mM TEMTriPol-1 in DNP matrix recorded at 100 K. Blue curve: simulation assuming the presence of two conformations with J-values of 10 and 80 MHz. Red curve: simulation assuming a continuous distribution of J-values. This distribution in Ja,b is shown in the inset. | ||
In simulating the 285 GHz EPR spectrum of TEMTriPol-1, we were not able to obtain a reasonable match with the experiment when considering a single trityl-TEMPO conformation. This was observed earlier by Mathies et al. for TEMTriPol-1 and the other members of the TEMTriPol biradical family.51 The quality of the fit is improved by introducing a second exchange interaction component, see Fig. 3, blue curve. Both the narrow and the broader component in the trityl region of the spectrum are now reproduced. The agreement is further improved by accounting for a broad distribution of J-values ranging from 10 to 200 MHz as illustrated in the red curve and the inset in Fig. 3.
The estimated value of 73 MHz for the exchange interaction of TEMTriPol-1 reported earlier51,52 was based on the line splitting in the solution X-band EPR spectrum. This splitting reflects the dynamic average exchange interaction of all conformations while in frozen solution the conformations are rigid resulting in a broad distribution of conformations of TEMTriPol present in the sample. It is thus important to keep in mind that EPR parameters determined at room temperature in solution are not necessarily relevant for DNP under cryogenic conditions.
As discussed in detail by several groups, the description of the EPR spectrum of a biradical depends on 7 independent variables,67–69 namely the Euler angles for relative orientations of the g-tensors, α, β, γ, the relative orientation of the dipolar tensor, η and ξ, the strength of the dipolar interaction, Da,b, and the exchange interaction, Ja,b. For the TEMTriPol biradicals, this situation is complicated further by the presence of a distribution of conformations. Obtaining the values of all these parameters as well as a reliable distribution would require at least a multi-frequency EPR approach in combination with an advanced fitting routine, which is beyond the scope of this work. Consequently, the shape of the distribution and other fitting parameters (see Table S1†) obtained here should not be over-interpreted. The essential information reported here is the existence of a broad distribution of exchange interactions for TEMTriPol-1 when it is frozen in a glycerol/water glass at 100 K.
Microwave power dependence
The dependence of the enhancement factor on μw power was measured for TEMTriPol-1 at two field positions (see Fig. 4a). The first position, 9.404 T, corresponds to the maximum positive enhancement, and roughly to the e− resonance of a trityl radical. In this case, the enhancement factor reaches a maximum for a gyrotron output power of 25 W and then gradually decreases as the μw power is further increased. The second position, 9.390 T, corresponds to the maximum negative enhancement, i.e. roughly the gy-value of a nitroxide radical. In this case, the enhancement factor is much smaller and steadily increases with the gyrotron output power up to 50 W.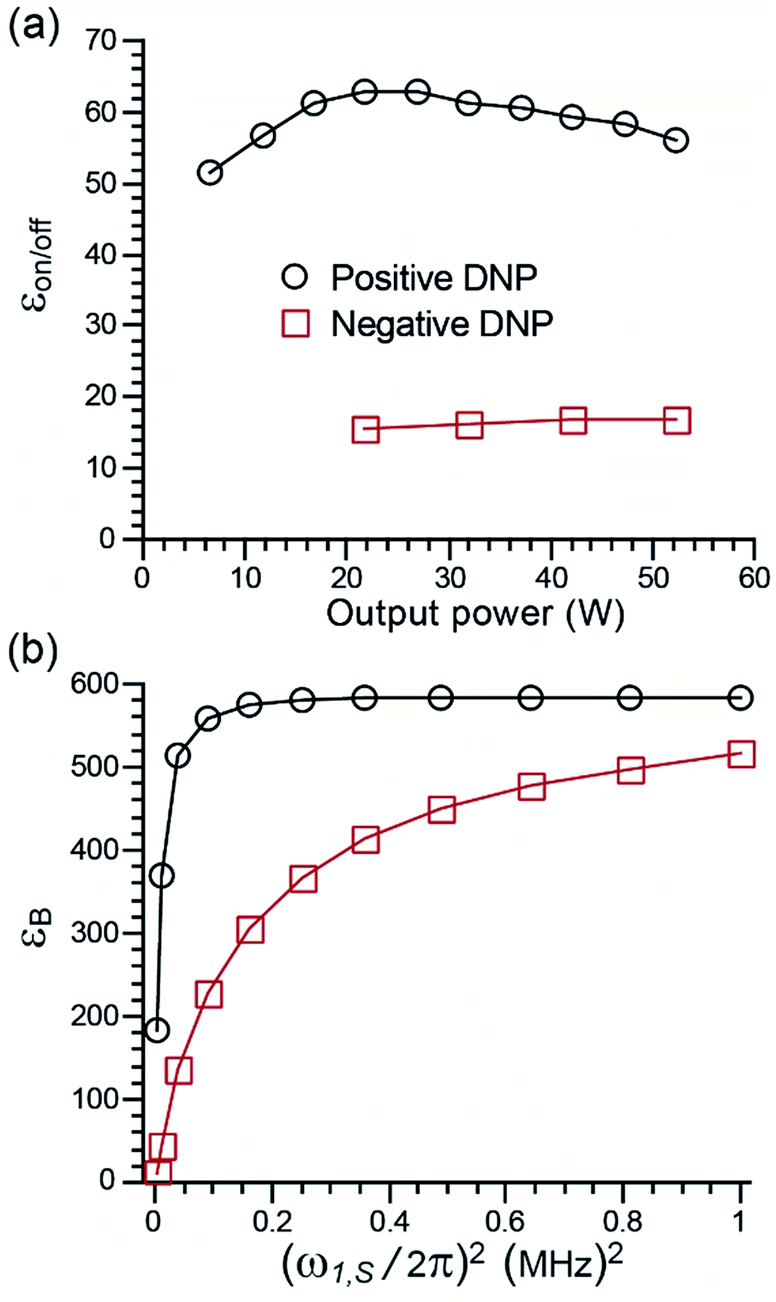 | ||
| Fig. 4 (a) Experimental μw power dependence of εon/off for TEMTriPol-1 and (b) simulated μw power dependence at ∼9.4 T. Black circles: correspond to the field position of maximum positive enhancement, red squares correspond to the field position of maximum negative enhancement. The experimental output microwave power was adjusted by changing the gyrotron collector current from 30 to 75 mA. Simulations were performed with an exchange interaction of Ja,b/2π = 30 MHz. | ||
On the same instrument, the enhancement with AMUPol was found to be highest with a gyrotron output power of 50 W, which corresponds to an increase in power of 100% compared to the case of TEMTriPol-1. The μw rotor events, which occur when the e− frequency matches the μw frequency, are more efficient for a narrow-line radical like trityl than for a broader nitroxide.44–46 This allows easier saturation of the trityl transitions for trityl-nitroxide (as compared to a nitroxide–nitroxide) and hence maximizes the polarization difference between the two electrons of the biradical. Moreover, the presence of a narrow-line radical improves the efficiency of the CE rotor events (for a given electron–electron dipolar coupling or exchange interaction) resulting in fast and efficient polarization build-up to the surrounding nuclei.
The corresponding simulations (dependence of εB as a function of μw irradiation strength, Fig. 4b) are in qualitative agreement with experiments and previously published results.44,46 The maximum enhancement reaches a plateau more rapidly when the irradiation takes place on the trityl resonance compared to the nitroxide resonance. The simulations also predict similar enhancements for both positions in the limit of strong μw irradiation. This was not observed experimentally because of the power limitation of the μw source and because the application of high power μw leads to excessive sample heating, which decreases the DNP efficiency. Thus, the presence of a narrow line radical such as trityl accounts for the relatively low μw power required for efficient CE DNP in TEMTriPol-1.
DNP Zeeman field profiles, simulations, and the effect of a distribution of J-values
Fig. 5 shows experimental DNP Zeeman field profiles and the corresponding simulations for TEMTriPol-1 at 5.0, 9.4, 14.1, and 18.8 T. The simulations include several cases where either only one J exchange interaction is considered (Ja,b/2π = 10, 70, 140 MHz) or a distribution of J values is used (see EPR experiments and analysis section for details).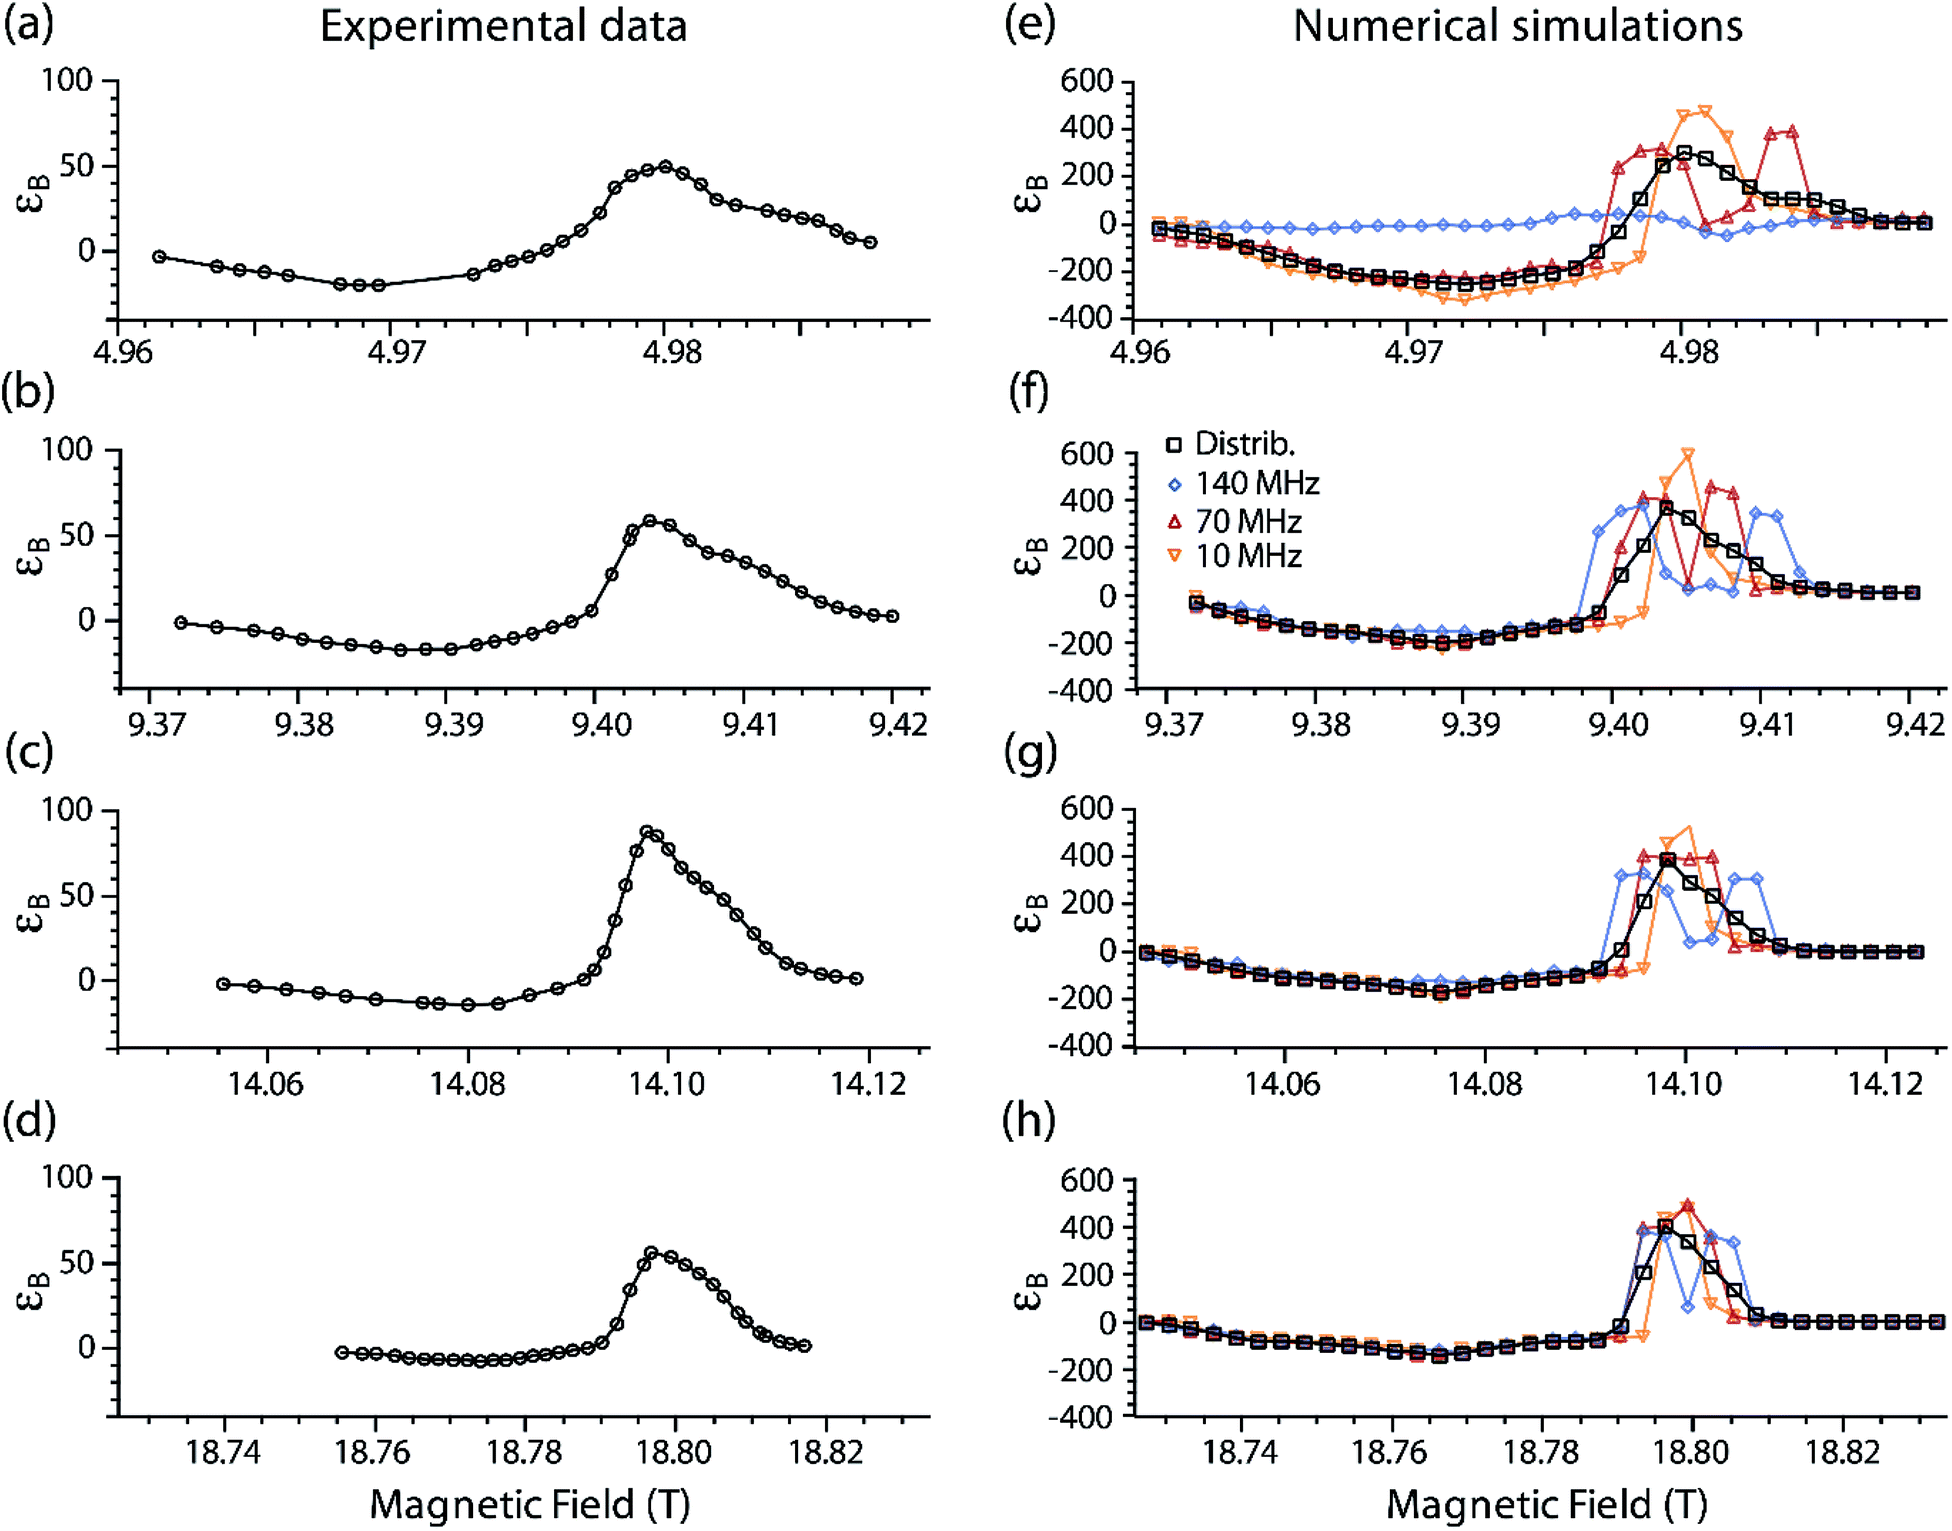 | ||
| Fig. 5 Simulated and experimental DNP Zeeman field profiles for TEMTriPol-1 in frozen glycerol/water at four different magnetic fields (μw frequencies/1H Larmor frequency): (a, e) 5 T (139.60 GHz/212 MHz), (b, f) 9.4 T (263.67 GHz/400 MHz), (c, g) 14.1 T (395.30/600 MHz), and (d, h) 18.8 T (527.04 GHz/800 MHz). The experiments are displayed on the left-hand side and the corresponding simulations on the right-hand side. The black squares correspond to simulations that use the distribution of exchange interactions obtained from a fit to the 285 GHz EPR spectrum of TEMTriPol-1 (see insert of Fig. 3). The other data correspond to simulations with a single value of the exchange interaction: Ja,b/2π = 10 MHz (orange upside down triangles), 70 MHz (red upright triangles), and 140 MHz (blue diamonds). The trityl linewidth was taken to be 9 MHz T−1, which corresponds to 45 MHz at 5 T (a), 85 MHz at 9.4 T (b), 127 MHz at 14.1 T (c), and 169 MHz at 18.8 T (d). Note that 0.1 mT corresponds to about 2.8 MHz. | ||
For instance, Fig. 5b shows the experimental DNP Zeeman field profile for TEMTriPol-1 at 9.4 T (263.67 GHz/400 MHz). The largest enhancement, εon/off ∼ 60, is observed at a pronounced optimum at 9.404 T, on resonance with the trityl moiety. A shoulder (around 9.410 T) is clearly observed on the high-field side of this optimum, and at lower magnetic field, the enhancement becomes negative. The negative enhancement maximum is broader and more modest, εon/off ∼ −17. The overall shape of the profile is consistent with the field profiles reported earlier at 5.0, 14.1 and 18.8 T, reproduced here for convenience in Fig. 5a, c and d.51 As the static magnetic field increases, the ratio |ε+on/off,max|/|ε−on/off,max| increases along with it (2.5, 3.5, 5.8, and 8.1, respectively). The positive enhancement peak narrows as the field increases, the shoulder on the high-field side nevertheless remains discernable.
Fig. 5e–h illustrates simulations of the experimental field profiles at 5.0, 9.4, 14.1, and 18.8 T of TEMTriPol-1. Details and parameters of these simulations are provided in the Materials and Methods section. A quick comparison between the left and the right column allows concluding that single J-value simulations are not sufficient to reproduce the experimental results for any magnetic field. The situation is different when the broad distribution of J exchange interaction (0–130 MHz), obtained from the 285 GHz EPR spectrum of TEMTriPol-1 (Fig. 3), is considered. In this case, the simulations reproduce the shapes of the experimental field profiles reasonably well, including the increase of |ε+on/off,max|/|ε−on/off,max| with the field and the high-field shoulder.
The quantitative agreement between the simulations and the experiments is less satisfactory. The maxima of the simulated εB factors are higher than the experimental values at all magnetic fields. Considering the current model, this is not surprising. The simulations report the transfer of polarization for an ensemble of coupled electron–electron–1H spin systems, i.e. polarization is transferred to a single dipolar coupled 1H, whereas in reality there is a gradual transfer via multiple interacting 1H to the bulk 1H.49 The value for T1n used here (4 s) at all magnetic fields was chosen because it represents the long T1n limit of nearby nuclei, whereby the T1n is not the dominating factor in the final polarization (see Fig. ESI1†). However, realistically the T1n of 1H close to electrons will probably be shorter.49 This makes the simulations, compared to the experiments, more forgiving towards inefficient or slow polarization transfer to the 1H.
When the J exchange interaction is small compared to the EPR linewidth of the trityl component (dominated by g-anisotropy, 8–9 MHz T−1),66 the DNP Zeeman field profile is similar to the profile reported by Hu et al. for a mixture of trityl and nitroxide monoradicals, with a narrow positive DNP enhancement peak at the position of the trityl resonance.38 This is the case for Ja,b/2π = 10 MHz (orange upside down triangles) for all the magnetic fields considered here. When J increases, the positive enhancement peak broadens and eventually splits, roughly when J becomes larger than half the trityl EPR linewidth (e.g. red triangles in Fig. 5e). The presence of high J values changes the resonance matching condition but also gradually decreases the CE DNP efficiency. Note that the latter is not possible when |Da,b + 2Ja,b|/2π ≥ (ωn,H/2π), as first noted by Van Houten et al.,70 and that the DNP enhancement will then arise solely from two inefficient SE processes for each of the split trityl resonances (see Fig. 5e, blue diamonds).
The Zeeman experimental field profiles for TEMTriPol-1 in Fig. 5 are determined by the broad distribution of J values and their shape as well as their field dependence can be understood with the aid of the simulated single J-value field profiles. The shoulder on the high-field side of the enhancement optimum comes from molecular conformations with a strong exchange interaction, presumably the 100 MHz mode in the J-distribution (see the inset in Fig. 3). The narrowing of the positive-enhancement optimum and the increase in the ratio |ε+on/off,max|/|ε−on/off,max| with increasing magnetic field is directly determined by the exchange interaction values relative to the increasing line width of trityl (dominated by g-anisotropy). At 5.0 T, and to a lesser extent at 9.4 T, the TEMTriPol-1 conformations with the strongest exchange interactions do not contribute to CE DNP, because 2Ja,b/2π ≥ (ωn,H/2π), or only weakly because J is large compared to the trityl linewidth. When the magnetic field is increased, the proportion of TEMTriPol-1 conformations that contribute effectively to the CE DNP enhancement increases, which explains the experimentally observed increase in enhancement for TEMTriPol-1 from 5.0 to 9.4 to 14.1 T. Thus, the broad J distribution (from 0 to 125 MHz) for TEMTriPol-1 explains the biradical's continued performance at higher magnetic fields, as more conformations begin to contribute to the DNP. This increase in enhancement is eventually capped at 18.8 T by a decreasing CE efficiency, as discussed in the next section.
Absence of depolarization and the CE DNP efficiency
Hyperpolarization and depolarization in CE DNP are the result of a difference between the nuclear polarization, Pn, and the difference in polarization of the two electronic spins, |Pa − Pb|. During the course of the sample rotation, the cross-effect matching condition |ω0,Sa − ω0,Sb| ≈ |ωn| is periodically fulfilled. During these cross-effect rotor events, the electron-nuclear dipolar coupling together with the electron–electron coupling, which can be a dipolar coupling or the exchange interaction, enable a polarization transfer between Pn and |Pa − Pb|, with an interaction coefficient proportional to |Da,b + 2Ja,b|Aa,n/ωn.45–47,49,71 Polarization equilibration occurs in the limit of the longitudinal relaxation. Each crystal orientation may experience depolarization or hyperpolarization, depending on whether its Boltzmann nuclear polarization Pn(0) is larger or smaller than |Pa − Pb|, respectively, at the time of a CE rotor event. To illustrate the difference between bis-nitroxides and trityl-nitroxides, we calculated the electron and nuclear polarizations Pa, Pb, Pn at “quasi periodic steady state” after equilibration for >5T1,nwithout μw irradiation for 144 crystallite orientations and for three different dipolar coupling strengths, Da,b. The average values of the electron polarizations Pa, Pb, and the maximum electron polarization difference relative to the initial nuclear polarization, |Pa − Pb|max/Pn(0), are plotted in Fig. 6a–f, respectively.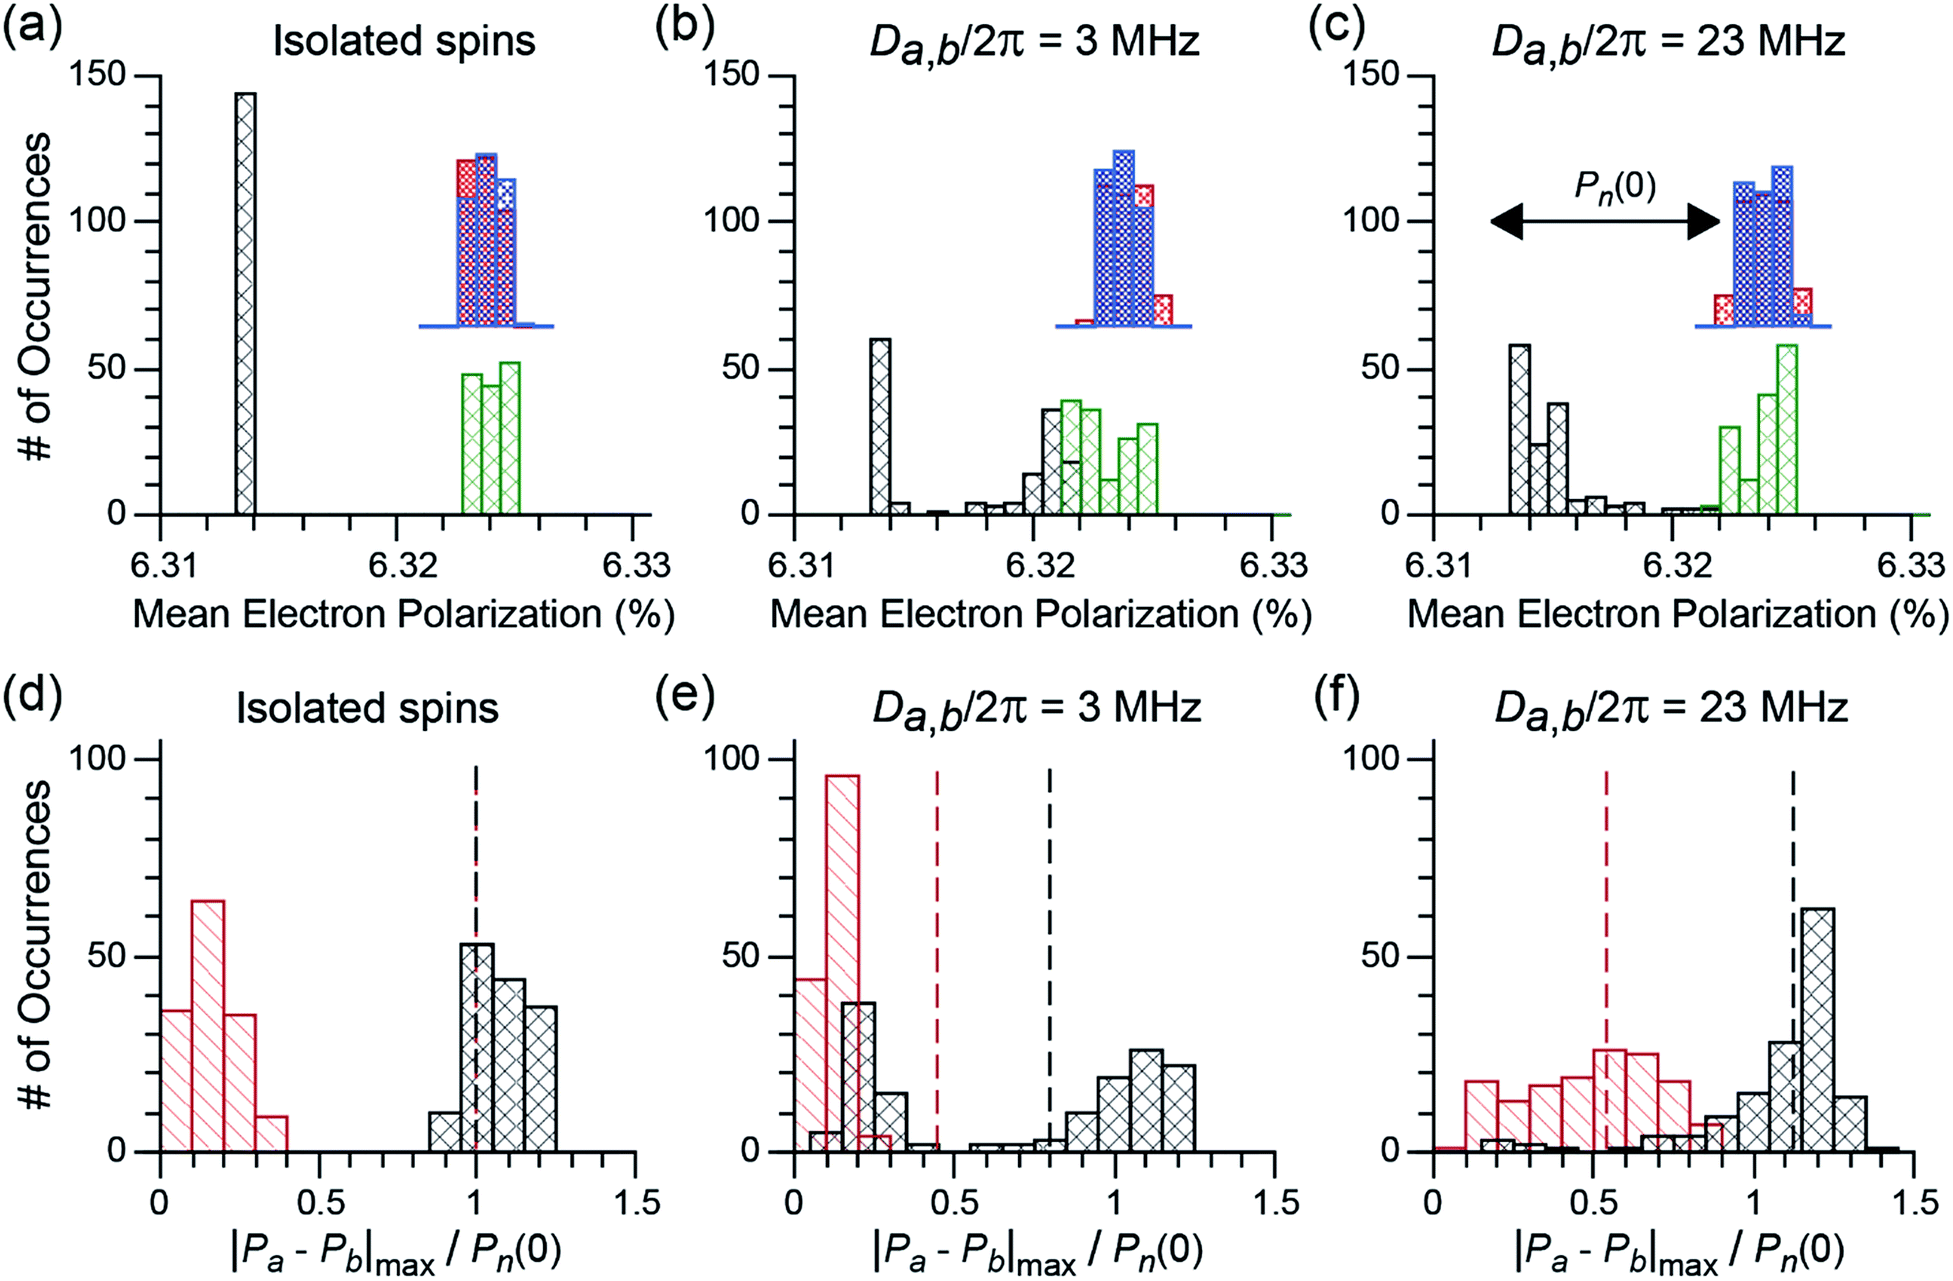 | ||
| Fig. 6 (a–c) Histograms of the mean individual electron polarizations, Pa and Pb, at steady-state for 144 different crystallite orientations of a bis-nitroxide (red and blue) and a nitroxide-trityl (nitroxide in green, trityl in black) electron spin system with different dipolar couplings: (a) Da,b/2π = 0 (isolated electron spins), (b) Da,b/2π = 3 MHz, (c) Da,b/2π = 23 MHz. (d–f) Histograms of the maximum electron polarization difference |Pa − Pb|max over one rotor period at the quasi-periodic steady state for 144 different crystallite orientations of a bis-nitroxide (in red) and a nitroxide-trityl (in black) electron spin-system with the same set of dipolar couplings as (a) to (c). |Pa − Pb|max is normalized by the initial nuclear Boltzmann polarization Pn(0). The vertical dotted line (same color code as for the bars) represents the mean powder-averaged nuclear polarization at steady state scaled by Pn(0), and corresponds to the theoretical mean χdepo. In all calculations ωr/2π = 8 kHz, B0 = 9.399 T, T = 100 K, and 1H is the nucleus with polarization Pn that is hyperfine coupled (1.5 MHz) to electron a (the nitroxide electron, which also has a hyperfine interaction to a 14N spin ranging from 15 to 98 MHz). | ||
For the case of isolated electron spins (no coupling), the average electron polarizations for electrons a and b under sample rotation and finite relaxation are well defined as shown in Fig. 6a. For all crystallite orientations the polarizations converge towards the isotropic g-values, named here ‘isotropic Boltzmann polarizations’, of the nitroxide and the trityl radicals. The wider distribution of the mean electron polarization for the nitroxide spins is due to the hyperfine coupling to 14N. In the trityl-nitroxide case (black and green bars in Fig. 6a), the isotropic g-values differ by approximately the 1H Larmor frequency. Hence, |Pa − Pb|max ≈ Pn(0) for all crystallites (black bars in Fig. 6d). This situation is very different in the bis-nitroxide case, where |Pa − Pb|max ≈ 0 (red bars in Fig. 6d). Both electron spins have the same (nitroxide) g-tensor and thereby the same mean polarizations (blue and red bars in Fig. 6a). Small non-zero values of |Pa − Pb|max can nevertheless be observed because the electron longitudinal relaxation rate is of the same order of magnitude as the MAS frequency. In the absence of any electron–electron interaction, polarization transfer cannot take place during a CE rotor event, which means that neither 1H depolarization (in absence of μw), nor hyperpolarization (in presence of μw) will occur. For both biradical types, the mean nuclear polarization at the steady state remains therefore at its initial Boltzmann level. This corresponds to a theoretical depolarization contribution factor, χdepo = 1, and it is highlighted in Fig. 6d by the vertical, dashed line.
When an electron–electron interaction is introduced (in these simulations a dipolar interaction, Da,b/2π), both the electron–electron as well as CE rotor events become active. Depending on the size of this coupling, electron–electron rotor events will be more or less efficient in exchanging polarization between the two electron spins. In the case of a small coupling, shown in Fig. 6b and e, electron–electron rotor events are inefficient and a partial equilibration of polarization between the two electrons is observed. If electron longitudinal relaxation times are sufficiently long, this decreases |Pa − Pb|max. At the same time, CE rotor events put |Pa − Pb| in contact with the nuclear spin polarization Pn. When Pn is larger than |Pa − Pb| at the time of the CE rotor event, the nuclear spin will be depolarized in favor of the electron spin polarization difference (if longitudinal nuclear relation times are sufficiently long).46,49 For bisnitroxides, inefficient electron–electron rotor events barely impact the already small |Pa − Pb|max values, which are much smaller than the initial Boltzmann nuclear polarization, Pn(0). Therefore, CE rotor events induce a strong depolarization of the nuclear spins with χdepo ≈ 0.45. Note that, at quasi-periodic steady state, Pn does not reach the mean value of |Pa − Pb|max because the CE rotor events do not completely overcome the nuclear spin relaxation. For trityl-nitroxide biradicals, the situation is again very different. Because the high-frequency EPR spectra of the nitroxide and trityl radicals partially overlap, while their isotropic g-values differ by approximately the 1H Larmor frequency, only a fraction of the crystallites (60–70 orientations out of 144) experience electron–electron rotor events. For these crystallites, the mean electron polarizations Pa and Pb will tend to values in between the isotropic Boltzmann polarizations of nitroxide and trityl electron spins (see the black and green bars in Fig. 6b), leading to strongly reduced |Pa − Pb|max. For the other crystallites (70–80), the mean electron polarizations remain at their original isotropic Boltzmann values, keeping |Pa − Pb|max ≈ Pn(0). Even for weakly coupled trityl-nitroxide biradicals, the nuclear spins are only partially depolarized, and a mean χdepo of 0.8 is found. Consequently, even in the case of small dipolar coupling the depolarization effect is strongly reduced for a trityl-nitroxide compared to bis-nitroxides.
This difference in the depolarization effect becomes even more pronounced when a stronger electron–electron coupling is considered, e.g. Da,b/2π = 23 MHz as shown in Fig. 6c and f. With such a coupling, electron–electron rotor events become much more efficient for the vast majority of crystallite orientations (but not those with the dipolar tensor aligned along the magic angle for example) in the trityl-nitroxide case and |Pa − Pb|max is again similar to Pn(0) or even slightly higher. This then results in a small hyperpolarization without μw irradiation as proposed by Thurber et al.47 (χdepo ≈ 1.2, but the exact value is highly dependent on the isotropic g-values) as opposed to depolarization. For a bis-nitroxide, the stronger electron–electron coupling broadens the distribution of the mean polarizations and |Pa − Pb|max/Pn(0) extends now from 0 to 0.9. Nevertheless, a strong average depolarization of χdepo ≈ 0.55 is observed.
The results of the simulations presented in Fig. 6 fully rationalize the absence of depolarization in trityl-nitroxide biradicals. As discussed above, this is the result of three factors. First, the number of crystallite orientations that experience electron–electron rotor events is reduced and hence the potential for depolarization effects (due to inefficient electron–electron crossings). Second, the separation of the isotropic g-values of the trityl and nitroxide radicals is approximately ω01H which naturally creates a polarization difference between the two electrons that minimizes depolarization. Third, such polarization difference is roughly maintained in the case of trityl-nitroxide biradicals, even for orientations that experience electron–electron crossings, since the electron–electron rotor events are intrinsically more efficient in the case of mixed radicals (that include a narrow-line radical) as compared to bis-nitroxides.
Additional simulations (Fig. ESI2†) show that the nuclear Boltzmann enhancement, εB increases with the size of the dipolar coupling and/or exchange interaction for the trityl-nitroxide configuration. Notably, εB is independent of MAS frequency when ωr/2π is larger than a few kHz and when the electron–electron couplings are >10 MHz. Although this remains to be verified experimentally at spinning frequencies above 14 kHz, simulations suggest that this modest electron–electron coupling is sufficient to avoid depolarization in trityl-nitroxide biradicals even at high spinning frequencies. Nevertheless, larger electron–electron couplings (>10 MHz) like in the TEMTriPol biradicals, as well as the use of a narrow-line radical, will help to maintain this efficiency at high magnetic field and fast MAS and lead to higher enhancements as well as shorter polarization build-up times.44,46,49 Note that it remains important to choose a biradical polarizing agent with an electron–electron interaction smaller than the EPR line width (as determined by the g-anisotropy at high field) and that satisfies |Da,b + 2Ja,b|/2π ≤ ωn,H/2π. Finally, the narrow EPR line of trityl will decelerate the electron–electron as well as the μw rotor events, meaning these are more efficient in trityl-nitroxide biradicals as compared to bis-nitroxide biradicals.
13C–13C correlation in NA cellulose at 18.8 T
In this section the efficiency of TEMTriPol-1 is illustrated by recording a DNP-enhanced 13C–13C correlation spectrum on a sample at natural isotopic abundance (NA). This is a demanding experiment in terms of sensitivity since only 1 pair of 13C nuclei out of 104 can contribute to the signal. Such experiments were first demonstrated at 9.4 T using through-bond17,72 and through-space17,7313C–13C correlation spectroscopy. Subsequently, 15N–13C through-space correlation experiments were shown to also be possible at NA (15N ∼0.4%, 13C ∼1.1%) using DNP.74 The through-space experiments are particularly interesting within the context of NMR crystallography since they allow the spectral assignment of 15N/13C/1H resonances without the need for complementary quantum chemical calculations.74 In addition, it enables detection of both intra- and inter-molecular distances,73–75 which is an important step in structure determination. However, extension of these types of sensitivity-demanding experiments to B0 > 10 T has so far been unsuccessful due to the poor efficiency of DNP in this regime.Because TEMTriPol-1 results in >4 times the sensitivity obtainable with AMUPol at 18.8 T (see Table 1), currently the highest magnetic field available for DNP experiments, a 2D 13C–13C NA correlation spectrum of microcrystalline cellulose could now be recorded in an overnight experiment. The corresponding spectrum is shown in Fig. 7 and can be used to perform spectral assignment and probe the spatial proximities of the 13C atoms. The mixing time chosen targets polarization transfer over one 13C–13C distance, but also allows contributions from two-bond transfers at much lower contour levels. The 1D spectrum shown on the top of the 2D is consistent with a type I cellulose, composed of the superposition of Iα and Iβ polymorphs (see Table ESI2† for the chemical shift assignment). In general, the 13C NMR spectra of crystalline cellulose I display triplets at C1, C4, and C6 depending on the Iα/Iβ ratio. The high resolution resulting from the use of 18.8 T reveals this splitting in the 13C CPMAS data. In addition, the C4/C6 resonances clearly display a broad and a narrow component (at lower frequency), which is typically attributed to the presence of both crystalline and amorphous fractions. All the one-bond correlations (C1–C2, C2–C3, C3–C4, C4–C5, C5–C6) are present in the 2D data of Fig. 7, including correlations involving the C4 and C6 amorphous fractions. For instance, this can be observed on the right-hand side of Fig. 7 where the DQ-SQ cross-peaks at around 160 ppm in the DQ dimension represent the C4amorphous–C3/C5 correlations.
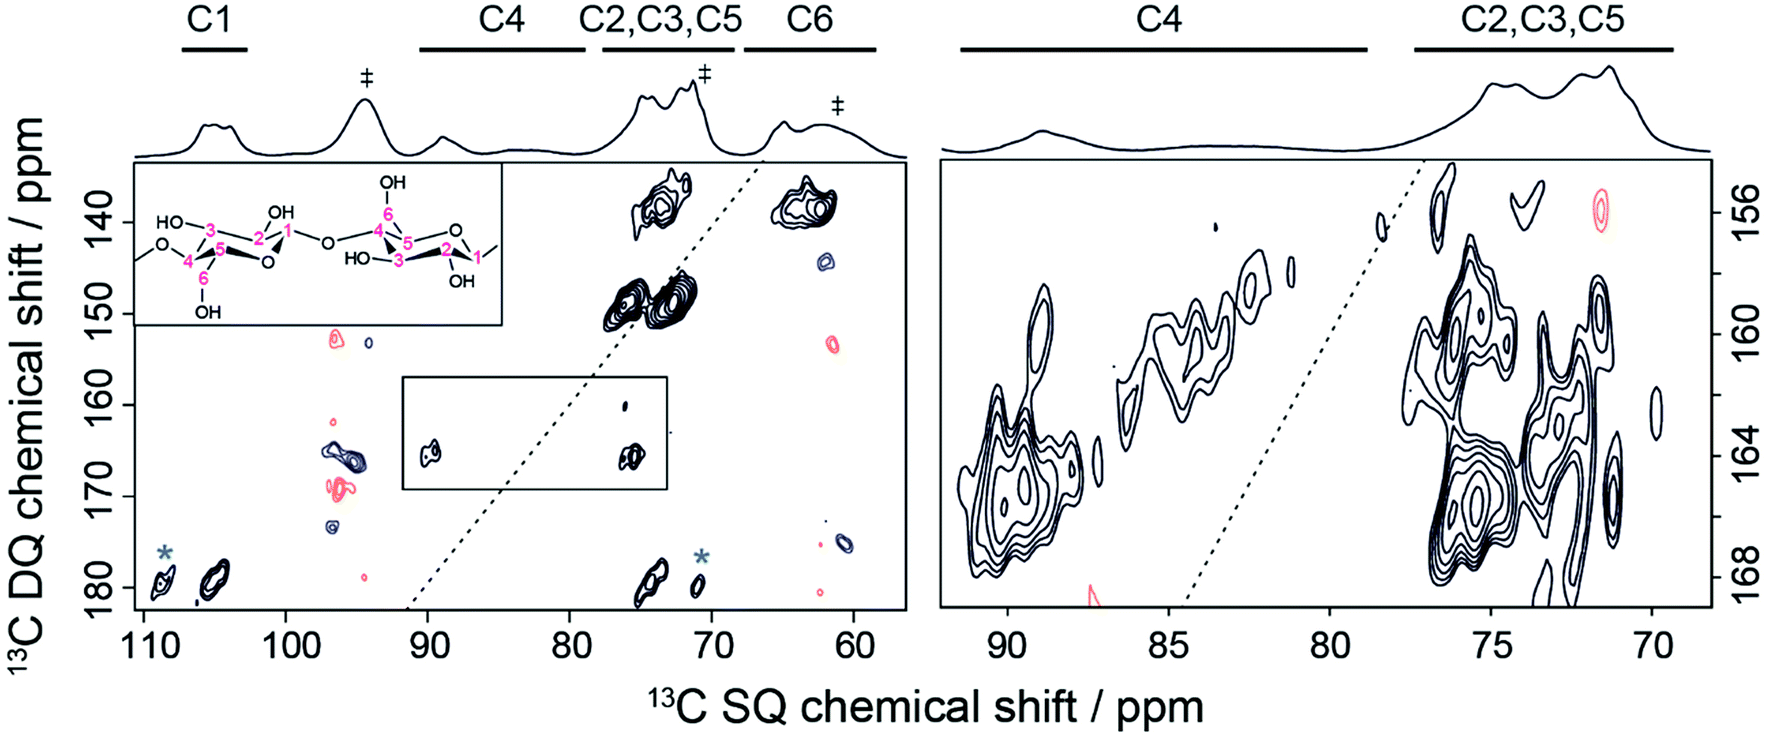 | ||
| Fig. 7 DNP-enhanced 2D DQ-SQ 13C–13C SPC5 (ref. 76) dipolar correlation spectrum recorded on microcrystalline cellulose at natural isotopic abundance at 18.8 T and ∼125 K. The MAS frequency was 6.9 kHz and the number of scans was 32. The spectrum was obtained in 16 hours with a recycling delay of 24 s, and 1.16 ms of SPC5 total mixing time. A corresponding DNP-enhanced {1H}–13C CPMAS spectrum is shown on the top. Solvent peaks, as well as spinning sideband contributions from 13C-urea present in the DNP matrix are indicated by a dagger symbol. (Left) Full DQ-SQ cellulose spectrum. Cross-peaks marked with a star represent spinning sideband contributions. (Right) Zoom on the C4 to C3/C5 cross-peaks. Note that the contour levels on the right-hand side were chosen just above the noise level in order to see the correlations from the amorphous C4 peaks. | ||
Note that the same spectrum, if recorded using AMUPol, which is one of the best water-soluble bis-nitroxide polarizing agents to date, would have taken 18 times longer, i.e. about 12 days of experimental time. This is a powerful illustration of the significance of on-going efforts to develop new, improved polarizing agents, such as TEMTriPol-1, and the importance of advancement in the understanding of the CE DNP mechanism during MAS by both experiments and theoretical simulations.
Conclusions
We have shown in this work that TEMTriPol-1, a mixed biradical composed of tethered nitroxide and trityl radicals, is so far the most efficient biradical for MAS-DNP NMR at magnetic fields ≥ 9.4 T and fast MAS (up to 14 kHz). Although it yields modest εon/off values at 9.4 and 14.1 T compared to AMUPol (in agreement with previous observations51), the absolute signal gain, εabs, and the absolute signal gain per unit square root of time (i.e. the resulting sensitivity) are similar or higher at all fields above 9 T. This discrepancy between εon/off and εabs arises because TEMTriPol-1, unlike AMUPol, does not induce nuclear depolarization during sample rotation. This underlines that εabs (or εB) rather than εon/off should be used to gauge the efficiency of a polarizing agent.The absence of depolarization with TEMTriPol-1 is a consequence of the specific g-tensor properties of the two radicals: a narrow and a broad EPR pattern with isotropic g-values separated by approximately the 1H Larmor frequency. In the absence of μw irradiation TEMTriPol-1 provides on average an electron spin polarization difference that matches the 1H polarization. Moreover, it minimizes potential inefficient polarization exchange between the two electron spins during electron–electron rotor events, which have been shown to govern depolarization losses.44,46,48
High-frequency EPR spectra of TEMTriPol-1 confirm the presence of the broad distribution of exchange interactions that was necessary to simulate the experimental DNP Zeeman field profiles and the MAS dependence of εabs and χdepo. This illustrates the relevance of numerical simulations in evaluating the performance of a given biradical geometry, which is vital for continued optimization of the chemical structure of polarizing agents.
The large absolute signal gain per unit square root of time provided by TEMTriPol-1 for DNP at 18.8 T enabled the first 2D 13C–13C correlation experiment on a sample at natural isotopic abundance at this field. Thus, chemists and biologists alike can now access both the highest sensitivity and resolution for solid-state NMR analyses, facilitating previously impossibly complex structural studies.
Conflicts of interest
There are no conflicts to declare.Acknowledgements
This work was supported by the French National Research Agency (ANR-12-BS08-0016-01, ANR-11-LABX-0003-01 and RTB) and the European Research Council (ERC-CoG-2015, No. 682895), as well as grants from the National Institutes of Biomedical Imaging and Bioengineering (EB-002804 and EB-002026) to RGG and from the National Natural Science Foundation of China (21572161) to YL. Financial support from the TGIR-RMN-THC Fr3050 CNRS and Equipex ANR-10-EQPX-47-01 for conducting DNP experiments at high magnetic fields is gratefully acknowledged. GM gratefully acknowledges the Rubicon Fellowship from the Netherlands Organization for Scientific Research (NWO).References
- J.-H. Ardenkjaer-Larsen, G. S. Boebinger, A. Comment, S. Duckett, A. S. Edison, F. Engelke, C. Griesinger, R. G. Griffin, C. Hilty, H. Maeda, G. Parigi, T. Prisner, E. Ravera, J. van Bentum, S. Vega, A. Webb, C. Luchinat, H. Schwalbe and L. Frydman, Angew. Chem., Int. Ed., 2015, 54, 9162–9185 CrossRef CAS PubMed.
- T. Maly, G. T. Debelouchina, V. S. Bajaj, K.-N. Hu, C.-G. Joo, M. L. Mak–Jurkauskas, J. R. Sirigiri, P. C. A. van der Wel, J. Herzfeld, R. J. Temkin and R. G. Griffin, J. Chem. Phys., 2008, 128, 52211 CrossRef PubMed.
- A. B. Barnes, G. De Paëpe, P. C. A. van der Wel, K.-N. Hu, C.-G. Joo, V. S. Bajaj, M. L. Mak-Jurkauskas, J. R. Sirigiri, J. Herzfeld, R. J. Temkin and R. G. Griffin, Appl. Magn. Reson., 2008, 34, 237–263 CrossRef CAS PubMed.
- Q. Z. Ni, E. Daviso, T. V. Can, E. Markhasin, S. K. Jawla, T. M. Swager, R. J. Temkin, J. Herzfeld and R. G. Griffin, Acc. Chem. Res., 2013, 46, 1933–1941 CrossRef CAS PubMed.
- A. J. Rossini, A. Zagdoun, M. Lelli, A. Lesage, C. Copéret and L. Emsley, Acc. Chem. Res., 2013, 46, 1942–1951 CrossRef CAS PubMed.
- D. Lee, S. Hediger and G. De Paëpe, Solid State Nucl. Magn. Reson., 2015, 66–67, 6–20 CrossRef CAS PubMed.
- M. L. Mak-Jurkauskas, V. S. Bajaj, M. K. Hornstein, M. Belenky, R. G. Griffin and J. Herzfeld, Proc. Natl. Acad. Sci. U. S. A., 2008, 105, 883–888 CrossRef CAS PubMed.
- V. S. Bajaj, M. L. Mak-Jurkauskas, M. Belenky, J. Herzfeld and R. G. Griffin, Proc. Natl. Acad. Sci. U. S. A., 2009, 106, 9244–9249 CrossRef CAS PubMed.
- M. J. Bayro, G. T. Debelouchina, M. T. Eddy, N. R. Birkett, C. E. MacPhee, M. Rosay, W. E. Maas, C. M. Dobson and R. G. Griffin, J. Am. Chem. Soc., 2011, 133, 13967–13974 CrossRef CAS PubMed.
- A. H. Linden, S. Lange, W. T. Franks, Ü. Akbey, E. Specker, B.-J. van Rossum and H. Oschkinat, J. Am. Chem. Soc., 2011, 133, 19266–19269 CrossRef CAS PubMed.
- M. Renault, S. Pawsey, M. P. Bos, E. J. Koers, D. Nand, R. Tommassen-van Boxtel, M. Rosay, J. Tommassen, W. E. Maas and M. Baldus, Angew. Chem., Int. Ed., 2012, 51, 2998–3001 CrossRef CAS PubMed.
- T. Jacso, W. T. Franks, H. Rose, U. Fink, J. Broecker, S. Keller, H. Oschkinat and B. Reif, Angew. Chem., Int. Ed. Engl., 2012, 51, 432–435 CrossRef CAS PubMed.
- H. Takahashi, S. Hediger and G. De Paëpe, Chem. Commun., 2013, 49, 9479–9481 RSC.
- M. Kaplan, A. Cukkemane, G. C. P. van Zundert, S. Narasimhan, M. Daniëls, D. Mance, G. Waksman, A. M. J. J. Bonvin, R. Fronzes, G. E. Folkers and M. Baldus, Nat. Methods, 2015, 12, 649–652 CrossRef CAS PubMed.
- K. K. Frederick, V. K. Michaelis, B. Corzilius, T. Ong, A. C. Jacavone, R. G. Griffin and S. Lindquist, Cell, 2015, 163, 620–628 CrossRef CAS PubMed.
- A. Lesage, M. Lelli, D. Gajan, M. A. Caporini, V. Vitzthum, P. Miéville, J. Alauzun, A. Roussey, C. Thieuleux, A. Mehdi, G. Bodenhausen, C. Coperet and L. Emsley, J. Am. Chem. Soc., 2010, 132, 15459–15461 CrossRef CAS PubMed.
- H. Takahashi, D. Lee, L. Dubois, M. Bardet, S. Hediger and G. De Paëpe, Angew. Chem., Int. Ed., 2012, 51, 11766–11769 CrossRef CAS PubMed.
- D. Lee, H. Takahashi, A. S. L. Thankamony, J.-P. Dacquin, M. Bardet, O. Lafon and G. De Paëpe, J. Am. Chem. Soc., 2012, 134, 18491–18494 CrossRef CAS PubMed.
- A. J. Rossini, A. Zagdoun, M. Lelli, J. Canivet, S. Aguado, O. Ouari, P. Tordo, M. Rosay, W. E. Maas, C. Copéret, D. Farrusseng, L. Emsley and A. Lesage, Angew. Chem., Int. Ed., 2012, 51, 123–127 CrossRef CAS PubMed.
- L. Piveteau, T.-C. Ong, A. J. Rossini, L. Emsley, C. Copéret and M. V Kovalenko, J. Am. Chem. Soc., 2015, 137, 13964–13971 CrossRef CAS PubMed.
- D. Lee, C. Leroy, C. Crevant, L. Bonhomme-Coury, F. Babonneau, D. Laurencin, C. Bonhomme and G. De Paëpe, Nat. Commun., 2017, 8, 14104 CrossRef CAS PubMed.
- F. Pourpoint, J. Templier, C. Anquetil, H. Vezin, J. Trébosc, X. Trivelli, F. Chabaux, O. S. Pokrovsky, A. S. Prokushkin, J.-P. Amoureux, O. Lafon and S. Derenne, Chem. Geol., 2017, 452, 1–8 CrossRef CAS.
- D. Lee, N. T. Duong, O. Lafon and G. De Paëpe, J. Phys. Chem. C, 2014, 118, 25065–25076 CAS.
- L. R. Becerra, G. J. Gerfen, R. J. Temkin, D. J. Singel and R. G. Griffin, Phys. Rev. Lett., 1993, 71, 3561–3564 CrossRef CAS PubMed.
- D. A. Hall, D. C. Maus, G. J. Gerfen, S. J. Inati, L. R. Becerra, F. W. Dahlquist and R. G. Griffin, Science, 1997, 276, 930–932 CrossRef CAS PubMed.
- A. B. Barnes, M. L. Mak-Jurkauskas, Y. Matsuki, V. S. Bajaj, P. C. A. van der Wel, R. DeRocher, J. Bryant, J. R. Sirigiri, R. J. Temkin, J. Lugtenburg, J. Herzfeld and R. G. Griffin, J. Magn. Reson., 2009, 198, 261–270 CrossRef CAS PubMed.
- M. Rosay, L. Tometich, S. Pawsey, R. Bader, R. Schauwecker, M. Blank, P. M. Borchard, S. R. Cauffman, K. L. Felch, R. T. Weber, R. J. Temkin, R. G. Griffin and W. E. Maas, Phys. Chem. Chem. Phys., 2010, 12, 5850 RSC.
- A. B. Barnes, E. Markhasin, E. Daviso, V. K. Michaelis, E. A. Nanni, S. K. Jawla, E. L. Mena, R. DeRocher, A. Thakkar, P. P. Woskov, J. Herzfeld, R. J. Temkin and R. G. Griffin, J. Magn. Reson., 2012, 224, 1–7 CrossRef CAS PubMed.
- E. J. Koers, E. a. W. van der Cruijsen, M. Rosay, M. Weingarth, A. Prokofyev, C. Sauvée, O. Ouari, J. van der Zwan, O. Pongs, P. Tordo, W. E. Maas and M. Baldus, J. Biomol. NMR, 2014, 60, 157–168 CrossRef CAS PubMed.
- M. Lelli, S. R. Chaudhari, D. Gajan, G. Casano, A. J. Rossini, O. Ouari, P. Tordo, A. Lesage and L. Emsley, J. Am. Chem. Soc., 2015, 137, 14558–14561 CrossRef CAS PubMed.
- P. Fricke, D. Mance, V. Chevelkov, K. Giller, S. Becker, M. Baldus and A. Lange, J. Biomol. NMR, 2016, 65, 121–126 CrossRef CAS PubMed.
- K.-N. Hu, H. Yu, T. M. Swager and R. G. Griffin, J. Am. Chem. Soc., 2004, 126, 10844–10845 CrossRef CAS PubMed.
- A. V. Kessenikh, V. I. Luschikov, A. A. Manenkov and Y. V. Taran, Soviet Physics–Solid State, 1963, 5, 321–329 Search PubMed.
- A. V. Kessenikh, A. A. Manenkov and G. I. Pyatnitskii, Soviet Physics–Solid State, 1964, 6, 641–643 Search PubMed.
- C. F. Hwang and D. A. Hill, Phys. Rev. Lett., 1967, 18, 110–112 CrossRef CAS.
- C. F. Hwang and D. A. Hill, Phys. Rev. Lett., 1967, 19, 1011–1014 CrossRef CAS.
- D. S. Wollan, Phys. Rev. B: Condens. Matter Mater. Phys., 1976, 13, 3671–3685 CrossRef CAS.
- K.-N. Hu, V. S. Bajaj, M. Rosay and R. G. Griffin, J. Chem. Phys., 2007, 126, 44512 CrossRef PubMed.
- C. Song, K.-N. Hu, C.-G. Joo, T. M. Swager and R. G. Griffin, J. Am. Chem. Soc., 2006, 128, 11385–11390 CrossRef CAS PubMed.
- Y. Matsuki, T. Maly, O. Ouari, H. Karoui, F. Le Moigne, E. Rizzato, S. Lyubenova, J. Herzfeld, T. Prisner, P. Tordo and R. G. Griffin, Angew. Chem., Int. Ed., 2009, 48, 4996–5000 CrossRef CAS PubMed.
- A. Zagdoun, G. Casano, O. Ouari, G. Lapadula, A. J. Rossini, M. Lelli, M. Baffert, D. Gajan, L. Veyre, W. E. Maas, M. Rosay, R. T. Weber, C. Thieuleux, C. Coperet, A. Lesage, P. Tordo and L. Emsley, J. Am. Chem. Soc., 2012, 134, 2284–2291 CrossRef CAS PubMed.
- C. Sauvée, M. Rosay, G. Casano, F. Aussenac, R. T. Weber, O. Ouari and P. Tordo, Angew. Chem., Int. Ed., 2013, 52, 10858–10861 CrossRef PubMed.
- A. P. Jagtap, M.-A. Geiger, D. Stöppler, M. Orwick-Rydmark, H. Oschkinat and S. T. Sigurdsson, Chem. Commun., 2016, 52, 7020–7023 RSC.
- K. R. Thurber and R. Tycko, J. Chem. Phys., 2012, 137, 84508 CrossRef PubMed.
- F. Mentink-Vigier, Ü. Akbey, Y. Hovav, S. Vega, H. Oschkinat and A. Feintuch, J. Magn. Reson., 2012, 224, 13–21 CrossRef CAS PubMed.
- F. Mentink-Vigier, Ü. Akbey, H. Oschkinat, S. Vega and A. Feintuch, J. Magn. Reson., 2015, 258, 102–120 CrossRef CAS PubMed.
- K. R. Thurber and R. Tycko, J. Chem. Phys., 2014, 140, 184201 CrossRef PubMed.
- F. Mentink-Vigier, S. Paul, D. Lee, A. Feintuch, S. Hediger, S. Vega and G. De Paëpe, Phys. Chem. Chem. Phys., 2015, 17, 21824–21836 RSC.
- F. Mentink-Vigier, S. Vega and G. De Paëpe, Phys. Chem. Chem. Phys., 2017, 19, 3506–3522 RSC.
- T. V. Can, M. A. Caporini, F. Mentink-Vigier, B. Corzilius, J. J. Walish, M. Rosay, W. E. Maas, M. Baldus, S. Vega, T. M. Swager and R. G. Griffin, J. Chem. Phys., 2014, 141, 64202 CrossRef CAS PubMed.
- G. Mathies, M. A. Caporini, V. K. Michaelis, Y. Liu, K.-N. Hu, D. Mance, J. L. Zweier, M. Rosay, M. Baldus and R. G. Griffin, Angew. Chem., 2015, 127, 11936–11940 CrossRef.
- Y. Liu, F. A. Villamena, A. Rockenbauer, Y. Song and J. L. Zweier, J. Am. Chem. Soc., 2013, 135, 2350–2356 CrossRef CAS PubMed.
- M. K. Bowman, C. Mailer and H. J. Halpern, J. Magn. Reson., 2005, 172, 254–267 CrossRef CAS PubMed.
- S. N. Trukhan, V. F. Yudanov, V. M. Tormyshev, O. Y. Rogozhnikova, D. V. Trukhin, M. K. Bowman, M. D. Krzyaniak, H. Chen and O. N. Martyanov, J. Magn. Reson., 2013, 233, 29–36 CrossRef CAS PubMed.
- Y. Liu, F. A. Villamena, A. Rockenbauer and J. L. Zweier, Chem. Commun., 2010, 46, 628–630 RSC.
- Y. Liu, F. A. Villamena, Y. Song, J. Sun, A. Rockenbauer and J. L. Zweier, J. Org. Chem., 2010, 75, 7796–7802 CrossRef CAS PubMed.
- B. Corzilius, L. B. Andreas, A. a. Smith, Q. Z. Ni and R. G. Griffin, J. Magn. Reson., 2014, 240, 113–123 CrossRef CAS PubMed.
- A. L. Barra, a. K. Hassan, A. Janoschka, C. L. Schmidt and V. Schünemann, Appl. Magn. Reson., 2006, 30, 385–397 CrossRef CAS.
- P. Neugebauer and A. L. Barra, Appl. Magn. Reson., 2010, 37, 833–843 CrossRef.
- S. K. Zaremba, Annali di Matematica Pura ed Applicata, 1966, 73, 293–317 CrossRef.
- H. Conroy, J. Chem. Phys., 1967, 47, 5307–5318 CrossRef.
- V. B. Cheng, H. H. Suzukawa and M. Wolfsberg, J. Chem. Phys., 1973, 59, 3992–3999 CrossRef CAS.
- E. A. Nanni, A. B. Barnes, Y. Matsuki, P. P. Woskov, B. Corzilius, R. G. Griffin and R. J. Temkin, J. Magn. Reson., 2011, 210, 16–23 CrossRef CAS PubMed.
- C. Sauvée, G. Casano, S. Abel, A. Rockenbauer, D. Akhmetzyanov, H. Karoui, D. Siri, F. Aussenac, W. Maas, R. T. Weber, T. Prisner, M. Rosay, P. Tordo and O. Ouari, Chem.–Eur. J., 2016, 22, 5598–5606 CrossRef PubMed.
- S. Stoll and A. Schweiger, J. Magn. Reson., 2006, 178, 42–55 CrossRef CAS PubMed.
- L. Lumata, Z. Kovacs, A. D. Sherry, C. Malloy, S. Hill, J. van Tol, L. Yu, L. Song and M. E. Merritt, Phys. Chem. Chem. Phys., 2013, 15, 9800 RSC.
- S. Gambarelli, D. Jaouen, A. Rassat, L. Brunel and C. Chachaty, J. Phys. Chem., 1996, 100, 9605–9609 CrossRef CAS.
- E. J. Hustedt, A. I. Smirnov, C. F. Laub, C. E. Cobb and A. H. Beth, Biophys. J., 1997, 72, 1861–1877 CrossRef CAS PubMed.
- K.-N. Hu, C. Song, H. Yu, T. M. Swager and R. G. Griffin, J. Chem. Phys., 2008, 128, 52302 CrossRef PubMed.
- J. van Houten, W. T. Wenckebach and N. J. Poulis, Physica B+C, 1977, 92, 210–220 CrossRef.
- K. R. Thurber, A. Potapov, W.-M. Yau and R. Tycko, J. Magn. Reson., 2012, 226, 100–106 CrossRef PubMed.
- M. E. Halse, A. Zagdoun, J.-N. Dumez and L. Emsley, J. Magn. Reson., 2015, 254, 48–55 CrossRef CAS PubMed.
- H. Takahashi, B. Viverge, D. Lee, P. Rannou and G. De Paëpe, Angew. Chem., Int. Ed., 2013, 52, 6979–6982 CrossRef CAS PubMed.
- K. Märker, M. Pingret, J. M. Mouesca, D. Gasparutto, S. Hediger and G. De Paëpe, J. Am. Chem. Soc., 2015, 137, 13796–13799 CrossRef PubMed.
- G. Mollica, M. Dekhil, F. Ziarelli, P. Thureau and S. Viel, Angew. Chem., Int. Ed., 2015, 54, 6028–6031 CrossRef CAS PubMed.
- M. Hohwy, C. M. Rienstra, C. P. Jaroniec and R. G. Griffin, J. Chem. Phys., 1999, 110, 7983–7992 CrossRef CAS.
Footnotes |
| † Electronic supplementary information (ESI) available. See DOI: 10.1039/c7sc02199b |
| ‡ Current address: CIMAR-National High Magnetic Field Laboratory, 1800 E Paul Dirac Dr, Tallahassee, FL, 32310, USA. |
| § Current address: Department of Chemistry, University of Konstanz, Universitätsstraße 10, 78464 Konstanz, Germany. |
| ¶ Current address: Amgen Inc., 360 Binney Street, Cambridge, MA 02142, USA. |
| This journal is © The Royal Society of Chemistry 2017 |