
 Open Access Article
 This Open Access Article is licensed under a
 Creative Commons Attribution 3.0 Unported Licence
Amyloid β-peptides 1–40 and 1–42 form oligomers with mixed β-sheets†
Maurizio
Baldassarre
 a,
Cesare M.
Baronio
a,
Ludmilla A.
Morozova-Roche
b and
Andreas
Barth
*a
a,
Cesare M.
Baronio
a,
Ludmilla A.
Morozova-Roche
b and
Andreas
Barth
*a
aDepartment of Biochemistry and Biophysics, Stockholm University, Arrhenius Laboratories, 10691 Stockholm, Sweden. E-mail: barth@dbb.su.se
bDepartment of Medical Biochemistry and Biophysics, Umeå University, 90187 Umeå, Sweden
First published on 12th October 2017
Abstract
Two main amyloid-β peptides of different length (Aβ40 and Aβ42) are involved in Alzheimer's disease. Their relative abundance is decisive for the severity of the disease and mixed oligomers may contribute to the toxic species. However, little is know about the extent of mixing. To study whether Aβ40 and Aβ42 co-aggregate, we used Fourier transform infrared spectroscopy in combination with 13C-labeling and spectrum calculation and focused on the amide I vibration, which is sensitive to backbone structure. Mixtures of monomeric labeled Aβ40 and unlabeled Aβ42 (and vice versa) were co-incubated for ∼20 min and their infrared spectrum recorded. The position of the main 13C-amide I′ band shifted to higher wavenumbers with increasing admixture of 12C-peptide due to the presence of 12C-amides in the vicinity of 13C-amides. The results indicate that Aβ40 and Aβ42 form mixed oligomers with a largely random distribution of Aβ40 and Aβ42 strands in their β-sheets. The structures of the mixed oligomers are intermediate between those of the pure oligomers. There is no indication that one of the peptides forces the backbone structure of its oligomers on the other peptide when they are mixed as monomers. We also demonstrate that isotope-edited infrared spectroscopy can distinguish aggregation modulators that integrate into the backbone structure of their interaction partner from those that do not. As an example for the latter case, the pro-inflammatory calcium binding protein S100A9 is shown not to incorporate into the β-sheets of Aβ42.
Introduction
Alzheimer's disease – the most common form of dementia – is associated with the deposition of amyloid fibrils in the human brain. These consist mainly of ∼40 residue-long proteolytic fragments of the β-amyloid precursor protein. The main variants of these amyloid-β (Aβ) peptides are 40 (Aβ40) and 42 (Aβ42) residues long. Although more of the shorter alloform Aβ40 is generated, the longer alloform Aβ42 dominates in the Aβ deposits in the human brain.1 The Aβ42![[thin space (1/6-em)]](https://www.rsc.org/images/entities/char_2009.gif) :Aβ40 ratio is enhanced in some familial Alzheimer diseases, which likely causes the early onset of these diseases2–5 due to increased toxicity from Aβ426 and less protection by Aβ40.5,7,8 However, the situation is more complex than indicated by this simplistic explanation: a relatively small increase in the Aβ42:Aβ40 ratio causes a dramatic increase in toxicity6 and mixing two weakly toxic alloforms can generate high toxicity.9 Thus, the properties of Aβ mixtures, including their toxicity, cannot simply be extrapolated from the properties of the pure peptides6,9,10 and a recent review concludes that studies of Aβ mixtures “will be crucial in understanding the toxic effects of Aβ”.11 One of the most fundamental aspects in this context is whether or not different Aβ alloforms co-aggregate and form common structures. In a wider perspective, cross-reactivity of Aβ with other amyloidogenic proteins12–14 may link neurodegenerate diseases that are so far considered to be different.
:Aβ40 ratio is enhanced in some familial Alzheimer diseases, which likely causes the early onset of these diseases2–5 due to increased toxicity from Aβ426 and less protection by Aβ40.5,7,8 However, the situation is more complex than indicated by this simplistic explanation: a relatively small increase in the Aβ42:Aβ40 ratio causes a dramatic increase in toxicity6 and mixing two weakly toxic alloforms can generate high toxicity.9 Thus, the properties of Aβ mixtures, including their toxicity, cannot simply be extrapolated from the properties of the pure peptides6,9,10 and a recent review concludes that studies of Aβ mixtures “will be crucial in understanding the toxic effects of Aβ”.11 One of the most fundamental aspects in this context is whether or not different Aβ alloforms co-aggregate and form common structures. In a wider perspective, cross-reactivity of Aβ with other amyloidogenic proteins12–14 may link neurodegenerate diseases that are so far considered to be different.
Co-incubation of Aβ40 and Aβ42 or cross-seeding leads to co-aggregation (cross-reactivity) in early aggregates,15,16 modifies aggregation kinetics,6,7,10,17–24 aggregate type distribution,6,10,22,23 and may enable the formation of mixed fibrils,22,25,26 although the latter has been disputed recently.16 Most of the current evidence for co-aggregation in Aβ oligomers is indirect because either larger aggregates,10,16–19,22 or monomeric peptides7,10 have been observed. Direct evidence for mixing in Aβ oligomers has been obtained,15 but using bulky labels attached to Aβ, which may affect aggregation properties. To the best of our knowledge there has not been a study that directly investigates the extent of mixture of Aβ40 and Aβ42 in Aβ oligomers with chemically unmodified peptides and that investigates the molecular architecture of mixed aggregates. This is in spite of the suggested importance of oligomers27,28 and of the Aβ42:Aβ40 ratio2,6 for the severity of Alzheimer's disease.
To reveal whether and to what extent Aβ40 and Aβ42 form mixed aggregates, we used here isotope-edited infrared (IR) spectroscopy. The main present use of this method is to determine the local conformation of polypeptides.29–31 It has also been applied to separate the spectral contributions of different components in a complex32,33 but only rarely to detect mixing of two polypeptides34,35 or of two protein domains36 in a common secondary structure. Our work uses the latter approach, provides a computational simulation of the effect, introduces the methodology to determine the randomness of mixing and discusses the sensitivity of the method for this property. We focus on the amide I vibration of the peptide backbone, which is sensitive to secondary structure and to further structural properties like the extension of β-sheets, their twist, the strength of hydrogen bonding, and the relative arrangement of adjacent strands.37–41 Our results directly demonstrate co-aggregation of Aβ40 and Aβ42 in oligomeric aggregates. These aggregates are well structured and seem to contain a large proportion of antiparallel β-sheets. Advantageously, the results were obtained with chemically unmodified peptides, without addition of reporter compounds, and in aqueous solution.
Results and discussion
Aβ hetero-oligomers with mixed isotope composition
Monomeric, recombinant peptides prepared at alkaline pH in 2H2O were brought to p2H 7.4 and their IR spectra measured against a buffer spectrum after 20 min of incubation as described in ESI.† The preparation led to small-sized oligomers and additional larger aggregates for Aβ42 and Aβ42-rich mixtures with Aβ40 when analyzed by gel electrophoresis after photo-induced crosslinking (see Fig. S5 of ESI†).The IR absorbance and second derivative spectra of unlabeled and 13C,15N-labeled Aβ40 and Aβ42 show the typical features of oligomers that are commonly assigned to antiparallel β-sheets (see Fig. S1 to S3 and discussion in ESI†). To test whether Aβ40 and Aβ42 become incorporated into the same oligomers, unlabeled Aβ42 was mixed with an equimolar concentration of uniformly 13C,15N-labeled Aβ40 at alkaline p2H and incubated at p2H 7.4. In a further experiment, labeled and unlabeled peptides were exchanged. The second derivative spectra of the 1:1 mixtures are shown in Fig. 1A and B (solid lines). Negative bands in these spectra correspond to component bands in the absorbance spectra. Also shown in Fig. 1A and B are calculated spectra (dashed lines) obtained by averaging the individual oligomer spectra shown in Fig. S1 and S2† (for the corresponding absorbance spectra see Fig. S3†). The calculated spectra are expected when unlabeled and labeled peptides do not mix, but rather give rise to distinct all-unlabeled and all-labeled oligomers. The positions of the main bands in these spectra are the same as in the individual oligomer spectra. In contrast, the real mixture spectra exhibit shifts of all main bands and a loss in intensity of the 12C-band (near 1625 cm−1). This clearly indicates that the backbones of Aβ40 and Aβ42 interact in the oligomers and that this interaction influences the vibrational coupling that determines the band position of the β-sheet band.
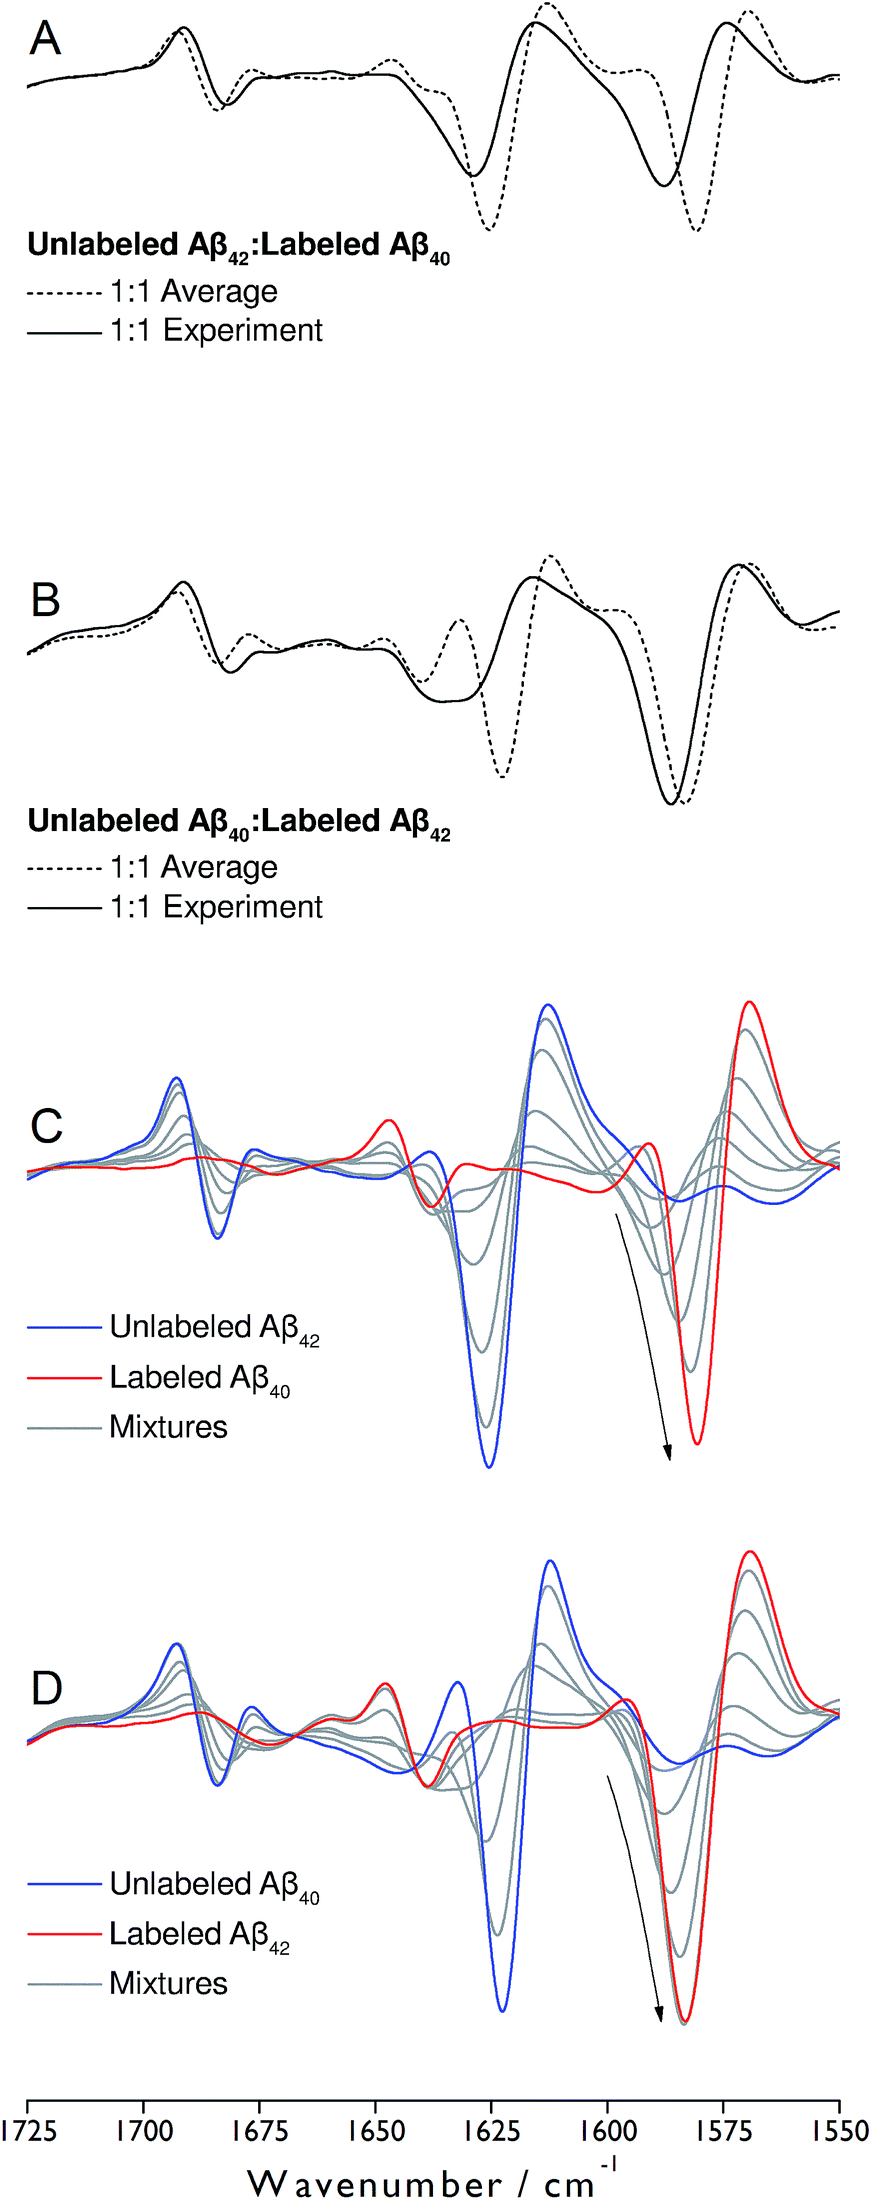 | ||
| Fig. 1 Spectra of the second derivative of IR absorbance of oligomers obtained from mixtures of unlabeled Aβ42 and labeled Aβ40 (A and C) and unlabeled Aβ40 and labeled Aβ42 (B and D). Real spectra of 1:1 mixtures are shown in panels (A) and (B) (solid lines), together with averaged spectra of the pure compounds (dashed lines). In panels (C) and (D), the spectra of several ratios of unlabeled and labeled peptides (9:1, 3:1, 1:1, 1:3, 1:9) are shown together with those of the pure oligomers obtained from unlabeled (blue) and labeled (red) peptides. The arrows in panels (C) and (D) indicate the changes in intensity and band position of the main 13C-band upon 13C-enrichment. | ||
Band shifts upon isotopic dilution
To discuss further the structural basis of the Aβ42:Aβ40 mixing effect, panels C and D of Fig. 1 show spectra recorded for a number of different Aβ42:Aβ40 ratios, where one of the peptides was labeled. They reveal gradual upshifts of the main 12C- and 13C-β-sheet bands (near 1625 and 1580 cm−1, respectively) and a downshift of the minor β-sheet band (near 1680 cm−1) upon isotopic dilution. Such band shifts upon isotopic dilution have been observed previously.34,36,42–46
We chose the 13C-band for further evaluation, because it can be detected even at low 13C:12C-ratio in second derivative spectra. The position of this band is plotted in Fig. 2 and reflects the continuous downshift of the band upon 13C-enrichment. The different end points of the curves (when only labeled peptide is present) reflect the different structures of the pure oligomers (see Fig. S2†).
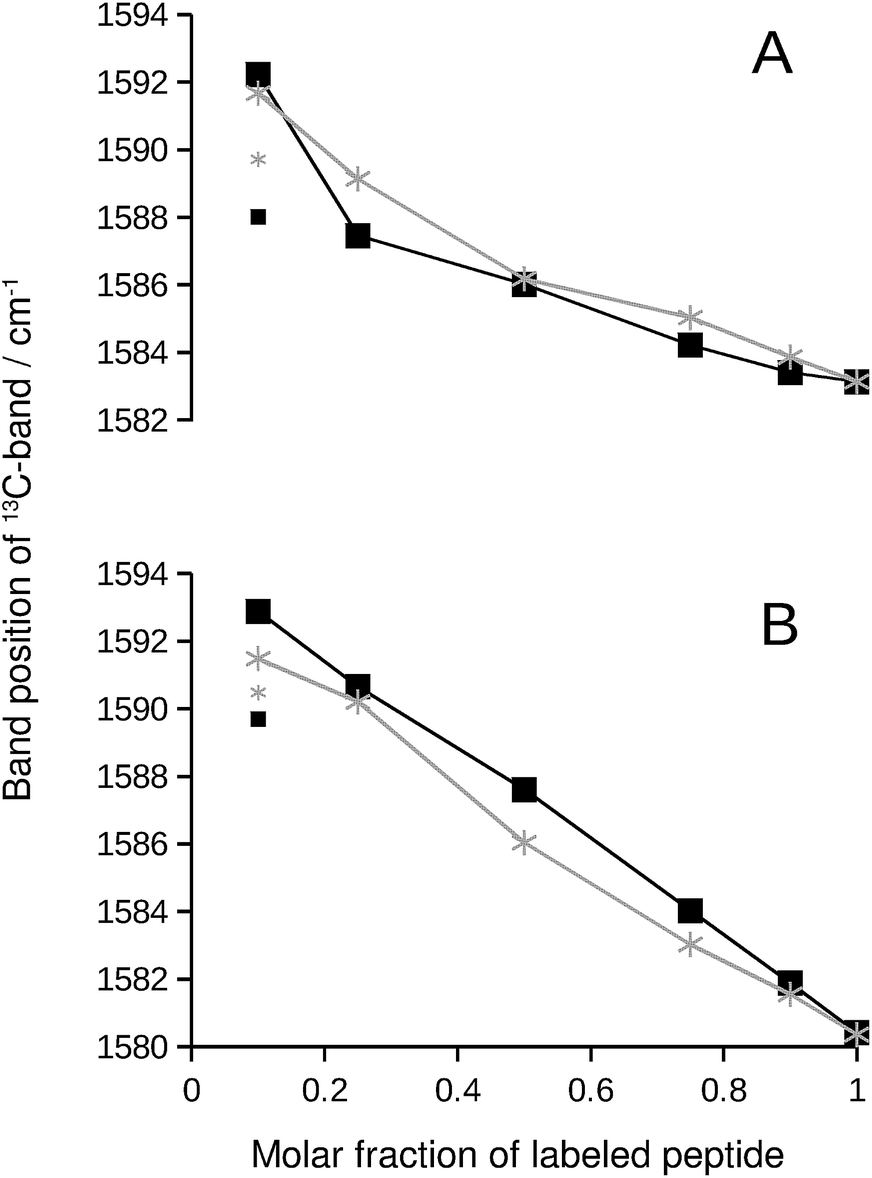 | ||
| Fig. 2 13C-band position as a function of the molar fraction of labeled peptide. The black squares and lines are for Aβ42:Aβ40 mixtures, where one of them was labeled. The gray stars and lines are for mixtures of labeled and unlabeled versions of the same peptide. (A) 13C-Aβ42:12C-Aβ40 (black) and 12C-Aβ42:13C-Aβ42 (gray) mixtures. (B) 12C-Aβ42:13C-Aβ40 (black) and 12C-Aβ40:13C-Aβ40 (gray) mixtures. The large symbols indicate band positions that were directly determined from the second derivative spectra except for the data points at 0.1 molar fraction of labeled peptide, which were obtained from a fit as described in ESI.† The small symbols show the original band positions in the second derivative spectra for these data points. Note that the data for completely labeled peptides in each panel are from two independent series of experiments. The agreement between the band positions demonstrates the excellent reproducibility of the spectra. | ||
We explain the observed 13C-band shift by the formation of β-sheets with mixed isotopic composition, i.e. sheets that consist of 12C- and 13C-strands. For the experiments shown in Fig. 1C and D, this means that the sheets contain strands from Aβ40 and Aβ42. This interpretation will be tested in the following sections by calculations and control experiments.
Calculated amide I spectra of antiparallel β-sheets with mixed isotope composition
To support our explanation for the shift of the 13C-band upon isotopic dilution we discuss now spectrum calculations that simulate the above experiments. The aim was to reproduce the effects of isotopic dilution in a qualitative way.Details of the calculations are provided in ESI.† In brief, amide I spectra were calculated using coupling constants from density functional theory for nearest neighbor interactions and from transition dipole coupling for other interactions. Diagonal and non-diagonal elements of the mass-normalized force constant matrix considered the carbon isotope of the respective amide group(s). Spectra were calculated from 3000 sheets with a statistical distribution of 12C- and 13C-strands at a given 13C:12C ratio. Errors in calculated band positions were obtained by repeating the calculations 20-times.
Antiparallel β-sheets of different sizes generated qualitatively similar spectra. As an example, Fig. 3 shows results obtained with a sheet of 6 strands and 10 residues (9 complete amide groups) per strand. The main 12C-band near 1622 cm−1 loses intensity already at low 13C:12C-ratios whereas the 13C-band is observed for all ratios. It shifts gradually down with increasing 13C:12C-ratios as observed in the experiments. These simulations show that the experimental result can be explained by mixing strands with different carbon isotopes in the same β-sheet. This conclusion is independent from the molecular architecture of the β-sheets as qualitatively similar results were obtained for parallel sheets (see Fig. S7†).
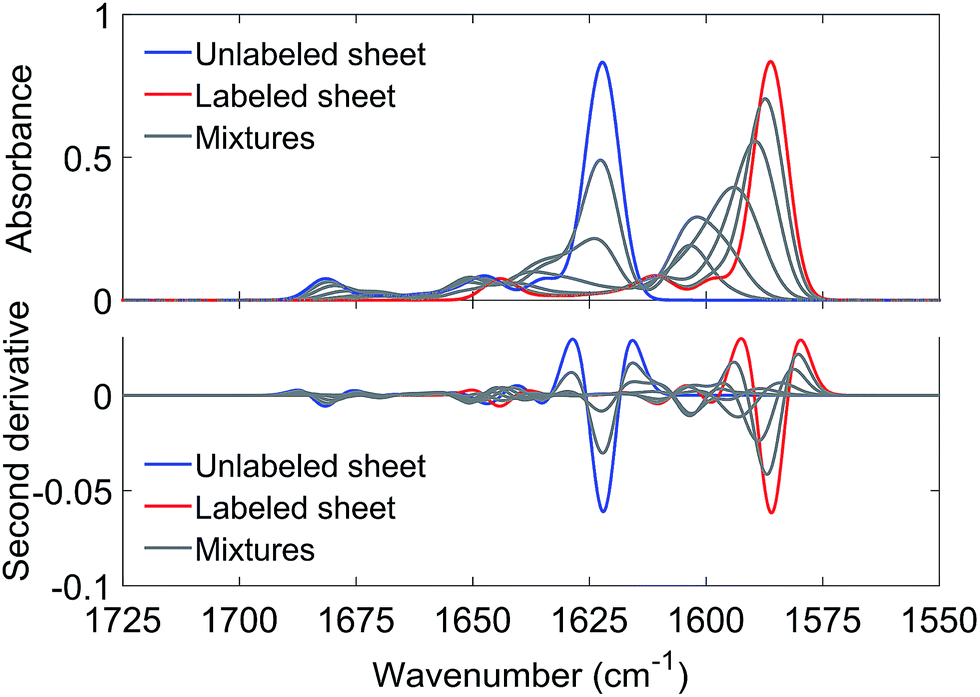 | ||
| Fig. 3 Calculated amide I spectra for an antiparallel β-sheet with 6 strands and 10 residues per strand (9 complete amide groups). The blue and red spectra were calculated for entirely unlabeled and labeled sheets, respectively. The gray spectra were calculated for different molar fractions of 13C-peptides, as used in the experiments (0.1, 0.25, 0.5, 0.75, 0.9). Each simulated spectrum is the average of the spectra from 60000 sheets with a statistical distribution of labeled and unlabeled strands at a given 13C:12C-ratio. 13C-enrichment gradually shifts the 13C-band from 1603.5 to 1586.2 cm−1. The 12C band position for the completely unlabeled sheet is 1622.2 cm−1. | ||
While the band positions of the completely labeled and unlabeled 6-stranded sheet are in reasonable agreement with the experimental values, the 13C-band shift between 10% and 100% 13C content is calculated to be larger than experimentally observed (17 cm−1versus 9–12 cm−1 observed in the four mixing experiments shown in Fig. 2). The calculated shift is smaller for a parallel β-sheet of the same size (14 cm−1) but these calculations fail to reproduce the high wavenumber band that is clearly observed in the experimental spectra (compare Fig. 1 and S7†). The discrepancy is not due to our use of ideal β-sheet structures for the calculations, as similar or larger shifts were obtained for a 6-stranded antiparallel sheet from a streptavidin mutant (20 cm−1) and in a calculation for an ideal antiparallel sheet in which the vibrational coupling constants were varied statistically to simulate structural disorder (17 cm−1).
The likely reason for the discrepancy between the experimental and the calculated 13C-band shift is the internal structure of the oligomers as the shift is sensitive to the number of adjacent strands that contain the same carbon isotope.36,46 When this number is one, the calculated 13C-band shift (between 10% and 100% 13C content) was 24 cm−1 for large parallel sheets.36,46 When this number is two, the shift decreased to 18 cm−1. The shift decreased further when the number of adjacent strands with the same carbon isotope was increased to three or four. We confirmed this trend in our own calculations with 6-stranded sheets that were composed of building blocks of two adjacent β-strands with the same carbon isotope. The shift was now reduced to 10 cm−1, which compares favorably to the 9–12 cm−1 shift in the four mixing experiments shown in Fig. 2. Therefore a plausible explanation of our results is that each peptide contributes two or more adjacent strands to the oligomers. Our shifts are smaller than those calculated by Moran et al. because we use sheets with a much smaller number of strands.
Explanation of the band shifts upon isotopic dilution
The reason for the spectral shifts can be found in the decreased coupling between neighboring oscillators in a β-sheet with mixed isotope composition compared to an all-unlabeled or all-labeled sheet. This is shown schematically in Fig. 4 using an ideal anti-parallel β-sheet to illustrate the principle. In a β-sheet composed entirely of either unlabeled or labeled strands, such as the one shown in the top panel, the local amide I′ oscillations of individual peptide groups (dashed ellipses) couple strongly because (1) they have a similar vibrational frequency, (2) the main component of their transition dipole moments is oriented in the same direction and (3) they are close in space. This delocalizes the vibrations over up to 12 strands47 (solid ellipse). The strongest coupling of a particular amide group in an antiparallel β-sheet is with the two hydrogen bonded amide groups in the adjacent strands and with the diagonally opposed amide group in one of the adjacent strands.37,48 Intrastrand coupling between nearest neighbors is smaller but still significant. Nevertheless and to simplify the illustration, only the strongest interaction is considered in Fig. 4. Coupling affects band positions and leads to a downshift in case of the main β-sheet band. This is shown in the set of spectra on the right side of the top panel of Fig. 4. Stronger coupling leads to a larger downshift, which increases with sheet flatness and number of incorporated strands (usually up to 10 strands)37–40 and is, among others, the reason for the downshifted absorption of β-sheets in amorphous aggregates compared to those in soluble proteins. The above discussion indicates that IR spectroscopy is sensitive to structural variations in β-sheets that occur within a length scale of 10–12 strands.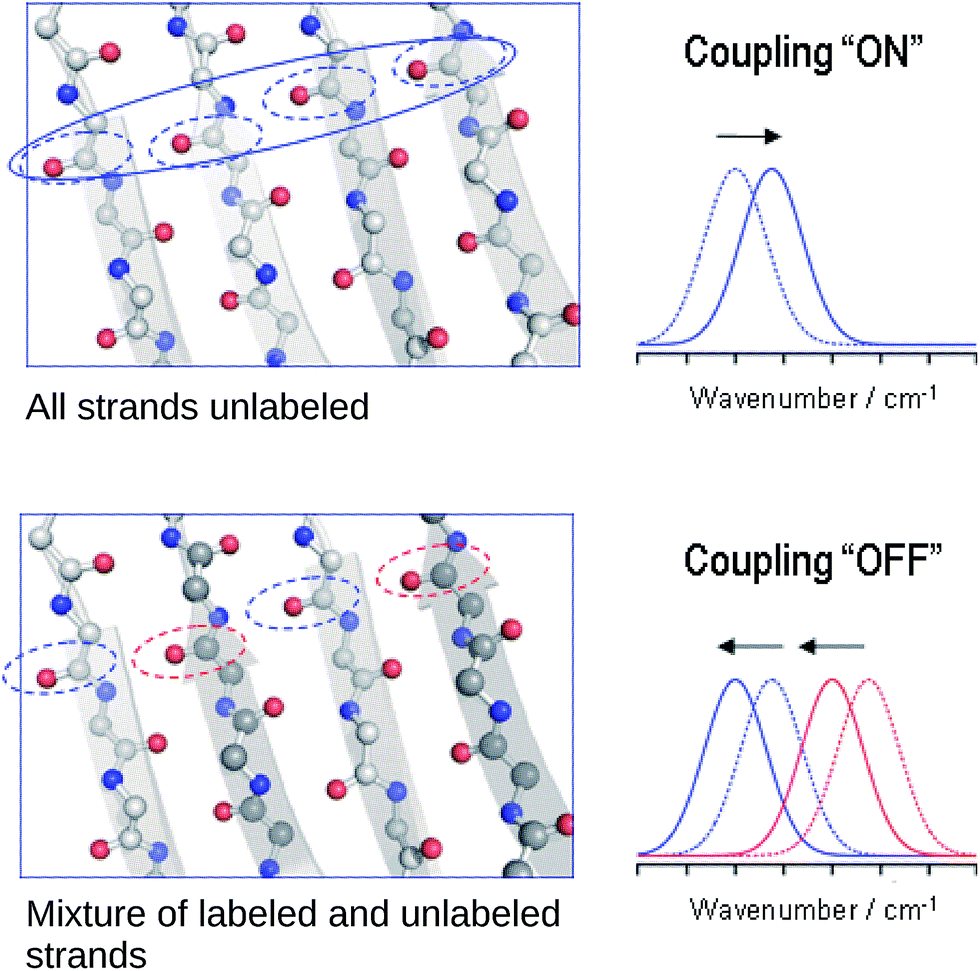 | ||
| Fig. 4 Simplified explanation for the spectral effects of mixing labeled and unlabeled strands in a β-sheet. In the sheet, carbon, nitrogen and oxygen atoms are shown in gray, blue and red, respectively. The dashed ellipses denote individual amide I oscillators, they are blue for 12C-amides and red for 13C-amides. The solid ellipse denotes a delocalized vibration due to coupling of the indicated individual oscillators. The dashed and solid spectra on the side show the main β-sheet absorption band before and after coupling is established (top), as well as before and after it is partially broken (bottom) for the main 12C- (blue) and the main 13C-band (red). | ||
In the case of an isotopically mixed β-sheet (bottom panel of Fig. 4), where fully unlabeled and fully labeled strands alternate randomly, the difference in the intrinsic vibrational frequencies of the amide oscillators makes that unlabeled (blue ellipses) and labeled (red ellipses) oscillators couple only weakly. Therefore, the vibration is less delocalized over the span of the sheet and more localized on the individual strands. The net effect is that the vibrational frequencies of both unlabeled and labeled oscillators are closer to those of the uncoupled, hydrogen-bonded amide carbonyls (∼1645 cm−1 for 12C![[double bond, length as m-dash]](https://www.rsc.org/images/entities/char_e001.gif) O, and ∼1600 cm−1 for 13CO), and the corresponding β-sheet absorption bands shift to higher wavenumbers compared to a fully unlabeled or fully labeled sheet.
O, and ∼1600 cm−1 for 13CO), and the corresponding β-sheet absorption bands shift to higher wavenumbers compared to a fully unlabeled or fully labeled sheet.
The opposite phenomenon occurs for the high wavenumber band of anti-parallel β-sheets, which experiences a downshift upon loss of coupling. The smaller magnitude of the shift, together with the moderate intensity of this band, makes it less useful in the study of amyloid-β oligomers compared to the main β-sheet band.
Control: Aβ homo-oligomers with mixed isotope composition
If the 13C-band shift indicates isotopically mixed β-sheets, then similar shifts must be observed when labeled and unlabeled versions of the same peptide are mixed in homo-oligomers. In such experiments, labeled and unlabeled peptides form randomly mixed β-sheets because they are chemically identical. Our experiments with homo-oligomers of varying isotope composition resulted in similar 13C-band shifts, which are included as gray lines in Fig. 2. The results with homo-oligomers support our interpretation that Aβ42:Aβ40 hetero-oligomers form mixed β-sheets.Evidence for random mixing in hetero-oligomers
The 13C-band shifts of the homo-oligomers shown in Fig. 2 serve as reference curves for random mixing. They superimpose well with the curves for Aβ42:Aβ40 mixtures indicating that these two peptides form common β-sheets which contain a random or close to random mixture of Aβ40 and Aβ42 strands.In our experiments, Aβ42:Aβ40 oligomers of different sizes are formed (see ESI†), which might have different mixing preferences. The limiting cases are randomly mixed Aβ42:Aβ40 oligomers on the one hand and chemically homogeneous aggregates, i.e. pure Aβ42 or pure Aβ40 oligomers, on the other hand. Intermediate cases are also conceivable. When one of the two Aβ alloforms is labeled, such different kinds of oligomers will have different 13C-band positions for a given isotope ratio according to the calculations shown in Fig. S8.† The 13C-band position will be lower for the aggregates with higher purity than for aggregates with a statistical Aβ42:Aβ40 composition. Experimentally, these different band positions will be difficult to distinguish because the bands are likely to overlap. The overlap will lead to a single broad 13C-band that is downshifted with respect to that for randomly mixed aggregates at all isotope ratios. This is not observed. Instead, 13C-band positions for the heterogeneous Aβ42:Aβ40 mixtures (black curves in Fig. 2) superimpose well on those for homogeneous oligomers, which have a statistical distribution of labeled and unlabeled strands (gray curves in Fig. 2). Therefore none of the dominant oligomers in our Aβ42:Aβ40 samples deviates enough from the random mixing case to produce a detectable effect.
Control: Aβ hetero-oligomers from unlabeled peptides
While the isotope effect evident in Fig. 1 and 2 reveals mixing of Aβ40 and Aβ42, it masks band shifts due to structural differences between the homo-oligomers and the hetero-oligomers. Therefore we repeated the experiment with unlabeled peptides. When unlabeled Aβ40 and Aβ42 were mixed, both the band position of the main β-sheet and that of the broad band near 1645 cm−1 shifted in a nearly linear fashion between the extreme values of the pure compounds. This is shown in panels A and B of Fig. 5. Please note that this series of experiments is completely independent from the ones shown in Fig. 1. Therefore the band positions of the pure compounds are slightly different. The band position of the Aβ42 spectrum in Fig. 5 (1624.8 cm−1) is the lowest measured for six independent samples (average 1625.5 ± 0.4 cm−1). The band position for Aβ40 (1622.2 cm−1) in Fig. 5 is very close to the average of 1622.3 ± 0.1 cm−1 determined for three samples.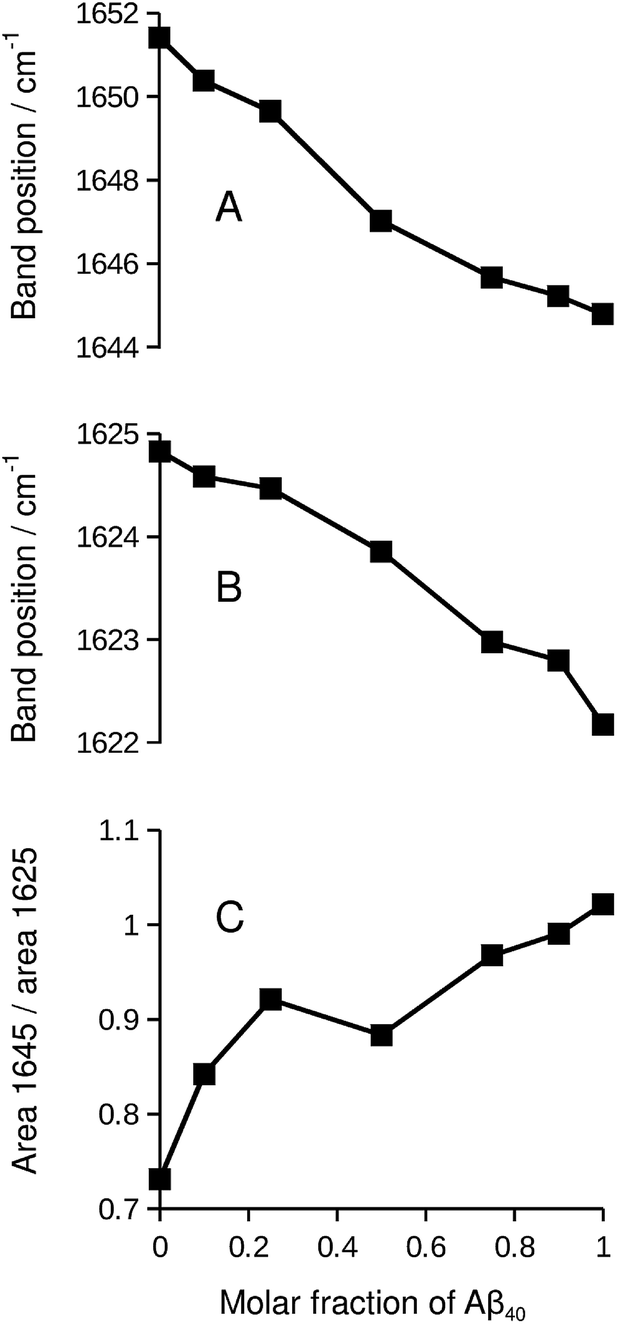 | ||
| Fig. 5 Spectral changes upon increasing the Aβ40 content in Aβ42:Aβ40 mixtures of unlabeled peptides. (A) Band position of the broad band near 1650 cm−1 in the second derivative spectra. Only for this panel, the smoothing range for calculating the second derivative was increased from our standard value of 13 points for determining band positions to 25 points to obtain a more accurate description of the small band of the Aβ42 sample. (B) Band position of the β-sheet band near 1625 cm−1 in the second derivative spectra. (C) Integrated absorbance near 1645 cm−1 divided by the integrated absorbance near 1625 cm−1. Integration in the ranges 1650–1640 cm−1 and 1630–1620 cm−1 was done with method E of the Bruker OPUS software with respect to a baseline drawn between the averaged absorbance in the 1700–1695 cm−1 and in the 1610–1605 cm−1 range. | ||
Concomitant with the shifting band positions, the broad band near 1645 cm−1 intensifies as the Aβ40 content increases (see also Fig. S1†). This may indicate that there is more random coil structure in the Aβ40 oligomers. However, intensities in second derivative should be compared with care as they also depend on the band width. Therefore we sought confirmation for the above interpretation in the respective absorbance spectra and found it confirmed: the absorbance spectrum of Aβ40, but not that of Aβ42, shows a pronounced shoulder near 1640 cm−1 that can be assigned to random coil structures as shown in Fig. S3.† In the mixtures, the absorbance in the 1650–1640 cm−1 region increases relative to that in the 1630–1620 cm−1 region as the Aβ40 content increases (panel C of Fig. 5).
As the curves in Fig. 5 are nearly linear, they indicate a gradual transition between the spectra of the pure oligomers and thus a gradual shift between the backbone structures of Aβ42 oligomers and of Aβ40 oligomers as the peptide composition of the oligomers changes. This result has several implications:
(i) As a control experiment it indicates that the backbone structures of the mixed aggregates are similar to those of the pure oligomers. The shift of the main β-sheet band (panel B) is much smaller than the 13C-band shift in Fig. 5. Therefore, a conformational effect can be excluded as an explanation for the 13C-band shift. Note also that the shifts in Fig. 5 depend on the Aβ42:Aβ40 ratio, whereas those in Fig. 1 and 2 depend on the 13C:12C-ratio. In the latter experiments, increasing the Aβ40 content leads to a downshift of the 13C-band when Aβ40 is labeled, but to an upshift when it is not labeled.
(ii) From a methodological perspective, Fig. 5 demonstrates that mixing can only be detected with the help of isotope labels (Fig. 1) because the curves in Fig. 5 are close to those expected for the case when Aβ40 and Aβ42 do not mix.
(iii) Regarding the biological system, Fig. 5 shows that none of the peptides forces the backbone structures of its pure oligomers on the mixed aggregates when the two peptides co-aggregate from a mixture of monomers. Otherwise, the curves in Fig. 5 should be more curved.
Control: Aβ42 and S100A9
The ability of Aβ42 and Aβ40 to form mixed oligomers has the natural consequence that they mutually influence their aggregation properties. In contrast, other interaction partners may affect aggregation without integrating into the backbone structure of the Aβ aggregates. In the following we will show that isotope-edited IR spectroscopy can distinguish between these two cases and thus provides information that is complementary to that obtained from other aggregation assays.As an example for the second case, we chose the brain-expressed, pro-inflammatory calcium binding protein S100A9, which is also called migration inhibitory factor-related protein 14 (MRP14) or calgranulin B. It forms amyloids on its own and is known to interact with Aβ, which enhances the amyloidogenicity of both.49,50 In this case the interaction proceeds via transient hydrophobic contacts involving side chains,49,50 rather than via direct interaction between backbone segments of the two proteins.
The IR absorption spectrum of S100A9 in the amide I′ region is shown in black in panels A and C of Fig. 6. It exhibits three main components. A strong, sharp band at 1650 cm−1 originates from α-helices, the dominant secondary structure in the protein. The minor band at 1631 cm−1, usually assigned to β-sheet structures, rather originates from solvent-exposed and highly hydrated stretches of α-helices as there are no β-sheets in this protein.51 The band at 1675 cm−1 originates from turns.
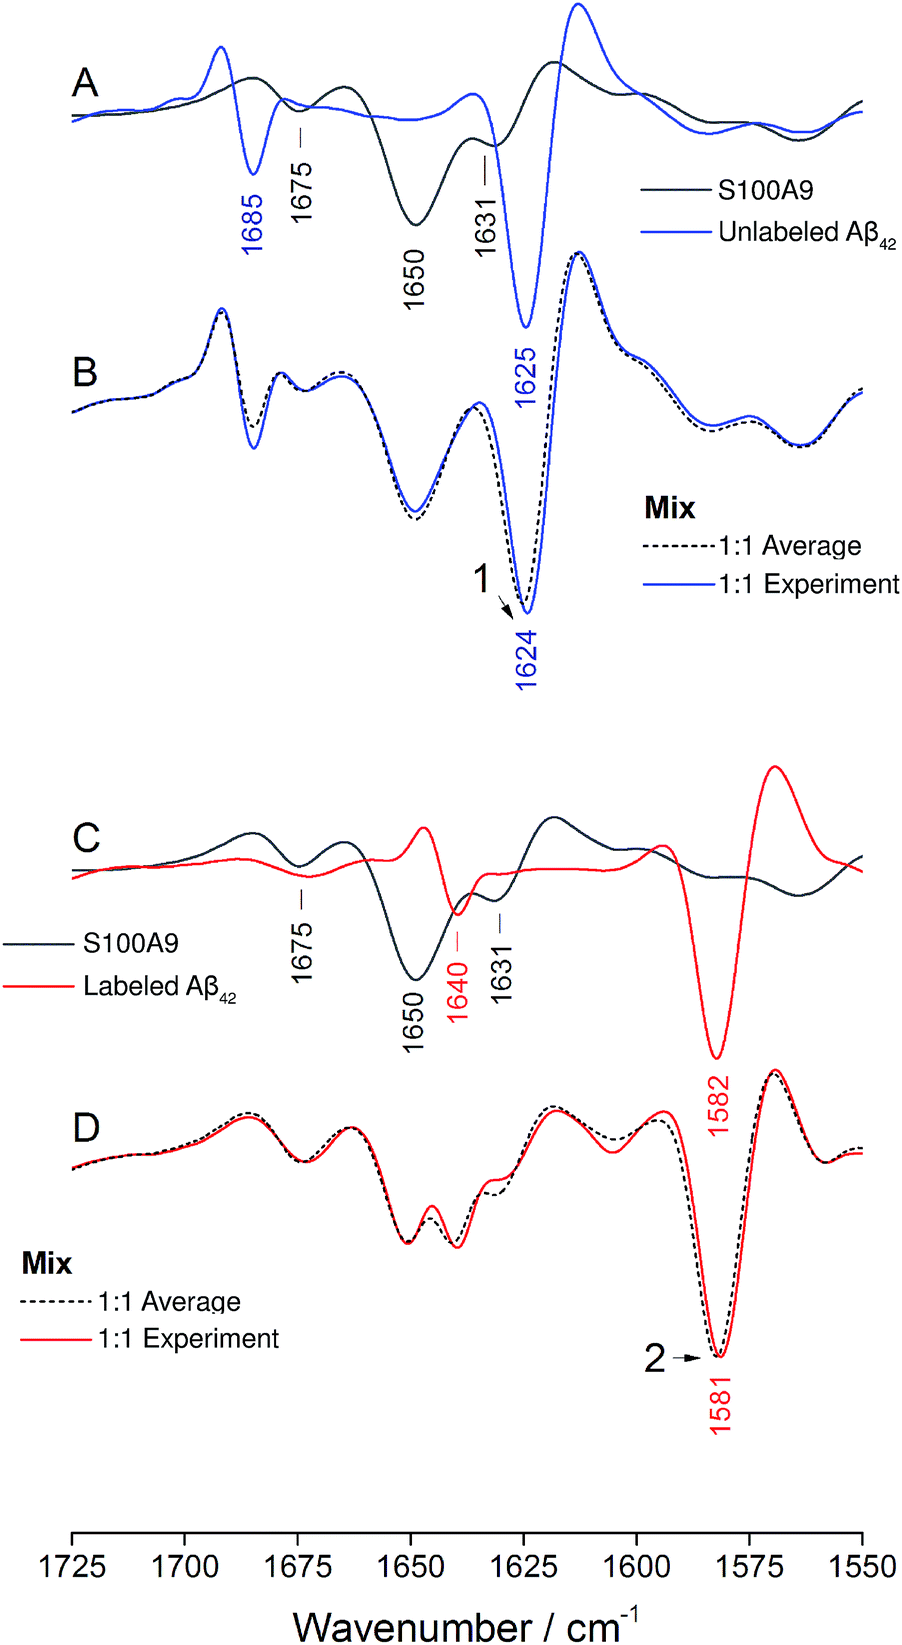 | ||
| Fig. 6 Oligomer formation by unlabeled and labeled Aβ42 in the presence of S100A9. Panels (A), (B) and (C), (D) refer to experiments performed using unlabeled and labeled Aβ42, respectively. S100A9 is unlabeled in both experiments. Panels (A) and (C) show spectra of the pure components and panels (B) and (D) spectra of the 1:1 mixtures (w/w). “Experiment” refers to the experimental spectrum and “Average” to the average spectrum of the pure components, which is the expected mixture spectrum in the absence of structural changes. | ||
The spectrum of the mixture with unlabeled Aβ42 oligomers is shown as blue spectrum in panel B together with a calculated spectrum of the 1:1 mixture (average spectrum of the pure components, dashed spectrum). The two spectra are virtually superimposable, with all the main features of the Aβ42 oligomer spectrum being preserved. A small (∼1 cm−1) downshift of the main β-sheet band can be observed (arrowhead 1) and is likely due to accelerated aggregation in the presence of S100A9. This interpretation is based on the observation that the position of this band downshifts with increased aggregation time.52
The same experiment was performed with labeled Aβ42 oligomers, as shown in panels C and D. Again, the calculated (dashed) and experimental (solid red) spectra of the 1:1 mixture are virtually superimposable and a small downshift of the main β-sheet band of labeled Aβ42 oligomers can be observed (arrowhead 2). In contrast to the Aβ40 and Aβ42 mixtures, no upshift of the main 13C-β-sheet band occurs when S100A9 is added to Aβ42. This indicates that the upshift observed for Aβ40:Aβ42 mixtures is not induced by transient, hydrophobic interactions between side chains as they occur between S100A9 and Aβ.
Conclusions
Our experiments and control experiments clearly demonstrate that Aβ40 and Aβ42 form mixed oligomers, when they are mixed as monomers before aggregation is initiated. Mixing occurs on the level of secondary structure, where the Aβ40 backbone is in direct interaction with the Aβ42 backbone in the β-sheets of the oligomers. Mixing of Aβ40 and Aβ42 strands in the β-sheets is random or close to random. This structural information was inferred from band shifts in the IR spectrum, when one of the peptides was 13C-labeled. The different carbon isotopes in the mixed sheets disrupt the interstrand vibrational coupling, which leads to an upshift of the main β-sheet band. This conclusion is also supported by our spectrum calculations, which reproduce the shifts observed in the experiments. The best agreement between calculations and experiments is obtained when we assume that each peptide contributes two adjacent strands to the oligomers.The backbone structures of mixed Aβ42:Aβ40 oligomers are intermediate between those of the pure aggregates. There is no indication that one of the alloforms forces its preferred structure on the other alloform when they are mixed as monomers. This conclusion is based on band shifts observed for mixtures of unlabeled peptides, which depend linearly on the composition of the aggregates.
The random or close to random mixing of Aβ40 and Aβ42 in the β-sheets of oligomers occurs in spite of their different propensities to aggregate6,10,16,21,23 and the different oligomer structures that they adopt23 (see also Fig. S1†). Our findings are in line with previous more qualitative conclusions using chemically modified peptides15 or peptides attached to a support10 and with conclusions drawn indirectly from the observation of fibril formation.16 Our work adds information on the extent of mixing and on the structural architecture of mixed oligomers. It strengthens the view that heterogeneous oligomers are relevant for Alzheimer's disease. In addition, it highlights the necessity to consider them in the amyloid field in general, since similar mixed oligomers may assemble under many other amyloidogenic conditions in several diseases.
Conflicts of interest
There are no conflicts to declare.Acknowledgements
We are grateful to Chao Wang for purification of S100A9 and to Eeva-Liisa Karjalainen for the original version of the Matlab program for spectrum calculations. We acknowledge support from Alzheimerfonden, Wenner-Gren Stiftelserna, Knut och Alice Wallenbergs Stiftelse, Insamlingsstiftelsen, and Stiftelsen Lars Hiertas Minne.References
- D. L. Miller, I. A. Papayannopoulos, J. Styles, S. A. Bobin, Y. Y. Lin, K. Biemann and K. Iqbal, Arch. Biochem. Biophys., 1993, 301, 41–52 CrossRef CAS PubMed.
- D. R. Borchelt, G. Thinakaran, C. B. Eckman, M. K. Lee, F. Davenport, T. Ratovitsky, C.-M. Prada, G. Kim, S. Seekins, D. Yager, H. H. Slunt, R. Wang, M. Seeger, A. I. Levey, S. E. Gandy, N. G. Copeland, N. A. Jenkins, D. L. Price, S. G. Younkin and S. S. Sisodia, Neuron, 1996, 17, 1005–1013 CrossRef CAS PubMed.
- D. Scheuner, C. Eckman, M. Jensen, X. Song, M. Citron, N. Suzuki, T. D. Bird, J. Hardy, M. Hutton, W. Kukull, E. Larson, L. Levy-Lahad, M. Viitanen, E. Peskind, P. Poorkaj, G. Schellenberg, R. Tanzi, W. Wasco, L. Lannfelt, D. Selkoe and S. Younkin, Nat. Med., 1996, 2, 864–870 CrossRef CAS PubMed.
- N. Suzuki, T. Cheung, X. Cai, A. Odaka, L. Otvos, C. Eckman, T. Golde and S. Younkin, Science, 1994, 264, 1336–1340 CAS.
- S. Kumar-Singh, J. Theuns, B. Van Broeck, D. Pirici, K. Vennekens, E. Corsmit, M. Cruts, B. Dermaut, R. Wang and C. Van Broeckhoven, Hum. Mutat., 2006, 27, 686–695 CrossRef CAS PubMed.
- I. Kuperstein, K. Broersen, I. Benilova, J. Rozenski, W. Jonckheere, M. Debulpaep, A. Vandersteen, I. Segers-Nolten, K. Van Der Werf, V. Subramaniam, D. Braeken, G. Callewaert, C. Bartic, R. D'Hooge, I. C. Martins, F. Rousseau, J. Schymkowitz and B. De Strooper, EMBO J., 2010, 29, 3408–3420 CrossRef CAS PubMed.
- Y. Yan and C. Wang, J. Mol. Biol., 2007, 369, 909–916 CrossRef CAS PubMed.
- J. Kim, L. Onstead, S. Randle, R. Price, L. Smithson, C. Zwizinski, D. W. Dickson, T. Golde and E. McGowan, J. Neurosci., 2007, 27, 627–633 CrossRef CAS PubMed.
- A. Vandersteen, M. F. Masman, G. De Baets, W. Jonckheere, K. van der Werf, S. J. Marrink, J. Rozenski, I. Benilova, B. De Strooper, V. Subramaniam, J. Schymkowitz, F. Rousseau and K. Broersen, J. Biol. Chem., 2012, 287, 36732–36743 CrossRef CAS PubMed.
- K. Pauwels, T. L. Williams, K. L. Morris, W. Jonckheere, A. Vandersteen, G. Kelly, J. Schymkowitz, F. Rousseau, A. Pastore, L. C. Serpell and K. Broersen, J. Biol. Chem., 2012, 287, 5650–5660 CrossRef CAS PubMed.
- E. Hubin, N. A. J. van Nuland, K. Broersen and K. Pauwels, Cell. Mol. Life Sci., 2014, 71, 3507–3521 CrossRef CAS PubMed.
- N. D. Younan, C. J. Sarell, P. Davies, D. R. Brown and J. H. Viles, FASEB J., 2013, 27, 1847–1858 CrossRef CAS PubMed.
- M. E. Oskarsson, J. F. Paulsson, S. W. Schultz, M. Ingelsson, P. Westermark and G. T. Westermark, Am. J. Pathol., 2015, 185, 834–846 CrossRef CAS PubMed.
- R. Resende, S. C. F. Marques, E. Ferreiro, I. Simões, C. R. Oliveira and C. M. F. Pereira, Neurochem. Res., 2013, 38, 797–806 CrossRef CAS PubMed.
- D. Frost, P. M. Gorman, C. M. Yip and A. Chakrabartty, Eur. J. Biochem., 2003, 270, 654–663 CrossRef CAS PubMed.
- R. Cukalevski, X. Yang, G. Meisl, U. Weininger, K. Bernfur, B. Frohm, T. P. J. Knowles and S. Linse, Chem. Sci., 2015, 6, 4215–4233 RSC.
- J. T. Jarrett, E. P. Berger and P. T. Lansbury, Biochemistry, 1993, 32, 4693–4697 CrossRef CAS PubMed.
- S. W. Snyder, U. S. Ladror, W. S. Wade, G. T. Wang, L. W. Barrett, E. D. Matayoshi, H. J. Huffaker, G. A. Krafft and T. F. Holzman, Biophys. J., 1994, 67, 1216–1228 CrossRef CAS PubMed.
- K. Hasegawa, I. Yamaguchi, S. Omata, F. Gejyo and H. Naiki, Biochemistry, 1999, 38, 15514–15521 CrossRef CAS PubMed.
- K. Zou, D. Kim, A. Kakio, K. Byun, J.-S. Gong, J. Kim, M. Kim, N. Sawamura, S. Nishimoto, K. Matsuzaki, B. Lee, K. Yanagisawa and M. Michikawa, J. Neurochem., 2003, 87, 609–619 CrossRef CAS PubMed.
- Y. Yoshiike, D.-H. Chui, T. Akagi, N. Tanaka and A. Takashima, J. Biol. Chem., 2003, 278, 23648–23655 CrossRef CAS PubMed.
- A. Jan, O. Gokce, R. Luthi-Carter and H. A. Lashuel, J. Biol. Chem., 2008, 283, 28176–28189 CrossRef CAS PubMed.
- Y.-J. Chang and Y.-R. Chen, FEBS J., 2014, 281, 2674–2687 CrossRef CAS PubMed.
- J. Tran, D. Chang, F. Hsu, H. Wang and Z. Guo, FEBS Lett., 2017, 591, 177–185 CrossRef CAS PubMed.
- M. Török, S. Milton, R. Kayed, P. Wu, T. McIntire, C. G. Glabe and R. Langen, J. Biol. Chem., 2002, 277, 40810–40815 CrossRef PubMed.
- L. Gu and Z. Guo, J. Neurochem., 2013, 126, 305–311 CrossRef CAS PubMed.
- I. Benilova, E. Karran and B. De Strooper, Nat. Neurosci., 2012, 15, 349–357 CrossRef CAS PubMed.
- K. L. Viola and W. L. Klein, Acta Neuropathol., 2015, 129, 183–206 CrossRef CAS.
- S. M. Decatur, Acc. Chem. Res., 2006, 39, 169–175 CrossRef CAS PubMed.
- S. D. Moran and M. T. Zanni, J. Phys. Chem. Lett., 2014, 5, 1984–1993 CrossRef CAS PubMed.
- K. Hauser, C. Krejtschi, R. Huang, L. Wu and T. A. Keiderling, J. Am. Chem. Soc., 2008, 130, 2984–2992 CrossRef CAS PubMed.
- P. I. Haris, G. T. Robillard, A. A. Van Dijk and D. Chapman, Biochemistry, 1992, 31, 6279–6284 CrossRef CAS PubMed.
- M. Zhang, H. Fabian, H. H. Mantsch and H. J. Vogel, Biochemistry, 1994, 33, 10883–10888 CrossRef CAS PubMed.
- J. Nguyen, M. A. Baldwin, F. E. Cohen and S. B. Prusiner, Biochemistry, 1995, 34, 4186–4192 CrossRef CAS PubMed.
- J. O. Matos, G. Goldblatt, J. Jeon, B. Chen and S. A. Tatulian, J. Phys. Chem. B, 2014, 118, 5637–5643 CrossRef CAS PubMed.
- S. D. Moran, T. O. Zhang and M. T. Zanni, Protein Sci., 2014, 23, 321–331 CrossRef CAS PubMed.
- Y. N. Chirgadze and N. A. Nevskaya, Biopolymers, 1976, 15, 607–625 CrossRef CAS PubMed.
- P. Bour and T. A. Keiderling, J. Mol. Struct., 2004, 675, 95–105 CrossRef CAS.
- J. Kubelka and T. A. Keiderling, J. Am. Chem. Soc., 2001, 123, 12048–12058 CrossRef CAS PubMed.
- J. Kubelka and T. A. Keiderling, J. Am. Chem. Soc., 2001, 123, 6142–6150 CrossRef CAS PubMed.
- A. Barth, Biochim. Biophys. Acta, 2007, 1767, 1073–1101 CrossRef CAS PubMed.
- H. Komatsu, L. Liu, I. V. J. Murray and P. H. Axelsen, Biochim. Biophys. Acta, Biomembr., 2007, 1768, 1913–1922 CrossRef CAS PubMed.
- C. Paul and P. H. Axelsen, J. Am. Chem. Soc., 2005, 127, 5754–5755 CrossRef CAS PubMed.
- S. Shim, R. Gupta, Y. L. Ling, D. B. Strasfeld, D. P. Raleigh and M. T. Zanni, Proc. Natl. Acad. Sci. U. S. A., 2009, 106, 6614–6619 CrossRef CAS PubMed.
- K. J. Halverson, I. Sucholeiki, T. T. Ashburn and P. T. Lansbury, J. Am. Chem. Soc., 1991, 113, 6701–6703 CrossRef CAS.
- S. D. Moran, A. M. Woys, L. E. Buchanan, E. Bixby, S. M. Decatur and M. T. Zanni, Proc. Natl. Acad. Sci. U. S. A., 2012, 109, 3329–3334 CrossRef CAS PubMed.
- E. B. Dunkelberger, M. Grechko and M. T. Zanni, J. Phys. Chem. B, 2015, 119, 14065–14075 CrossRef CAS PubMed.
- S. Krimm and Y. Abe, Proc. Natl. Acad. Sci. U. S. A., 1972, 69, 2788–2792 CrossRef CAS.
- L. N. Zhao, T. Zhang, C. Zhang, C. Wang, L. A. Morozova-Roche, L. Y. Chew and Y. Mu, RSC Adv., 2013, 3, 24081 RSC.
- C. Wang, A. G. Klechikov, A. L. Gharibyan, S. K. T. S. Wärmländer, J. Jarvet, L. Zhao, X. Jia, S. K. Shankar, A. Olofsson, T. Brännström, Y. Mu, A. Gräslund and L. A. Morozova-Roche, Acta Neuropathol., 2014, 127, 507–522 CrossRef CAS PubMed.
- H. Itou, M. Yao, I. Fujita, N. Watanabe, M. Suzuki, J. Nishihira and I. Tanaka, J. Mol. Biol., 2002, 316, 265–276 CrossRef CAS PubMed.
- J. Schnatwinkel, Structure and dynamics of amyloid β oligomers, Stockholm University, Master's Thesis, 2016 Search PubMed.
Footnote |
| † Electronic supplementary information (ESI) available. See DOI: 10.1039/c7sc01743j |
| This journal is © The Royal Society of Chemistry 2017 |