 Open Access Article
Creative Commons Attribution 3.0 Unported Licence
Imaging of formaldehyde in plants with a ratiometric fluorescent probe†
Zhen
Li‡
a,
Yuqing
Xu‡
a,
Hailiang
Zhu
*a and
Yong
Qian
 *ab
*ab
aState Key Laboratory of Pharmaceutical Biotechnology, School of Life Sciences, Nanjing University, No. 163 Xianlin Road, Nanjing 210023, China. E-mail: yongqian@nju.edu.cn
bCollege of Chemistry and Materials Science, Nanjing Normal University, No. 1 Wenyuan Road, Nanjing, 210046, China. E-mail: yongqian@njnu.edu.cn
First published on 6th June 2017
Abstract
The fluorescence monitoring of formaldehyde in real environmental samples and live plant tissues is of great importance for physiological and pathological studies. However, there is a lack of suitable chemical tools to directly trace and measure the formaldehyde activity in bio-systems, and developing effective and, in particular, selective sensors for mapping formaldehyde in live tissues still remains a great challenge. Here, we demonstrate for the first time that the ratiometric fluorescence monitoring of formaldehyde in live plant tissues is achieved with a newly developed ratiometric fluorescent probe, FAP, which effectively eliminated interference from other comparative analytes. Live tissue analyses reveal that FAP can potentially detect exogenous and endogenous formaldehyde in live Arabidopsis thaliana tissues, exposing a potential application for biological and pathological studies of formaldehyde.
Introduction
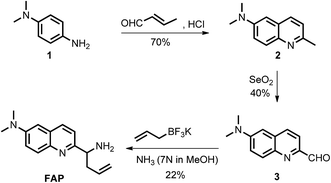
Formaldehyde (FA), the simplest of the aldehydes with the formula H–CHO, has been widely used as an important precursor to many industrial materials and chemical compounds.1 On the other hand, it has also been classified as a highly toxic compound to living organisms, because its strong interactions with proteins, nucleic acids and other biomolecules will lead to the inactivation of their biological activities.2 For instance, excess exposure of exogenous FA to the human body will lead to a significant health threat and cause many diseases,3–6 including various cancers, heart disorders, diabetes, etc. Indeed, it has been regarded as a suspected carcinogen and well-known human toxicant. In plants, FA pollution is a widespread problem that can affect plant growth and development, causing a significant decrease of the productivity and quality in agriculture.7 But, interestingly, intracellular FA can be endogenously formed by normal physiological processes and spontaneously removed by complex metabolism using detoxification mechanisms. It has been demonstrated that glutathione-dependent FA dehydrogenase (FALDH), as a key enzyme of FA metabolism, plays an essential role in the uptake and detoxification of FA in Arabidopsis plants.8 Thus, the concentration of FA in living organisms is generally maintained in a dynamic state of equilibrium ranging from low to high millimolar levels.8–11 For instance, a small pool of FA (0.1–10 μmol g−1 fresh weight) was identified in the intermediate of the C1 metabolism of plants.12,13 The primary sources of FA in plants are caused by the processes of methanol oxidation, dissociation of 5,10-methylene-THF, glyoxylate decarboxylation and other oxidative demethylation reactions.14 Exogenous FA can also be absorbed and incorporated into the metabolism of plants.7,15,16 As a result, phytoremediation has been extensively applied for the removal of FA from the polluted environment. However, the biological roles of FA and the mechanism of FA metabolism in plants have not yet been clearly defined,14 and they are still challenging to study due to the lack of tools that can map the distribution of FA in live tissues. Thus, in order to understand the biological and pathological roles of FA well, it is crucial to develop sensitive methods or chemical tools for tracing and identifying FA in environmental samples and live plant tissues.Coupled with fluorescence microscopy techniques, fluorescent imaging using small molecular fluorescent probes to study biological species in living bio-systems has attracted great interest owing to its high spatiotemporal resolution, non-invasiveness, high sensitivity, and excellent selectivity,17–28 which can offer the opportunity to monitor FA directly and easily in different biological contexts. However, the effective and, in particular, selective mapping of FA activity in live tissues with fluorescent probes still remains a great challenge. Recently, only a few fluorescent turn-on probes have been reported for monitoring FA.17–21,29 Some could be successfully used for imaging FA in living cells, others were primarily applied for the in vitro determination of FA in water. These intensity-based fluorescent probes may have a number of limitations imposed by the fluorescent turn-on response at a single detection window, which means it is difficult to obtain accurate information when testing the FA concentration. Moreover, these turn-on responses can also vary depending on the experimental conditions, including the probe concentration, excitation intensity, temperature, and instrument efficiency.30 To minimize most of the aforementioned artificial and environmental factors, an attractive approach for the determination of FA in environmental samples and live tissues is developing ratiometric fluorescent probes, due to their quantitative tracking ability and self-calibration effect.23,31,32 So far, there is only one reported ratiometric fluorescent probe for monitoring FA,33 but its relatively low excitation in the UV range and its short emission wavelength might easily be overwhelmed by the tissue’s auto-fluorescence background, thereby limiting the probe’s further application in live tissue. In addition, fluorescent probes that have the ability to image inside live plant tissues to provide relevant information on endogenous FA are particularly attractive, but no such probe has been reported to date. Therefore, developing novel ratiometric probes that can be applied for the in vivo imaging of FA with highly sensitive and selective responses is critically important and there is strong demand. We herein present the development and application of a FA probe, FAP (Scheme 1), a new ratiometric fluorescent sensor that can selectively report formaldehyde in real water samples and enable tracking of the endogenous FA activity in live tissues of Arabidopsis thaliana for the first time.
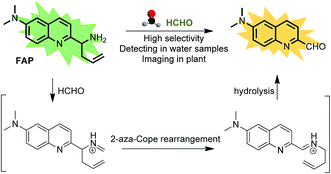 | ||
| Scheme 1 The structure of FAP and the proposed ratiometric sensing mechanism for monitoring formaldehyde (FA). | ||
Results and discussion
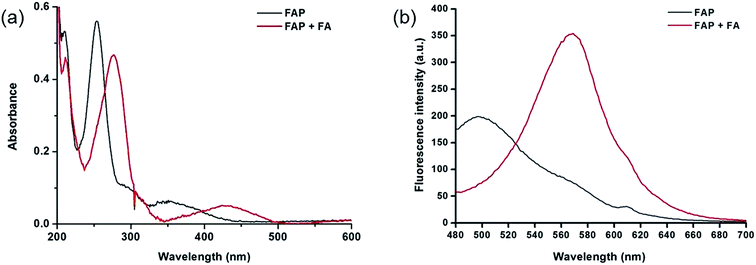
To design this new FA ratiometric fluorescent probe, we focus on the 2-aza-Cope rearrangement reaction,34 as illustrated in Scheme 1, where the starting imine intermediate can be formed by the selective capture of FA with a homoallylamino group, and it will further undergo a simple rearrangement and hydrolysis process to yield an aldehyde product,17,18 potentially resulting in obvious changes of the fluorescence properties. Thus, we envisioned that the homoallylamino group can possibly serve as the FA selective response site. Subsequently, in order to obtain a ratiometric response, we chose a well-known N,N-dimethylquinolin-6-amine as the fluorescent chromophore because of its exhibited excellent photophysical and chemical properties,35,36 which has been used in the design of other reported ratiometric fluorescent probes as a fluorescence reporter. We anticipated that the free probe would exhibit a relatively short emission wavelength owing to the internal charge transfer (ICT) effect between the N,N-dimethyl group and the 2-position homoallylamine of the chromophore. Upon treatment with FA, however, the homoallylamino group would change into an aldehyde group via specifically activated processes, which would then cause an increase in the electron withdrawing ability, thereby inducing the red shift of the fluorescence emission spectrum of the probe and producing a ratiometric response for FA. Based on these design considerations, we then synthesized the fluorescent probe, FAP, in three steps starting from commercially available N1,N1-dimethylbenzene-1,4-diamine (Scheme 2), and the structures of the target compounds were fully characterized by 1H and 13C NMR spectroscopy and mass spectrometry (see the ESI†).As expected, the homoallylamino modification on FAP leads to relatively short absorbance and fluorescence. The free FAP (20 μM) exhibited two absorption peaks at 254 nm and 353 nm, and one broad emission peak at 495 nm. However, the incubation of 20 μM FAP with 1 mM FA resulted in a remarkable red shift of the absorbance signals (23 nm and 76 nm, respectively). As shown in Fig. 1a, two obvious absorption bands with peaks at 277 nm and 429 nm newly emerged, and the intensities of the original peaks at 254 nm and 353 nm simultaneously decreased; meanwhile, accompanying the reaction of FAP with FA, the emission wavelength was also obviously shifted (75 nm), affording an important enhancement of the fluorescence emission band at 570 nm and a significant decrease at 495 nm (Fig. 1b). These in vitro responses of FAP validate the previous design strategy and confirm that FAP is a good sensor for in vitro formaldehyde determination. In order to elaborate the reaction mechanism, we then monitored the reactions between FAP and FA using HPLC and analysed the reactions using MS and IR spectroscopy. The reactions with different incubation times showed clean conversion, and a new peak (m/z = 201.1), identified as the product with the expected mass of the aromatic aldehyde (3), began to appear after 1 h of incubation (Fig. S1 and S2†). The reactions of different FA concentrations also showed a gradual decrease in the probe peak and a corresponding increase in the product peak with increasing FA concentration (Fig. S2†). In addition, a signal of the freshly formed –CHO– group was also clearly observed in the IR spectrum after treatment with FA (Fig. S3†). Taken together, these findings show that the formation of the aldehyde is indeed promoted by reacting with FA.
To assess the response time of FAP towards FA, a solution of FAP (20 μM) was added to FA (2 mM) in PBS buffer (10 mM, pH 7.4, containing 1% MeCN) for different incubation times and then measured by a fluorescence spectrometer (Fig. S4†). Importantly, a significant ratiometric change was observed even after 5 min, accompanying a pronounced enhancement of the fluorescence intensity at 570 nm and a distinct reduction at 495 nm, whereas the emission band at 570 nm was gradually enhanced with the extension of the incubation time even after 180 min. Specifically, the fluorescence ratio I570/I495 increased by 9-fold upon reaction with FA for 120 min. In order to observe the relatively obvious fluorescence changes at an appropriate incubation time, we chose a reaction time of 120 min to further investigate the pH effect on the probe, FAP. We measured the fluorescence signal ratios of I570/I495 towards FA (2 mM) in PBS buffer with various pHs ranging from 3.0 to 11.0 and, surprisingly, found that FAP shows a relatively wide range of pH application (Fig. S5†). Importantly, the remarkable ratiometric fluorescence response and the wide range of pH application of FAP are advantageous to minimizing the interference of the fluorescence background and increasing the fidelity of the detection signal.
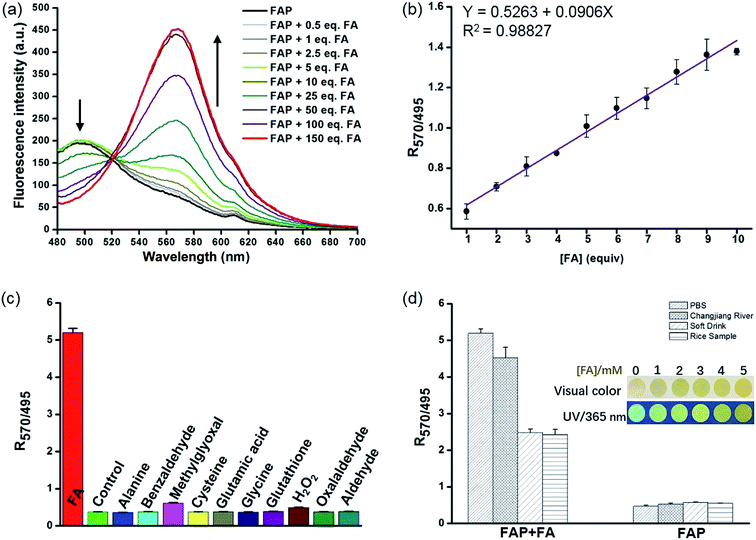
Encouraged by these results, we sought to investigate the sensitivity of FAP for FA, and we assessed the fluorescence response of FAP (20 μM) with different concentrations of FA (0–3 mM) in PBS buffer at 37 °C. The incubation of FAP with increasing concentrations of FA resulted in a gradual increase of the emission intensity at 570 nm and a corresponding decrease at 495 nm (Fig. 2 and S6†). Strikingly, an excellent linear dependence (R2 = 0.98827) between the fluorescence signal ratios of I570/I495 and the concentrations of FA (0–200 μM) was observed. Moreover, to further evaluate the validity and stability of the slope, different concentrations of FA (1.5, 4.5 and 9.5 equivalent) were spiked into the PBS buffer and incubated with FAP (20 μM) for 120 min (Fig. S7†). After a calculation using a calibration curve, seen in Fig. 2b, the concentration of formaldehyde was determined, and the resultant FA recoveries ranged from 98% to 106%, revealing that FAP has potential capability for quantitatively monitoring FA. The limit of detection (LOD) of FAP for the detection of FA was 0.5 μM in aqueous solution based on the signal-to-noise ratio (S/N = 3).
The selectivity of the fluorescent probe is an important parameter for assessing if it is suitable for biological application. To determine whether FAP could detect FA specifically, we then examined the fluorescence signal and compared the ratio values of the fluorescence intensity at 570 nm to 495 nm (I570/I495) after incubation with a series of comparative analytes, including benzaldehyde, methylglyoxal, oxalaldehyde, GSH, H2O2, amino acids, etc. As seen in Fig. 2c and S8,† the largest change of the fluorescence signal ratio was observed upon the addition of FA, while the addition of 100 equiv. of the other analytes displayed a negligible response. FAP displayed a 9–13-fold greater response toward FA than the other analytes (Fig. 2c). Additionally, exposing FAP to a mixture of FA and other species still yielded a significantly increased fluorescence ratio (I570/I495) (Fig. S9†). These results clearly indicate that FAP exhibits excellent selectivity for FA over other analytes. Collectively, these selective and sensitive assays unambiguously suggest that FAP has potential capability for tracking FA in environmental and biological samples.
Having established FAP determination, we next moved on to evaluate the practicability of FAP. We initially carried out experiments using real-water samples from the Changjiang River, as well as soft drink and rice water samples. FA (2 mM) was previously spiked into these real-water samples and incubated with FAP (20 μM) for 2 hours (Fig. 2d). Obvious changes of the fluorescence signal ratio were observed after incubation of FA in these buffer systems, while the soft drink and rice water samples only showed relatively moderate changes that might be because FA was partially consumed via the interaction with biomolecules. But fortunately, these changes of the fluorescence signal ratio were enough to help us achieve the determination of FA in the real-water samples. Moreover, we prepared dried FA test papers by dipping paper into a FAP solution and further evaporating to remove the solvent (Fig. 2d inset). Interestingly, using this simple FA test paper to detect FA solutions with various concentrations exhibited quick color changes from green to yellow within several seconds, indicating the potential utility of FAP as a simple sensor for tracking FA in environmental samples.
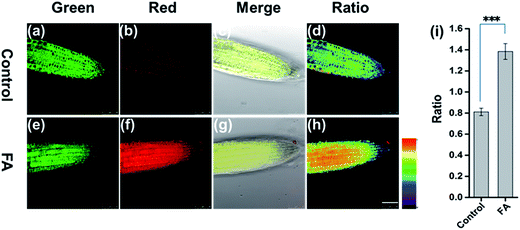
To address the capability of FAP for mapping FA in live tissue, we employed FAP to image FA in the live root tip tissue of Arabidopsis thaliana using a confocal fluorescence microscope. As shown in Fig. 3, the root tip tissues of Arabidopsis thaliana were pretreated with FAP (50 μM) for 45 min, and subsequently different concentrations of exogenous FA (0 or 3 mM) were added and incubated for another 120 min. Gratifyingly, FAP can effectively penetrate the cell wall and cell membrane, and can display a bright fluorescence in the green channel and relatively weak fluorescence in the red channel, suggesting that live Arabidopsis thaliana tissues have a low level of intracellular FA activity.12,13 Importantly, upon incubation with a typical stress concentration of exogenous FA (3 mM), a significant change of the fluorescence signal ratio is observed in the ratiometric fluorescence image (Fred/Fgreen) (Fig. 3). This indicates that the alteration of the intracellular FA levels in live plant tissues can be reflected by the fluorescence change of FAP. Notably, these FA concentrations fall well within the scope of physiological concentration, treating the condition of formaldehyde stress in plants, and are estimated to be 0.1–10 μmol g−1 in the fresh weight of a plant,13 and up to 2–8 mM in the external treatment of HCHO stress.14,15,37
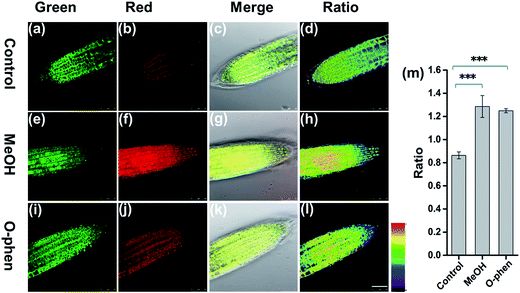
To further investigate whether FAP can be applied to detect the change of endogenous FA levels in live plant tissues, we pretreated live root tip tissues of Arabidopsis thaliana with 10% MeOH stress for 1 h to induce the production of endogenous FA,38 then incubated with FAP (50 μM) for another 3 hours and imaged after washing with PBS (Fig. 4). The endogenous FA freshly formed via MeOH pretreatment results in an obvious change of the fluorescence signal ratio in the ratiometric fluorescence image compared with the negative control. Furthermore, the stimulation of endogenous FA uptake with 1 mM o-phenanthroline, a known inhibitor of formaldehyde dehydrogenase,39 also yielded a statistically significant increase in the fluorescence ratio (Fig. 4). All of these data suggest that FAP is capable of ratiometric monitoring of endogenous FA activity in Arabidopsis thaliana in vivo. Finally, we tried to apply FAP to measure the endogenous formaldehyde concentration in the fresh root and leaf tissues of Arabidopsis thaliana. Spiked HCHO was used as the internal standard in the prepared tissue homogenate. The spiked samples were subsequently incubated with the 20 μM probe for 2 hours and then monitored (Fig. S10†). We found that the concentrations of endogenous formaldehyde in the fresh homogenates of the Arabidopsis thaliana root and leaf tissues are 1.8 μmol g−1 and 4.2 μmol g−1, respectively. This result is consistent with the previous report that the average endogenous FA concentration was estimated to be 0.1–10 μmol g−1 of the fresh weight of the plant.13 Taken together, these findings demonstrate that FAP displays the ability of detection of the biologically relevant endogenous formaldehyde in live plant tissues.
Conclusions
In summary, we have successfully developed a ratiometric fluorescent probe, FAP, for monitoring formaldehyde based on the N,N-dimethylquinolin-6-amine fluorophore for the first time. This probe displayed a significant red shift (75 nm) in the emission profiles and an obvious change of the fluorescence signal ratio for the response of FA. We have demonstrated that this highly selective and effective probe has potential capability for monitoring FA in real-water samples and live plant tissues. In vivo imaging results show that FAP can not only effectively map exogenous FA, but also can sensitively track endogenous FA. To the best of our knowledge, this is the first example of a fluorescent probe-based methodology for the ratiometric imaging of endogenous FA in plant tissues. With these insights, we anticipate that the further application of FAP to the fluorescent imaging of FA in other plants will enable better understanding of its metabolism mechanism, thus promoting the progress of FA related physiological and pathological studies.Acknowledgements
This work is financially supported by grants from the National Natural Science Foundation of China (21302094), the Jiangsu Natural Science Foundation (BK20130552), the Research Fund for the Doctoral Program of Higher Education of China (20130091120036), the Fundamental Research Funds for the Central Universities (20620140214), and the Scientific Research Foundation of Nanjing Normal University (184080H202B95).Notes and references
- M. A. Flyvholm and P. Andersen, Am. J. Ind. Med., 1993, 24, 533–552 CrossRef CAS PubMed.
- E. A. Hoffman, B. L. Frey, L. M. Smith and D. T. Auble, J. Biol. Chem., 2015, 290, 26404–26411 CrossRef CAS PubMed.
- R. Baan, Y. Grosse, K. Straif, B. Secretan, F. El Ghissassi, V. Bouvard, L. Benbrahim-Tallaa, N. Guha, C. Freeman, L. Galichet and V. Cogliano, Lancet Oncol., 2009, 10, 1143–1144 CrossRef PubMed.
- Z. Tong, C. Han, W. Luo, X. Wang, H. Li, H. Luo, J. Zhou, J. Qi and R. He, Age, 2013, 35, 583–596 CrossRef PubMed.
- M. Hauptmann, P. A. Stewart, J. H. Lubin, L. E. Beane Freeman, R. W. Hornung, R. F. Herrick, R. N. Hoover, J. F. Fraumeni Jr, A. Blair and R. B. Hayes, J. Natl. Cancer Inst., 2009, 101, 1696–1708 CrossRef CAS PubMed.
- P. H. Yu, J. Neural Transm., Suppl., 1998, 52, 201–216 CAS.
- M. Giese, U. Bauer-Doranth, C. Langebartels and H. Sandermann Jr, Plant Physiol., 1994, 104, 1301–1309 CrossRef CAS PubMed.
- H. Achkor, M. Diaz, M. R. Fernandez, J. A. Biosca, X. Pares and M. C. Martinez, Plant Physiol., 2003, 132, 2248–2255 CrossRef CAS PubMed.
- A. D. Hanson and S. Roje, Annu. Rev. Plant Physiol. Plant Mol. Biol., 2001, 52, 119–137 CrossRef CAS PubMed.
- H. Heck and M. Casanova, Regul. Toxicol. Pharmacol., 2004, 40, 92–106 CrossRef CAS PubMed.
- S. Kato, P. J. Burke, T. H. Koch and V. M. Bierbaum, Anal. Chem., 2001, 73, 2992–2997 CrossRef CAS PubMed.
- G. Blunden, B. G. Carpenter, M. Adrian-Romero, M. H. Yang and E. Tyihak, Acta Biol. Hung., 1998, 49, 239–246 CAS.
- L. Trezl, L. Hullan, T. Szarvas, A. Csiba and B. Szende, Acta Biol. Hung., 1998, 49, 253–263 CAS.
- R. Wang, Z. Zeng, T. Liu, A. Liu, Y. Zhao, K. Li and L. Chen, Plant Physiol. Biochem., 2016, 105, 233–241 CrossRef CAS PubMed.
- L. M. Chen, H. Yurimoto, K. Z. Li, I. Orita, M. Akita, N. Kato, Y. Sakai and K. Izui, Biosci., Biotechnol., Biochem., 2010, 74, 627–635 CrossRef CAS PubMed.
- S. Zhou, S. Xiao, X. Xuan, Z. Sun, K. Li and L. Chen, Plant Physiol. Biochem., 2015, 89, 53–63 CrossRef CAS PubMed.
- T. F. Brewer and C. J. Chang, J. Am. Chem. Soc., 2015, 137, 10886–10889 CrossRef CAS PubMed.
- A. Roth, H. Li, C. Anorma and J. Chan, J. Am. Chem. Soc., 2015, 137, 10890–10893 CrossRef CAS PubMed.
- Y. Tang, X. Kong, A. Xu, B. Dong and W. Lin, Angew. Chem., Int. Ed. Engl., 2016, 55, 3356–3359 CrossRef CAS PubMed.
- Y. H. Lee, Y. Tang, P. Verwilst, W. Lin and J. S. Kim, Chem. Commun., 2016, 52, 11247–11250 RSC.
- J. B. Li, Q. Q. Wang, L. Yuan, Y. X. Wu, X. X. Hu, X. B. Zhang and W. Tan, Analyst, 2016, 141, 3395–3402 RSC.
- Y. Qian, M. Schurmann, P. Janning, C. Hedberg and H. Waldmann, Angew. Chem., Int. Ed. Engl., 2016, 55, 7766–7771 CrossRef CAS PubMed.
- T. Liu, J. Lin, Z. Li, L. Lin, Y. Shen, H. Zhu and Y. Qian, Analyst, 2015, 140, 7165–7169 RSC.
- Y. Qian, J. Karpus, O. Kabil, S. Y. Zhang, H. L. Zhu, R. Banerjee, J. Zhao and C. He, Nat. Commun., 2011, 2, 495 CrossRef PubMed.
- S. Bhuniya, S. Maiti, E. J. Kim, H. Lee, J. L. Sessler, K. S. Hong and J. S. Kim, Angew. Chem., Int. Ed. Engl., 2014, 53, 4469–4474 CrossRef CAS PubMed.
- J. J. Hu, N. K. Wong, S. Ye, X. Chen, M. Y. Lu, A. Q. Zhao, Y. Guo, A. C. Ma, A. Y. Leung, J. Shen and D. Yang, J. Am. Chem. Soc., 2015, 137, 6837–6843 CrossRef CAS PubMed.
- K. Xu, D. Luan, X. Wang, B. Hu, X. Liu, F. Kong and B. Tang, Angew. Chem., Int. Ed. Engl., 2016, 55, 12751–12754 CrossRef CAS PubMed.
- X. Wu, L. Li, W. Shi, Q. Gong and H. Ma, Angew. Chem., Int. Ed. Engl., 2016, 55, 14728–14732 CrossRef CAS PubMed.
- Y. Tang, X. Kong, Z. R. Liu, A. Xu and W. Lin, Anal. Chem., 2016, 88, 9359–9363 CrossRef CAS PubMed.
- Z. Guo, G. H. Kim, J. Yoon and I. Shin, Nat. Protoc., 2014, 9, 1245–1254 CrossRef CAS PubMed.
- J. Fan, M. Hu, P. Zhan and X. Peng, Chem. Soc. Rev., 2013, 42, 29–43 RSC.
- C. Huang, T. Jia, M. Tang, Q. Yin, W. Zhu, C. Zhang, Y. Yang, N. Jia, Y. Xu and X. Qian, J. Am. Chem. Soc., 2014, 136, 14237–14244 CrossRef CAS PubMed.
- L. He, X. Yang, Y. Liu, X. Kong and W. Lin, Chem. Commun., 2016, 52, 4029–4032 RSC.
- C. G. Goodman and J. S. Johnson, J. Am. Chem. Soc., 2015, 137, 14574–14577 CrossRef CAS PubMed.
- L. Xue, G. Li, D. Zhu, Q. Liu and H. Jiang, Inorg. Chem., 2012, 51, 10842–10849 CrossRef CAS PubMed.
- Q. Q. Wu, Z. F. Xiao, X. J. Du and Q. H. Song, Chem.–Asian J., 2013, 8, 2564–2568 CrossRef CAS PubMed.
- Z. B. Song, S. Q. Xiao, L. You, S. S. Wang, H. Tan, K. Z. Li and L. M. Chen, Plant, Cell Environ., 2013, 36, 1490–1506 CrossRef CAS PubMed.
- A. Downie, S. Miyazaki, H. Bohnert, P. John, J. Coleman, M. Parry and R. Haslam, Phytochemistry, 2004, 65, 2305–2316 CrossRef CAS PubMed.
- S. Ogushi, M. Ando and D. Tsuru, J. Biochem., 1984, 96, 1587–1591 CrossRef CAS PubMed.
Footnotes |
| † Electronic supplementary information (ESI) available. See DOI: 10.1039/c7sc00373k |
| ‡ These authors contributed equally to this work. |
| This journal is © The Royal Society of Chemistry 2017 |

