
 Open Access Article
 This Open Access Article is licensed under a Creative Commons Attribution-Non Commercial 3.0 Unported Licence
Two-photon fluorescent probe for revealing drug-induced hepatotoxicity via mapping fluctuation of peroxynitrite†
Yong
Li‡
,
Xilei
Xie‡
,
Xiu’e
Yang
,
Mengmeng
Li
,
Xiaoyun
Jiao
,
Yuhui
Sun
,
Xu
Wang
* and
Bo
Tang
 *
*
College of Chemistry, Chemical Engineering and Materials Science, Collaborative Innovation Center of Functionalized Probes for Chemical Imaging in Universities of Shandong, Key Laboratory of Molecular and Nano Probes, Ministry of Education, Institute of Molecular and Nano Science, Shandong Normal University, Jinan 250014, P. R. China. E-mail: tangb@sdnu.edu.cn; wangxu@sdnu.edu.cn
First published on 20th March 2017
Abstract
Drug-induced injury has attracted increasing attention in public health issues. Among them, hepatotoxicity has been regarded as the leading clinical problem caused by drug toxicity. However, owing to the complexity of the involved pathophysiological mechanisms and the lack of noninvasive, straightforward, and real-time tools, drug-induced hepatotoxicity has rarely been predicted satisfactorily. In this paper, by utilizing the reactive species peroxynitrite (ONOO−) as a biomarker, we present a two-photon fluorescent probe, TP-KA, holding rapid response, high specificity and sensitivity towards ONOO−, to investigate drug (acetaminophen and tolcapone)-related liver injury and the remediate effect of N-acetyl cysteine (NAC). With the support of TP-KA, we obtained direct and visual evidence of the upregulation of ONOO− during drug challenge both in live cells and mice, which was accompanied by liver tissue injury and tyrosine nitration. These findings demonstrate that ONOO− is a good and appropriate biomarker of hepatotoxicity, and nitrosative stress may be necessary for acetaminophen and tolcapone to exert their toxicity. Moreover, TP-KA can be employed as a powerful tool to pre-detect drug-induced organism injury and study the effect of antidotes.
Introduction
Drug-induced injury, as a long-term concern, has attracted increasing attention as a public health issue. Moreover, it is cited as the most common reason for an approved drug to be withdrawn from the market, or labelled with a black box warning.1,2 Attributed to the central role of transforming and clearing exogenous and endogenous xenobiotics from the human body, the liver is often the most susceptible to damage by drugs, which ultimately results in hepatotoxicity being regarded as the leading clinical problem.3–5 As such, the preclinical investigation of drug-induced hepatotoxicity is required to improve patient safety and therapeutic treatment.Unfortunately, owing to the complexity of the involved pathophysiological mechanisms, drug-induced hepatotoxicity has rarely been predicted satisfactorily.6–8 In general, it is reported that the reactive metabolites formed from drugs are responsible for most cases of hepatotoxicity,9–11 which are usually accompanied by the generation of reactive small molecules, including reactive oxygen species (ROS) and reactive nitrogen species (RNS).12,13 Therefore, ROS and RNS might be employed as biomarkers to predict drug-related hepatotoxicity.8,14 Peroxynitrite (ONOO−), a kind of RNS which is generated by the diffusion-limited reaction of superoxide anion radicals (O2˙−) with nitric oxide (NO), could be an excellent alternative because of its high oxidative and nitrosative activity towards biomolecules.15,16 Hence, the efficient tracking of ONOO− during drug challenge will add benefits to the in-depth understanding of the hepatotoxicity mechanism. However, the elusive nature of ONOO− under physiological conditions,17 and its properties such as an extremely short half-life (<10 ms), nanomolar homeostasis concentration, and high chemical reactivity, precludes its direct tracking in situ. Recently, fluorescence imaging has gained much attention for its outstanding properties in terms of direct visualization and satisfied temporal and spatial resolution,18–25 and a number of fluorescent probes have been developed for ONOO− detection in biological systems.26–35 Nonetheless, few probes have been utilized to investigate the role ONOO− plays in drug-induced hepatotoxicity,8 especially probes with two-photon excitability since two-photon probes show the advantages of deep tissue penetration, less photodamage, and good resolution.36–39
In this work, a new two-photon fluorescent probe, TP-KA, was designed and synthesized for ONOO− detection with a rapid response, high specificity, and good sensitivity. By capitalizing on its outstanding features, TP-KA was successfully employed in exploring hepatotoxicity events caused by two drugs, namely the analgesic and antipyretic drug, acetaminophen (APAP), and the anti-Parkinson’s disease drug, tolcapone. Encouragingly, with the aid of TP-KA, we verified that the hepatotoxicity mechanism of these two drugs was involved in ONOO− upregulation, which was accompanied by liver tissue injury and tyrosine nitration. Moreover, the remediation of the drug-induced damage was achieved using N-acetyl cysteine (NAC), which might serve as a superior alternative antidote through enhancing the nontoxic metabolism of these drugs. These results demonstrated that through efficient ONOO− evaluation, TP-KA may be a powerful tool to pre-detect clinical drug-induced liver damage and to study the effect of the antidote.
Results and discussion
Design, synthesis, spectral properties, and reactivity
Previously, we fabricated a hydrogen peroxide (H2O2) probe by installing an α-ketoamide moiety onto a hemicyanine fluorophore.40 The α-ketoamide could be cleaved by H2O2, and finally release the hemicyanine dye. ONOO− could also initiate a similar reaction process, and simultaneously destroy the conjugated skeleton of the hemicyanine dye,33 thus it failed to trigger the reported H2O2 probe. Actually, ONOO− is supposed to possess much stronger nucleophilicity than H2O2 under physiological conditions.41 Therefore, in this work, we attempted to construct a new probe (TP-KA) that was specific for ONOO− detection by installing α-ketoamide onto a much more stable fluorophore, 1,8-naphthalimide.42,43 The tert-butyl ester group was introduced to increase lipophilicity and thus enabled TP-KA to penetrate through cell membranes smoothly. We anticipated that TP-KA presented weak and blue-shifted fluorescence emission because the intramolecular charge transfer (ICT) effect was weakened by the electron-withdrawing α-ketoamide group. Once it had reacted with ONOO−, the fluorophore 1,8-naphthalimide would be released and emit striking fluorescence that was attributed to the restored ICT process (Scheme 1).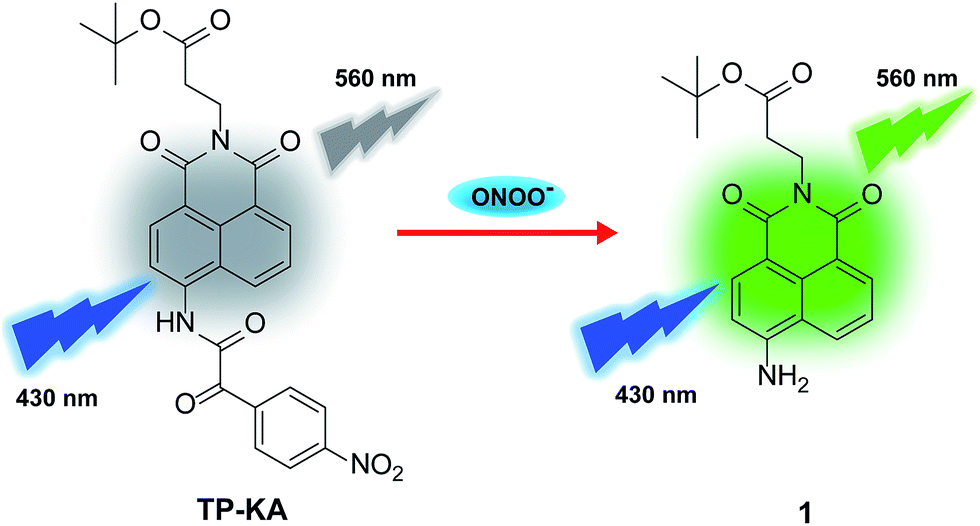 | ||
| Scheme 1 Chemical structure of TP-KA and the corresponding response mechanism. | ||
The synthetic procedure is displayed in Scheme S1.† With TP-KA and compound 1 in hand, their spectral properties were firstly assessed in 50 mM PBS buffer (pH 7.4, 1% DMSO) at 37 °C. As can be seen in Fig. S1,†TP-KA itself displayed its maximal absorbance/emission at 375 nm/454 nm. Due to the weakened ICT effect caused by α-ketoamide, TP-KA showed a spectral blue shift compared to its reaction product 1 (430 nm/560 nm). In addition, TP-KA showed a negligible fluorescence signal when excited at 430 nm. Therefore, to obtain a high signal-to-noise ratio, the following in vitro detection systems were all excited at 430 nm. Subsequently, the reactivity of TP-KA towards H2O2 and ONOO− was evaluated (Fig. S2†). Encouragingly, even when treated with 200 equivalents of H2O2, TP-KA displayed no obvious fluorescence enhancement at 560 nm. Conversely, when incubated with only 10 equivalents of ONOO−, TP-KA exhibited a high turn-on ratio. Therefore, TP-KA was capable of recognizing ONOO− without the interference of H2O2. The selectivity was probably due to the fact that 1,8-naphthalimide decreased the electrophilicity of the α-ketoamide moiety and thus TP-KA could be only attacked by the stronger nucleophile ONOO−.
Kinetic investigation of TP-KA
The kinetic characteristics of TP-KA were investigated (Fig. S3†). In the absence of ONOO−, the constant and weak fluorescence intensity indicated that TP-KA presented a low background signal and was stable towards light irradiation. In the presence of ONOO−, a rapid and drastic fluorescence enhancement was observed within 40 s, and then leveled off, hinting that TP-KA was able to efficiently capture ONOO− in spite of its short lifetime and high activity.The specificity of TP-KA towards ONOO−
The specificity of TP-KA towards ONOO− was examined. Gratifyingly, as illustrated in Fig. 1, no obvious fluorescence intensity change was triggered after the incubation of TP-KA with a number of highly oxidizing ROS or RNS, including H2O2, ClO−, ˙OH, TBHP, O2˙−, 1O2, and NO. Meanwhile, the fluorescence response of TP-KA towards the reductive reactive species in cells, such as glutathione (GSH), cysteine (Cys), homocysteine (Hcy), hydrogen sulfide (H2S), and ascorbic acid (Vc), was also evaluated. Satisfyingly, no significant fluorescence increment was observed. In addition, negligible fluorescence augmentation was induced after the incubation of TP-KA with various cations (Na+, K+, Mg2+, Ca2+, Fe2+, Co2+, Cu2+, Zn2+, and Fe3+), anions (NO2−, NO3−, HCO3−, CH3COO−, CO32−, S2O32−, SO32−, SO42−, and PO43−), and amino acids (Ser, Pro, Thr, Gly, and Val), which commonly exist in biological systems. Collectively, these results demonstrated the high specificity of TP-KA towards ONOO− over other bioanalytes. | ||
| Fig. 1 Fluorescence response of TP-KA (1.0 μM) with various bioanalytes, including ONOO− (10.0 μM), H2O2 (200 μM), other ROS and RNS (10.0 μM), GSH and Cys (5.0 mM), and other interfering substances (100 mM). The data were recorded after the incubation of TP-KA with various bioanalytes for 10 min at 37 °C in PBS buffer (50 mM, 7.4) with 1% DMSO. The values are the mean ± s.d. for n = 3. λex/λem = 430/560 nm. | ||
Fluorescence response of TP-KA towards ONOO−
On the basis of the excellent specificity of TP-KA to ONOO−, the fluorescence spectral variation of TP-KA in the presence of ONOO− was then investigated to profile its response behavior in detail. As can be seen from Fig. 2, upon incubation with different concentrations (0–10 μM) of ONOO−, a gradual dose-dependent fluorescence enhancement was obtained. The fluorescence intensity of TP-KA exhibits an excellent linear relationship (R2 = 0.995) with ONOO− concentration with a regression equation of F = −9086.50 + 11![[thin space (1/6-em)]](https://www.rsc.org/images/entities/char_2009.gif) 698.06 [ONOO−] (μM). The limit of detection (LOD) was calculated to be as low as 25 nM based on 3 σ/k (where σ is the standard deviation of 11 blank samples, and k is the slope of the linear graph), which enabled TP-KA to be sensitive enough for tracing ONOO− in the biosystems. Furthermore, the effect of pH was investigated (Fig. S4†). In the absence of ONOO−, the fluorescence intensity of TP-KA itself remained unchanged at the wide pH range 5.0–9.0, indicating that TP-KA was hardly influenced by the pH. Meanwhile, upon the addition of ONOO−, unchanged and strong fluorescence signals were detected in the pH range 5.0–9.0, which well covered the pH range of physiological environments. Therefore, combined with the results of its outstanding response behavior, TP-KA exhibits robust analytical potential for biological applications.
698.06 [ONOO−] (μM). The limit of detection (LOD) was calculated to be as low as 25 nM based on 3 σ/k (where σ is the standard deviation of 11 blank samples, and k is the slope of the linear graph), which enabled TP-KA to be sensitive enough for tracing ONOO− in the biosystems. Furthermore, the effect of pH was investigated (Fig. S4†). In the absence of ONOO−, the fluorescence intensity of TP-KA itself remained unchanged at the wide pH range 5.0–9.0, indicating that TP-KA was hardly influenced by the pH. Meanwhile, upon the addition of ONOO−, unchanged and strong fluorescence signals were detected in the pH range 5.0–9.0, which well covered the pH range of physiological environments. Therefore, combined with the results of its outstanding response behavior, TP-KA exhibits robust analytical potential for biological applications.
 | ||
| Fig. 2 (a) Fluorescence response of TP-KA (1 μM) to ONOO− (0–10 μM) in PBS buffer (50 mM, pH 7.4) with 1% DMSO. (b) The linear curve derived from the fluorescence intensity at 560 nm and the ONOO− concentration. The spectra were recorded after the incubation of TP-KA with ONOO− for 10 min at 37 °C. The values are the mean ± s.d. for n = 3. λex/λem = 430/560 nm. | ||
The proposed mechanism for the sensing of ONOO−
The reaction mechanism of TP-KA with ONOO− was further confirmed using high resolution mass spectrometer analysis (Fig. S5†). Upon the incubation of TP-KA with ONOO− for 10 min, the reaction mixture was found to have mass peaks at m/z = 341.1672 and m/z = 166.0194, corresponding to compound 1 and the byproduct 4-nitrobenzoic acid, respectively. Both the spectral variations and the mass analysis results strongly validated the proposed sensing mechanism displayed in Scheme S2.†Two-photon fluorescence properties of TP-KA
The two-photon absorption cross-section (δ) of TP-KA and its sensing product 1 were investigated, as δ is a critical parameter for a two-photon imaging probe. The δmax values of TP-KA and compound 1 were acquired at 800 nm and were 95 GM (1 GM = 10−50 m4 s per photon) and 193 GM, respectively. The higher two-photon absorption cross-section of compound 1 over TP-KA could be attributed to its electron donating moiety, the 4-amino group. Moreover, the high δmax value enabled TP-KA to be applied in two-photon fluorescence microscopy imaging.Visualizing exogenous ONOO− in live cells
Encouraged by the notable response properties of TP-KA, the feasibility of it mapping the ONOO− level in biological systems was assessed with a two-photon excitation microscopy (TPM) system. Prior to cell imaging, an MTT assay was performed to identify the cytotoxicity of TP-KA, and the results (Fig. S6†) implied that TP-KA presented excellent biocompatibility (IC50 = 63 μM). Then, utilizing SIN-1 as the ONOO− donor, exogenous ONOO− imaging was performed in HepG2 cells. As displayed in Fig. 3, in the control group, a negligible fluorescence signal was observed in the cells loaded with TP-KA. Contrastingly, a significant enhancement of the intracellular fluorescence intensity was obtained upon SIN-1 exposure, which was efficiently stopped by uric acid, an ONOO− scavenger. Furthermore, the bright field images displayed intact cells, implying the good viability of the cells throughout the experiment. Consequently, the data confirmed that TP-KA showed promise to act as a mapping tool to explore ONOO− fluctuations under biological conditions.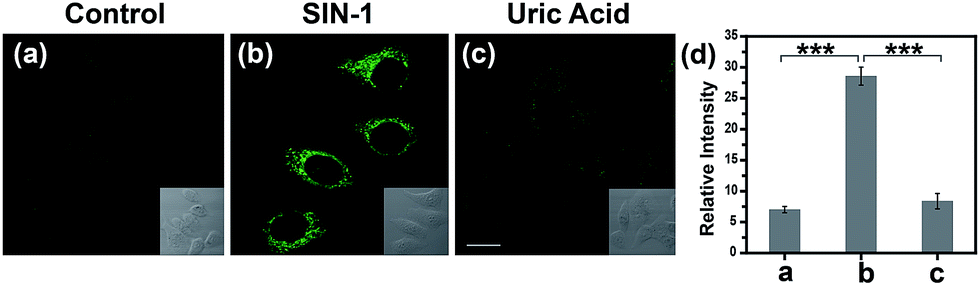 | ||
| Fig. 3 TPM images of exogenous ONOO− in HepG2 cells. (a) The cells were stained with TP-KA (5.0 μM, 20 min). (b) The cells were exposed to SIN-1 (1.0 mM, 30 min) and then incubated with TP-KA (5.0 μM, 20 min). (c) The cells were exposed to SIN-1 (1.0 mM, 30 min) and then treated with uric acid (100 μM, 3 h), followed by incubation with TP-KA (5.0 μM, 20 min). (d) The relative fluorescence intensity of (a)–(c). The images were obtained with 800 nm excitation and 500–600 nm collection. The values are the mean ± s.d. for n = 3, ***p < 0.001. Scale bar = 15 μm. | ||
Imaging drug-induced hepatotoxicity and the remediation effect of NAC
Normally, hepatotoxicity corresponds to chemical-driven liver damage.44 It is well-known that an overdose of acetaminophen (APAP), a common household medication used to treat pain and fever, could induce hepatotoxicity related to the overproduction of ROS and RNS.45 Therefore, by guiding with the imaging biomarker ONOO−, APAP-induced damage was visualized in cells, with the aid of TP-KA. As presented in Fig. 4a–e, after the treatment of APAP, a notably stronger fluorescence signal in HepG2 cells was detected than that observed under normal conditions. Therefore, the results revealed that intracellular ONOO− was upregulated under the administration of APAP, thus contributing to oxidative and nitrosative stress injury. Furthermore, as can be seen in the figure, the strong fluorescence intensity could be effectively attenuated by N-acetyl cysteine (NAC), which remediated cell injury via the depletion of the ROS and RNS levels by increasing the GSH level and binding with the toxic products of APAP.46,47 Therefore, the results indicated that TP-KA exhibited excellent properties for visualizing the cell damage induced by APAP and NAC displayed a good antidotal effect.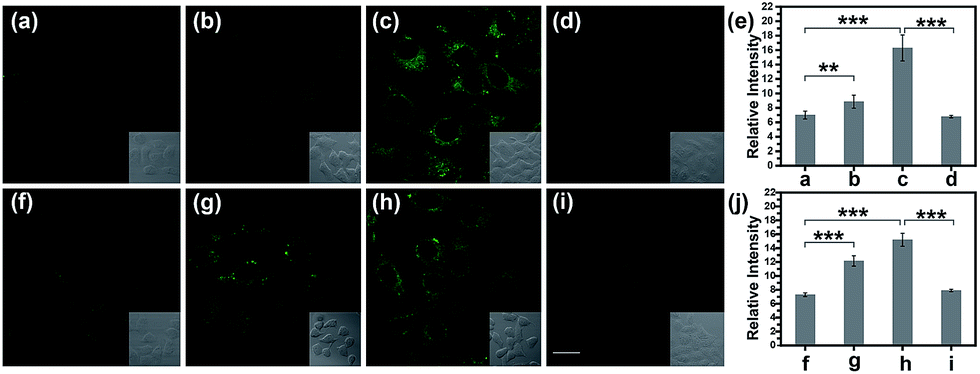 | ||
| Fig. 4 TPM images of drug-induced injury with HepG2 cells. (a) and (f) The cells were stained with TP-KA (5.0 μM, 20 min). (b) and (c) The cells were exposed to 250 and 500 μM APAP for 1 h, respectively, and then treated with TP-KA (5.0 μM, 20 min). (d) The cells were pretreated with NAC (1.0 mM, 1 h), and then exposed to 500 μM APAP, followed by treatment with TP-KA (5.0 μM, 20 min). (g) and (h) The cells were exposed to 250 and 500 μM tolcapone for 1 h, respectively, and then treated with TP-KA (5.0 μM, 20 min). (i) The cells were pretreated with NAC (1.0 mM, 1 h), and then exposed to 500 μM tolcapone, followed by treatment with TP-KA (5.0 μM, 20 min). (e) The relative fluorescence intensity of (a)–(d). (j) The relative fluorescence intensity of (f)–(i). The images were obtained with 800 nm excitation and 500–600 nm collection. The values are the mean ± s.d. for n = 3, **p < 0.01, ***p < 0.001. Scale bar = 15 μm. | ||
Then, the cell injury of another drug, tolcapone, was explored. Tolcapone was used initially for the treatment of Parkinson’s disease, but it was withdrawn from the market in the EU and labelled with a black box warning in the US because of its severe hepatotoxicity.48,49 No clear mechanism has been proposed regarding tolcapone-induced liver toxicity yet. But it has been hypothesized that it is associated with dysfunctional mitochondrial respiration due to the uncoupling of oxidative phosphorylation.50 Accordingly, using TP-KA, injury due to tolcapone in cells was mapped to explore the possible injury mechanism (Fig. 4f–j). As can be seen in the figure, the HepG2 cells that were exposed to tolcapone demonstrated brighter, dose-dependent fluorescence compared to the control group, suggesting the upregulation of the ONOO− level. This means that, as well as APAP, tolcapone could also induce HepG2 cell damage via the overproduction of ONOO− through the induction of oxidative and nitrosative stress. Meanwhile, the apparent decrease in the fluorescence intensity of cells treated with NAC before the tolcapone treatment implied the remedial role of NAC in tolcapone-induced cell damage.
Subsequently, the hepatotoxicity of APAP and tolcapone was visualized in tissues to strongly verify the toxicity mechanism. Generally, Kunming mice were divided into three groups. For the control group, the mice were administered an intraperitoneal injection of PBS buffer before being given a tail-vein injection of TP-KA. The second group was given an intraperitoneal injection of PBS buffer solution containing various concentrations of APAP or tolcapone, and then a tail-vein injection of TP-KA 30 min later. The mice in the last group were pretreated with an intraperitoneal injection of NAC 1 h before drug administration. Then all of the mice were anesthetized and dissected to isolate their livers, which were cut into slices for TPM fluorescence imaging. As shown in Fig. 5, weak fluorescence intensity was obtained in the mice liver tissue of the control group, implying a low ONOO− level under normal conditions. In contrast, after the administration of either APAP or tolcapone, the mice liver tissue of the second group emitted obvious fluorescence, indicating up-regulated ONOO− after drug treatment. Meanwhile, for the mice pretreated with NAC before drug administration, negligible fluorescence signal change was observed in both the APAP and tolcapone group, confirming the protective effect of NAC in the liver. These results verified that both APAP and tolcapone could induce hepatotoxicity via the upregulation of ONOO−.
 | ||
| Fig. 5 TPM images of the liver slices of mice. The mice were injected intraperitoneally with various substances and then with TP-KA (50 μM, 100 μL) via the tail vein. (a) and (f) PBS buffer only (the control group); (b) and (c) APAP (100 mg kg−1 and 300 mg kg−1, respectively); (d) NAC (300 mg kg−1) pretreatment and then APAP (300 mg kg−1); (g) and (h) Tolcapone (100 mg kg−1 and 300 mg kg−1, respectively); (i) NAC (300 mg kg−1) pretreatment and then tolcapone (300 mg kg−1); (e) The relative fluorescence intensity of (a)–(d); (j) The relative fluorescence intensity of (f)–(i). The images were obtained with 800 nm excitation and 500–600 nm collection. The values are the mean ± s.d. for n = 3, *p < 0.05, ***p < 0.001. Scale bar = 20 μm. | ||
Next, the histological and immunohistochemical analysis on the liver tissues were carried out to identify the histological changes during the drug administration. Nitrotyrosine was employed as the immunohistochemical biomarker to confirm the nitrosative stress of ONOO− to protein tyrosine residues.51 Briefly, Kunming mice liver sections were prepared from the three groups that were processed under various conditions, including PBS buffer only, drug administration, and NAC pretreatment. As can be seen in Fig. 6 and S7,† both the histological changes (i.e., cellular shrinkage or blebbing, the rupture of the cell membrane, and the condensation of chromatin) and nitrotyrosine formation could be obviously observed after the administration of the two drugs, implying that the liver injury happened because of the drug metabolism. However, the mice in the NAC pretreatment group displayed no distinct changes in the histological and immunohistochemical analysis, indicating that the liver injury could be effectively suppressed by NAC. Taken together, these results were in good agreement with the observation of in vitro fluorescence imaging using ONOO− as a biomarker (Fig. 4 and 5).
 | ||
| Fig. 6 Representative H&E staining images of the liver of mice treated under various conditions. (a) and (e) PBS buffer only (the control group); (b) and (c) APAP (100 mg kg−1 and 300 mg kg−1, respectively); (d) NAC (300 mg kg−1) pretreatment and then APAP (300 mg kg−1); (f) and (g) Tolcapone (100 mg kg−1 and 300 mg kg−1, respectively); and (h) NAC (300 mg kg−1) and then tolcapone (300 mg kg−1). Scale bar = 50 μM. | ||
Finally, tolcapone-induced hepatotoxicity and NAC remediation were monitored in vivo through a real-time method. As can be seen from Fig. 7, after tolcapone administration, the fluorescence intensities of the mice livers displayed gradual increments in a time-dependent manner. In particular, the observable fluorescence intensity augmentation at 15 min indicated that ONOO−-related stress began to show up after drug administration in such a short time. In addition, the clearance assay was also performed using uric acid to confirm the overproduction of ONOO− after tolcapone administration. Moreover, with the passage of time, no obvious intensity augmentation was observed in the NAC pretreatment group, indicating effective NAC remediation after the drug treatment. It should be noted that for the first time, the early warning potential of ONOO− for tolcapone-induced hepatotoxicity was revealed and demonstrated explicitly using TP-KA.
 | ||
| Fig. 7 Real-time TPM images of the livers of mice. (a) A surgical procedure was performed to expose the livers for imaging. (b) The mice were injected intraperitoneally with various substances: PBS buffer only for the control group; tolcapone (300 mg kg−1) for the drug group; uric acid (300 mg kg−1) pretreatment and then tolcapone (300 mg kg−1) for the ONOO− elimination group; and NAC (300 mg kg−1) pretreatment and then tolcapone (300 mg kg−1) for the remedial group. The data were recorded every 5 min. Excitation wavelength: 800 nm. Collection wavelength: 500–600 nm. Scale bar = 50 μM. | ||
Conclusions
In conclusion, we have constructed a new two-photon fluorescent probe, TP-KA, for ONOO− detection. Using the excellent properties of TP-KA, ONOO− as a biomarker for APAP- and tolcapone-induced hepatotoxicity was exploited. It was found that an apparent ONOO− level upregulation occurred during the drug-induced liver damage, and N-acetyl cysteine (NAC) might serve as a superior alternative antidote against the toxic metabolism of the drugs. In particular, the early warning potential of ONOO− for tolcapone-induced hepatotoxicity was revealed. Therefore, we anticipate that TP-KA may be employed as a powerful tool to pre-detect drug-induced organism injury and study the effect of antidotes.Acknowledgements
This work was supported by the 973 Program (2013CB933800) and National Natural Science Foundation of China (21390411, 21535004, 21375080, and 21505088). Male Kunming mice (20g) were purchased from the School of Medicine at Shandong University. All of the animal experiments were in agreement with the guidelines of the Institutional Animal Care and Use Committee.References
- A. Nasr, T. J. Lauterio and M. W. Davis, Adv. Ther., 2011, 28, 842–856 CrossRef PubMed.
- M. Chen, V. Vijay, Q. Shi, Z. Liu, H. Fang and W. Tong, Drug Discovery Today, 2011, 16, 697–703 CrossRef PubMed.
- N. Kaplowitz, Clin. Infect. Dis., 2004, 38, S44–S48 CrossRef PubMed.
- A. M. Larson, J. Polson, R. J. Fontana, T. J. Davern, E. Lalani, L. S. Hynan, J. S. Reisch, F. V. Schiødt, G. Ostapowicz and A. O. Shakil, Hepatology, 2005, 42, 1364–1372 CrossRef CAS PubMed.
- P. B. Watkins and L. B. Seeff, Hepatology, 2006, 43, 618–631 CrossRef PubMed.
- M. P. Holt and C. Ju, AAPS J., 2006, 8, E48–E54 CrossRef CAS PubMed.
- D. M. Bissell, G. J. Gores, D. L. Laskin and J. H. Hoofnagle, Hepatology, 2001, 33, 1009–1013 CrossRef CAS PubMed.
- A. J. Shuhendler, K. Pu, L. Cui, J. P. Uetrecht and J. Rao, Nat. Biotechnol., 2014, 32, 373–380 CrossRef CAS PubMed.
- D. J. Antoine, D. P. Williams and B. K. Park, Expert Opin. Drug Metab. Toxicol., 2008, 4, 1415–1427 CrossRef CAS PubMed.
- J. L. Walgren, M. D. Mitchell and D. C. Thompson, Crit. Rev. Toxicol., 2005, 35, 325–361 CrossRef CAS PubMed.
- B. K. Park, N. R. Kitteringham, J. L. Maggs, M. Pirmohamed and D. P. Williams, Annu. Rev. Pharmacol., 2005, 45, 177–202 CrossRef CAS PubMed.
- S. Russmann, G. A. Kullak-Ublick and I. Grattagliano, Curr. Med. Chem., 2009, 16, 3041–3053 CrossRef CAS PubMed.
- D. Pessayre, A. Mansouri, D. Haouzi and B. Fromenty, Cell Biol. Toxicol., 1999, 15, 367–373 CrossRef CAS PubMed.
- H. Jaeschke, G. J. Gores, A. I. Cederbaum, J. A. Hinson, D. Pessayre and J. J. Lemasters, Toxicol. Sci., 2002, 65, 166–176 CrossRef CAS PubMed.
- P. Pacher, J. S. Beckman and L. Liaudet, Physiol. Rev., 2007, 87, 315–424 CrossRef CAS PubMed.
- C. Szabó, H. Ischiropoulos and R. Radi, Nat. Rev. Drug Discovery, 2007, 6, 662–680 CrossRef PubMed.
- G. Ferrer-Sueta and R. Radi, ACS Chem. Biol., 2009, 4, 161–177 CrossRef CAS PubMed.
- J. Zheng, R. Yang, M. Shi, C. Wu, X. Fang, Y. Li, J. Li and W. Tan, Chem. Soc. Rev., 2015, 44, 3036–3055 RSC.
- A. T. Aron, M. O. Loehr, J. Bogena and C. J. Chang, J. Am. Chem. Soc., 2016, 138, 14338–14346 CrossRef CAS PubMed.
- Y. Li, X. Wang, J. Yang, X. Xie, M. Li, J. Niu, L. Tong and B. Tang, Anal. Chem., 2016, 88, 11154–11159 CrossRef CAS PubMed.
- W. Shi, X. Li and H. Ma, Angew. Chem., Int. Ed., 2012, 124, 6538–6541 CrossRef.
- X. Wang, J. Sun, W. Zhang, X. Ma, J. Lv and B. Tang, Chem. Sci., 2013, 4, 2551–2556 RSC.
- K. Xu, D. Luan, X. Wang, B. Hu, X. Liu, F. Kong and B. Tang, Angew. Chem., Int. Ed., 2016, 128, 12943–12946 CrossRef.
- M. H. Lee, N. Park, C. Yi, J. H. Han, J. H. Hong, K. P. Kim, D. H. Kang, J. L. Sessler, C. Kang and J. S. Kim, J. Am. Chem. Soc., 2014, 136, 14136–14142 CrossRef CAS PubMed.
- X. Wang, J. Lv, X. Yao, Y. Li, F. Huang, M. Li, J. Yang, X. Ruan and B. Tang, Chem. Commun., 2014, 50, 15439–15442 RSC.
- J. Miao, Y. Huo, Q. Liu, Z. Li, H. Shi, Y. Shi and W. Guo, Biomaterials, 2016, 107, 33–43 CrossRef CAS PubMed.
- K. Xu, H. Chen, J. Tian, B. Ding, Y. Xie, M. Qiang and B. Tang, Chem. Commun., 2011, 47, 9468–9470 RSC.
- X. Li, R. R. Tao, L. J. Hong, J. Cheng, Q. Jiang, Y. M. Lu, M. H. Liao, W. F. Ye, N. N. Lu and F. Han, J. Am. Chem. Soc., 2015, 137, 12296–12303 CrossRef CAS PubMed.
- X. Zhou, Y. Kwon, G. Kim, J.-H. Ryu and J. Yoon, Biosens. Bioelectron., 2015, 64, 285–291 CrossRef CAS PubMed.
- T. Peng, N. K. Wong, X. Chen, Y. K. Chan, D. H. H. Ho, Z. Sun, J. J. Hu, J. Shen, H. El-Nezami and D. Yang, J. Am. Chem. Soc., 2014, 136, 11728–11734 CrossRef CAS PubMed.
- T. Ueno, Y. Urano, H. Kojima and T. Nagano, J. Am. Chem. Soc., 2006, 128, 10640–10641 CrossRef CAS PubMed.
- F. Yu, P. Li, G. Li, G. Zhao, T. Chu and K. Han, J. Am. Chem. Soc., 2011, 133, 11030–11033 CrossRef CAS PubMed.
- X. Jia, Q. Chen, Y. Yang, Y. Tang, R. Wang, Y. Xu, W. Zhu and X. Qian, J. Am. Chem. Soc., 2016, 138, 10778–10781 CrossRef CAS PubMed.
- D. Cheng, Y. Pan, L. Wang, Z. B. Zeng, L. Yuan, X. B. Zhang and Y. T. Chang, J. Am. Chem. Soc., 2017, 285–292 CrossRef CAS PubMed.
- Z. Song, D. Mao, S. H. Sung, R. T. Kwok, J. W. Lam, D. Kong, D. Ding and B. Z. Tang, Adv. Mater., 2016, 28, 7249–7256 CrossRef CAS PubMed.
- W. Denk, J. H. Strickler and W. W. Webb, Science, 1990, 248, 73–76 CAS.
- K. H. Wang, A. Majewska, J. Schummers, B. Farley, C. Hu, M. Sur and S. Tonegawa, Cell, 2006, 126, 389–402 CrossRef CAS PubMed.
- W. Zhang, P. Li, F. Yang, X. Hu, C. Sun, W. Zhang, D. Chen and B. Tang, J. Am. Chem. Soc., 2013, 135, 14956–14959 CrossRef CAS PubMed.
- Y. Tang, X. Kong, A. Xu, B. Dong and W. Lin, Angew. Chem., Int. Ed., 2016, 55, 3356–3359 CrossRef CAS PubMed.
- X. Xie, X. Yang, T. Wu, Y. Li, M. Li, Q. Tan, X. Wang and B. Tang, Anal. Chem., 2016, 88, 8019–8025 CrossRef CAS PubMed.
- A. Sikora, J. Zielonka, M. Lopez, J. Joseph and B. Kalyanaraman, Free Radical Biol. Med., 2009, 47, 1401–1407 CrossRef CAS PubMed.
- P. Jin, C. Jiao, Z. Guo, Y. He, S. Zhu, H. Tian and W. Zhu, Chem. Sci., 2014, 5, 4012–4016 RSC.
- S. Wei, Y. Sun, C. Tan, S. Yan, P. Guo, X. Hu and J. Fan, Luminescence, 2013, 28, 318–326 CrossRef CAS PubMed.
- W. M. Lee, N. Engl. J. Med., 2003, 349, 474–485 CrossRef CAS PubMed.
- K. Du, A. Ramachandran and H. Jaeschke, Redox Biol., 2016, 10, 148–156 CrossRef CAS PubMed.
- C. L. Tsai, W. T. Chang, T. I. Weng, C. C. Fang and P. D. Walson, Clin. Ther., 2005, 27, 336–341 CrossRef PubMed.
- K. R. Atkuri, J. J. Mantovani, L. A. Herzenberg and L. A. Herzenberg, Curr. Opin. Pharmacol., 2007, 7, 355–359 CrossRef CAS PubMed.
- N. Borges, Drug Saf., 2003, 26, 743–747 CrossRef CAS PubMed.
- C. W. Olanow, Arch. Neurol., 2000, 57, 263–267 CrossRef CAS PubMed.
- D. D. Truong, Clin. Interventions Aging, 2009, 4, 109–113 CrossRef CAS.
- A. H. Cross, P. T. Manning, M. K. Stern and T. P. Misko, J. Neuroimmunol., 1997, 80, 121–130 CrossRef CAS PubMed.
Footnotes |
| † Electronic supplementary information (ESI) available: Detailed experimental procedures, mass spectra, figures, tables and NMR spectra. See DOI: 10.1039/c7sc00303j |
| ‡ These authors contributed equally to this work. |
| This journal is © The Royal Society of Chemistry 2017 |