
 Open Access Article
 This Open Access Article is licensed under a
 Creative Commons Attribution 3.0 Unported Licence
Formation of graphene-encapsulated CoS2 hybrid composites with hierarchical structures for high-performance lithium-ion batteries†
Shi Tao *a,
Weifeng Huangc,
Hui Xieb,
Jing Zhanga,
Zhicheng Wanga,
Wangsheng Chub,
Bin Qian*a and
Li Songb
*a,
Weifeng Huangc,
Hui Xieb,
Jing Zhanga,
Zhicheng Wanga,
Wangsheng Chub,
Bin Qian*a and
Li Songb
aDepartment of Physics and Electronic Engineering, Jiangsu Laboratory of Advanced Functional Materials, Changshu Institute of Technology, Changshu 215500, People's Republic of China. E-mail: njqb@cslg.edu.cn
bNational Synchrotron Radiation Laboratory, University of Science and Technology of China, Hefei, Anhui 230026, People's Republic of China
cCollege of Engineering, Peking University, Beijing 100871, People's Republic of China
First published on 11th August 2017
Abstract
Transition metal sulfides (TMSs) are considered as the most promising alternative anode materials for advanced lithium-ion batteries (LIBs). Here, we report a hierarchically structured CoS2 nanosphere/graphene (CoS2/G) composite, fabricated by a simple hydrothermal method. This composite, assembled with CoS2 nanoparticles uniformly distributed on the graphene, exhibits excellent electrochemical performance. In particular, the CoS2/G electrode material delivers a high rate capability of around 398 mA h g−1 at a current density of 3500 mA g−1. Moreover, a discharge capacity of about 400 mA h g−1 can be obtained after 1000 cycles at a current density of 500 mA g−1. X-ray absorption spectroscopy is used to characterize the sample for the first time, and the results demonstrate that CoS2/G is reduced to metallic Co and Li2S when discharged to 0.01 V. In subsequent charge–discharge processes, the metallic Co cannot be fully oxidized to CoS2, which is the main cause of capacity loss for the CoS2 electrode.
1. Introduction
Rechargeable lithium-ion batteries (LIBs) are considered as one of the most promising power sources for portable electronics and electronic vehicles, owning to their high energy density, long cycle life and environmental benignity.1,2 However, LIBs are not sufficient to meet the increasing demands for next-generation energy storage systems (ESSs), due to the theoretical limit of the conventional graphite anode material. Transition metal sulfides, MS2 (M = Ni, Co, Fe and Mo), have much higher theoretical energy capacities and energy densities than graphite, and have been studied as possible alternative anode materials for advanced LIBs.3–15 Among them, CoS2 has attracted considerable attention because of its remarkable specific capacity and thermal stability.16–24 Unfortunately, its low conductivity, large volume expansion and polysulfide dissolution in electrolytes hamper its commercialization for the development of LIBs.Due to the above problems, many efforts have been devoted to improving the capability and cyclability of anode materials. Combination with carbon materials might be regarded as a fundamental strategy for enhancing the electrochemical performance of CoS2.25–29 Graphene has been widely applied in catalysis and energy storage owing to its high thermal stability, large surface area, and superior electrical conductivity.30–32 Therefore, tight coupling between CoS2 and graphene is expected to enable fast charge transfer kinetics and good structural stability of the electrode. He et al. prepared a graphene-wrapped CoS2 nanoparticle hybrid composite as an anode material for LIBs, which exhibited improved electrochemical performance.33 Guo et al. synthesized CoS2 nanocages coated with graphene nanosheets via a solvothermal method and demonstrated the excellent anode performance of the resulting material for LIBs.34 However, the synthetic methods are complicated and the composites are obtained using organic reagents, which are not suitable for commercial production. Therefore, it is desirable to develop a simple method to synthesize CoS2@graphene hybrid composites with pure phases for high rate capability and long cycle life. To the best of our knowledge, although there have been many studies focusing on how to improve the electrochemical performance of CoS2 materials, the mechanism behind the Li+ storage behavior of CoS2 is not well understood. X-ray absorption fine structure (XAFS) analysis is an ideal technique to investigate the electronic and local geometrical structure changes of electrode materials during charge/discharge processes.35–38
Herein, we present a simple method to prepare thin-layer graphene-encapsulated CoS2 nanoparticles in a hierarchically structured hybrid composite (CoS2/G). The composite exhibits a high capacity of about 398 mA h g−1 at a high current density of 3500 mA g−1, and delivers a reversible capacity of around 400 mA h g−1 at 500 mA g−1 after 1000 cycles. This excellent electrochemical performance can be attributed to the synergistic effect of the hierarchical architecture and thin graphene layer modulation, which enhance electron and ion transport and buffer the volume change of CoS2 during repeated cycling. Moreover, the XAFS technique is employed for the first time to reveal the conversion reaction mechanism and the origin of capacity fading.
2. Experimental
2.1 Preparation of graphene oxide (GO)
Graphene oxide (GO) was prepared by a modified Hummers' method.39 In a typical procedure, 2 g of graphite powder was placed in 500 mL of concentrated H2SO4/H3PO4 (360![[thin space (1/6-em)]](https://www.rsc.org/images/entities/char_2009.gif) :40 mL), and then 18 g of KMnO4 was gradually added, stirring the solution and keeping it at 35 °C. After stirring for 2 h, we maintained the solution at 50 °C for 12 h. The reaction was cooled to room temperature and poured onto ice (400 mL) with 30% H2O2 (3 mL). The resulting suspension was centrifuged, and washed with HCl (10%) followed by distilled water until the pH value was close to 7. Finally, the GO was freeze-dried for later use.
:40 mL), and then 18 g of KMnO4 was gradually added, stirring the solution and keeping it at 35 °C. After stirring for 2 h, we maintained the solution at 50 °C for 12 h. The reaction was cooled to room temperature and poured onto ice (400 mL) with 30% H2O2 (3 mL). The resulting suspension was centrifuged, and washed with HCl (10%) followed by distilled water until the pH value was close to 7. Finally, the GO was freeze-dried for later use.
2.2 Preparation of the CoS2/G composite
For the synthesis of CoS2/G, 30 mg of GO was dissolved in 40 mL of distilled water and ultrasonicated for 30 min to form a pale yellow solution. After that, 2 mmol of cobaltous acetate and 2 mmol of sodium thiosulfate were added into the above solution, and the mixture was continuously stirred for another 1 h. The solution was then transferred to a Teflon-lined autoclave and heated at 200 °C for 12 h. After being cooled to room temperature, the resulting black powder was washed with ethanol and water several times. The final product was obtained by vacuum drying at 80 °C for 24 h. Bare CoS2 was prepared by following the same steps without using GO.2.3 Material characterization
X-ray diffraction (XRD) patterns were acquired on a Bruker D8-Advance powder diffractometer with Cu-Kα radiation (λ = 1.5406 Å) with a scan rate of 4° min−1. The morphology of the samples was characterized by a field emission scanning electron microscope (FE-SEM, SIGMA, ZEISS) and a transmission electron microscope (TEM, JEOL-2000CX, 200 kV and HRTEM, JEOL-2010F, 200 kV). Raman spectra were recorded on a Horiba Xplora Raman micro-spectroscope using 532 nm laser radiation between 300–1800 cm−1. The carbon content of the samples was estimated using a TGA/SDTA851 instrument in an O2 atmosphere. The Co K edge XAFS spectra of the samples were recorded at the 1W2B beamline of the Beijing Synchrotron Radiation Facility (BSRF). To get the desired electrodes, coin cells were charged/discharged to the desired cutoff voltages and disassembled. The disassembled electrodes were washed with dimethyl carbonate (DMC) in an Ar-filled glove box, and after drying, the electrodes were sealed with 3 M sellotape.2.4 Electrochemical measurements
The electrochemical tests of the samples were performed using CR2016-type coin cells. The electrodes were fabricated by pasting a mixture of CoS2/G, acetylene black and poly(vinyl difluoride) (PVDF) at a weight ratio of 70:20:10 in N-methyl-2-pyrrolidone (NMP) solvent on copper (Cu) foil and drying at 120 °C for 12 h. The loading density of the electrodes is about 1.8 mg cm−2. Metallic lithium was used as the anode and Celgard 2500 was used as the separator. 1 M LiPF6 (ethylene carbonate, dimethyl carbonate and ethyl-methyl carbonate with a 1:1:1 volume ratio) was used as the electrolyte. Galvanostatic charge/discharge tests were performed on a Land CT 2001A system between 0.01 and 3.0 V vs. Li+/Li. Cyclic voltammetry (CV) curves were acquired on a VSP electrochemical workstation (Bio-logic, France) with a scan rate of 0.2 mV s−1 in the range of 0.01–3.0 V.
3. Results and discussion
The CoS2/G hybrid composite was synthesized by a one-step hydrothermal method. Scheme 1 illustrates the synthetic process for the direct formation of the CoS2/G nanocomposite. The detailed procedure is described in the Experimental section.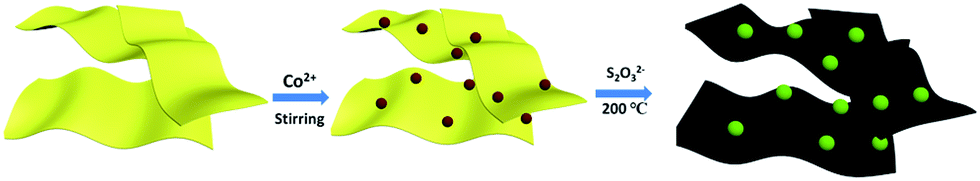 | ||
| Scheme 1 Schematic illustration of the CoS2/G composite produced by hydrothermal synthesis. | ||
The crystalline phase of the samples was confirmed by the XRD patterns; as shown in Fig. 1a, all of the diffraction peaks were well indexed with the standard cubic structure of CoS2 (JCPDS no. 41-1471) and no other phase characteristic diffraction peaks are detected, suggesting the high purity of the synthesized samples. The Raman spectra of CoS2/G and GO are presented in Fig. S1.† Two characteristic peaks at 1353 and 1584 cm−1 were assigned to the D band and G band, respectively. The intensity ratio of CoS2/G (ID/IG = 1.05) is higher than that of GO (ID/IG = 0.89), which suggests that it has a more disordered carbon structure. This is attributed to the CoS2 nanoparticles embedded in the graphene layers.40,41 Thermo-gravimetric analysis (TGA) was used to determine the carbon content of the hybrid composite; as shown in Fig. S2,† the slight weight loss before 350 °C can mainly be attributed to the removal of absorbed water. The result suggests that the content of graphene in the composite is about 6.70%. Furthermore, the C K-edge XANES spectra of the GO and CoS2/G samples (see Fig. 1b) are characterized by three main features: A, B and C at about 285.0, 289.0 and 292.5 eV, respectively. According to a previous report, features A and C are attributed to the C 1s and graphitic states of the π* and σ* transitions, respectively, while feature B is attributed to sp3 hybridized states due to oxygenated groups such as C–O or C![[double bond, length as m-dash]](https://www.rsc.org/images/entities/char_e001.gif) O.42 The π* transition intensity for CoS2/G is reduced compared to that of GO, which indicates more charge transfer from CoS2 to C 2p-derived π* states in graphene, suggesting stronger chemical bonding between CoS2 and the interface of graphene. The lower intensity of feature B demonstrates that GO is almost reduced under hydrothermal conditions. In addition, the most intense feature, C, appears as a resolved double-peak for the CoS2/G sample due to
O.42 The π* transition intensity for CoS2/G is reduced compared to that of GO, which indicates more charge transfer from CoS2 to C 2p-derived π* states in graphene, suggesting stronger chemical bonding between CoS2 and the interface of graphene. The lower intensity of feature B demonstrates that GO is almost reduced under hydrothermal conditions. In addition, the most intense feature, C, appears as a resolved double-peak for the CoS2/G sample due to  resonance, confirming that the composite is highly graphitized, which suggests that it can provide an increased number of electrochemical active sites for electron and Li+ transport.43,44
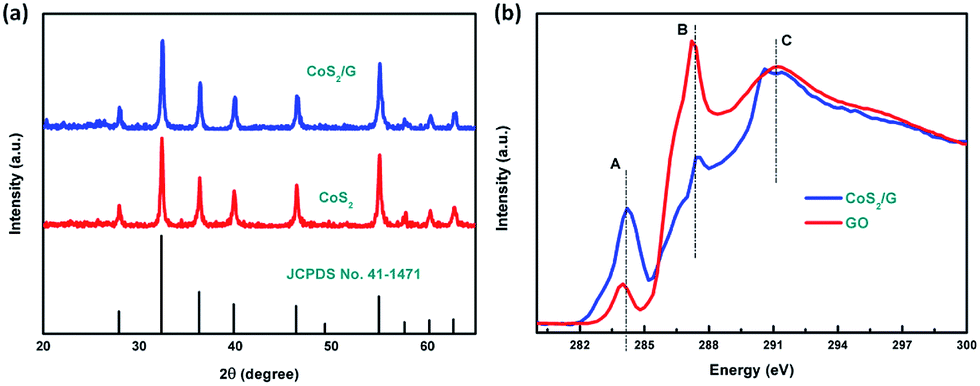 | ||
| Fig. 1 (a) XRD patterns for the CoS2 and CoS2/G electrodes, and (b) NEXAFS spectra of CoS2/G and GO. | ||
The morphology of CoS2/G was characterized, as shown in Fig. 2, and it was observed that CoS2 nanoparticles with a size of about 100 nm are tightly encapsulated by a thin graphene layer. The TEM image in Fig. 2c further revealed that the CoS2 electrode material was assembled with the nanoparticles uniformly distributed on the graphene. This hierarchical structure is expected to exhibit excellent electrochemical performance. The bare CoS2 nanoparticles without graphene have a similar morphology (Fig. S3†). The HRTEM image shows that the surface of the CoS2 nanoparticles is tightly coated by a thin graphene layer (Fig. 2d). In addition, the particles are well crystallized with a lattice spacing of 0.28 nm, corresponding to the (200) plane. EDS mapping of CoS2/G reveals that Co, S, and C elements are homogeneously distributed over the hybrid composites (Fig. 2e). The above results confirm that the as-prepared sample, which was fabricated through a facile in situ hydrothermal method, consists of graphene tightly wrapped on the CoS2 nanoparticles.
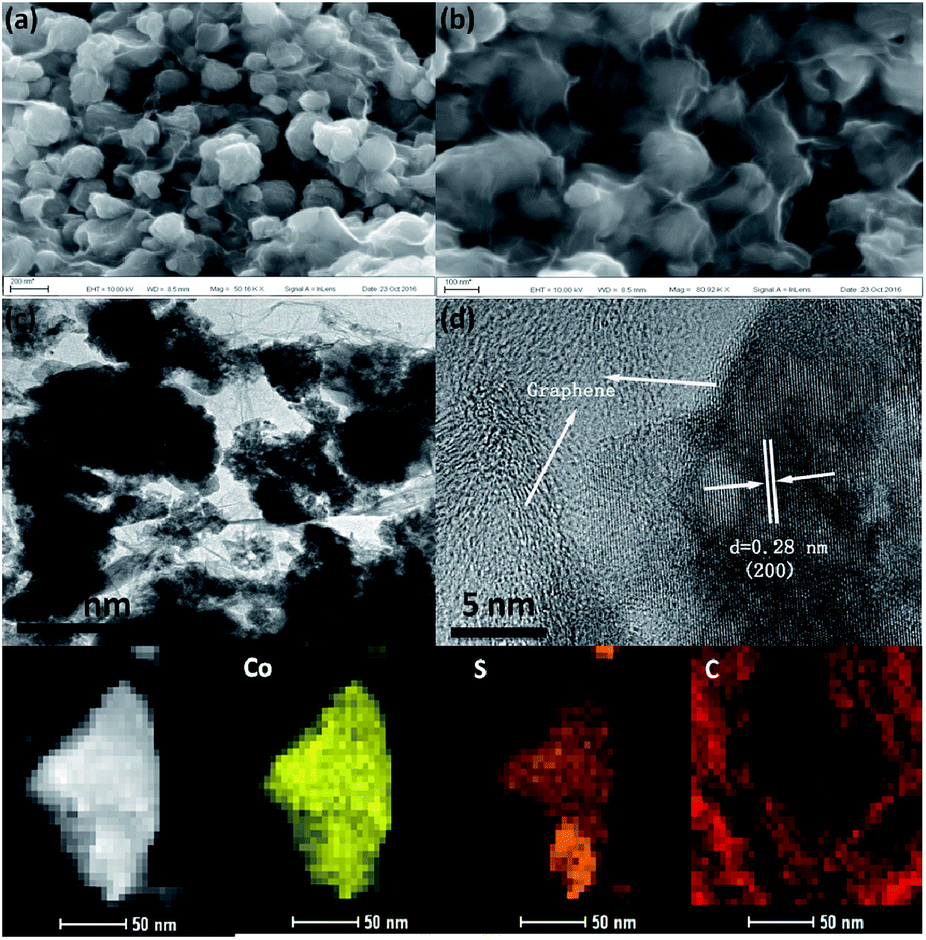 | ||
| Fig. 2 (a) and (b) SEM images of CoS2/G, (c) TEM image, (d) HRTEM image, and (e) EDS maps of CoS2/G. | ||
The electrochemical properties of the CoS2/G composite were investigated by cyclic voltammetry (CV) and galvanostatic charge/discharge tests. The CV curves of the initial five cycles of the CoS2/G electrode are shown in Fig. 3a. Two obvious reduction peaks are observed at around 1.50 and 0.90 V in the first cycle, which is in accordance with the insertion of Li+ to form LixCoS2 or metallic Co and Li2S.25,45 The two corresponding oxidation peaks centered at 2.16 and 2.49 V could be attributed to the delithiation process. After the second cycle, the CV curves are well over-lapped, indicating the good cycle stability. On the other hand, the bulk CoS2 exhibits a similar CV curve to the CoS2/G in the first cycle (Fig. S4a†). However, the peak intensity of the reduction and oxidation peaks decreased largely in subsequent cycles, suggesting poor cyclability. Fig. 3b shows the typical charge/discharge curves for the CoS2/G composite at a current density of 300 mA g−1 between 0.01 and 3.0 V. The observed voltage plateaus are consistent with the above CV results. In particular, the initial discharge and charge capacities are 1110 and 810 mA h g−1, respectively. The irreversible capacity loss of 300 mA h g−1 in the first cycle could be attributed to SEI formation.46 After the first cycle, the well overlapping voltage profiles demonstrate the superior electrochemical reversibility. For the bulk CoS2 electrode, the specific capacities are significantly lower than those of the CoS2/G composite and also exhibit serious capacity fading (Fig. S4b†). Fig. 3c shows the rate capability of bulk CoS2 and CoS2/G at various current densities. In particular, the CoS2/G electrode delivers a much higher reversible capacity than bulk CoS2. Even at a current density of 3500 mA g−1, the CoS2/G electrode can still exhibit a discharge capacity of around 400 mA h g−1.
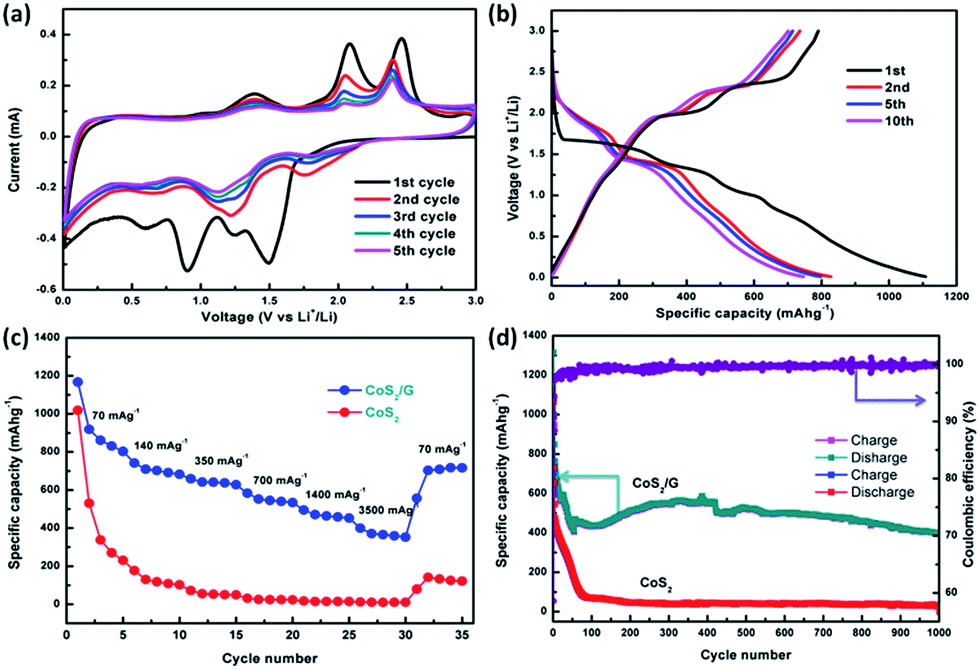 | ||
| Fig. 3 (a) CV curves of CoS2/G, (b) charge–discharge curves of CoS2/G at a current density of 70 mA g−1, (c) rate performance of CoS2/G and CoS2, and (d) cycle performance with the corresponding coulombic efficiency. | ||
Fig. 3d presents a comparison of the cyclability of bulk CoS2 and CoS2/G at a current density of 500 mA g−1. Obviously, the CoS2/G hybrid composite exhibits an impressive capacity stability; a reversible capacity of about 400 mA h g−1 can be obtained even after 1000 cycles, which is much higher than that of commercialized graphite. To the best of our knowledge, the CoS2/G in this work demonstrates an optimum cycling performance. Moreover, a high coulombic efficiency of about 99.7% was obtained. However, the capacity of bulk CoS2 drops rapidly to only 32 mA h g−1 after 1000 cycles. We also compared the electrochemical performance of our sample with that of CoS2 materials reported in the previous literature (Table S1†). To the best of our knowledge, the CoS2/G in this work demonstrates an optimum cyclability. The excellent cycle stability of CoS2/G can be ascribed to both the hierarchical structure morphology and the thin graphene layer, which are not only in favor of Li+-ion transport and rapid electron transfer, but also suppress the volume expansion and aggregation of CoS2 nanoparticles.26,34
In order to explore the root of the excellent cycling stability of the present CoS2/G composite, ex situ SEM images were recorded from the cells after 100 cycles at a current density of 500 mA g−1. As shown in Fig. 4, the SEM images show that the morphology and structure of the electrode materials were well maintained, except for some agglomeration caused by the redox reactions during the charge–discharge processes.
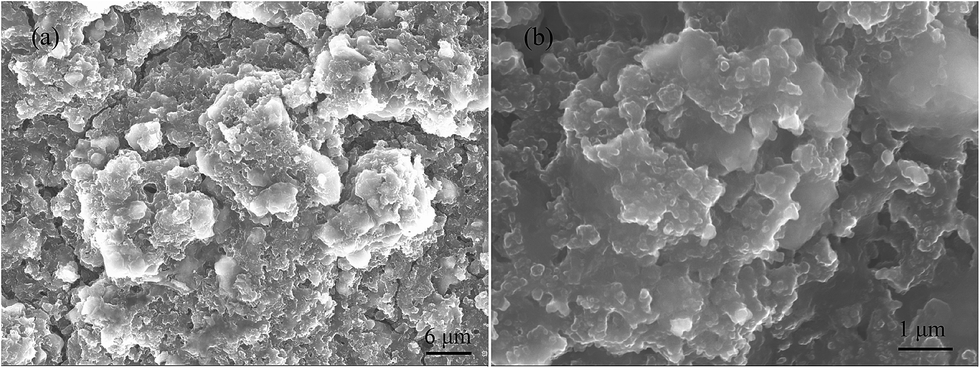 | ||
| Fig. 4 Ex situ SEM images of the CoS2/G electrode after 100 cycles at a current density of 500 mA g−1: (a) low magnification, and (b) high magnification. | ||
Electrochemical impedance measurements (EIS) are used to investigate the effect of graphene modulation. As shown in Fig. 5, all the Nyquist plots contain a semicircle in the high frequency region and a straight line in the low frequency region. The straight line and the semi-circle represent the process of diffusion of lithium ions in the electrode (Warburg impedance) and charge transfer resistance (Rct) on the electrode surface, respectively.25,47,48 The EIS data were analyzed using the equivalent circuit given in the inset of Fig. 4. The CoS2/G composite exhibits an Rct of 90.1 Ω, which is lower than that of bulk CoS2 (111.8 Ω). These results indicate that the CoS2/G composite has the lowest charge transfer resistance, and consequently exhibits the highest electrochemical activity. Moreover, we can see that CoS2/G possesses a higher slope, suggesting faster Li+ ion diffusion. This observation indicates that a thin graphene layer effectively decreases the Li+ ion transfer resistance at the electrode–electrolyte interface and significantly enhances rapid electron transfer.
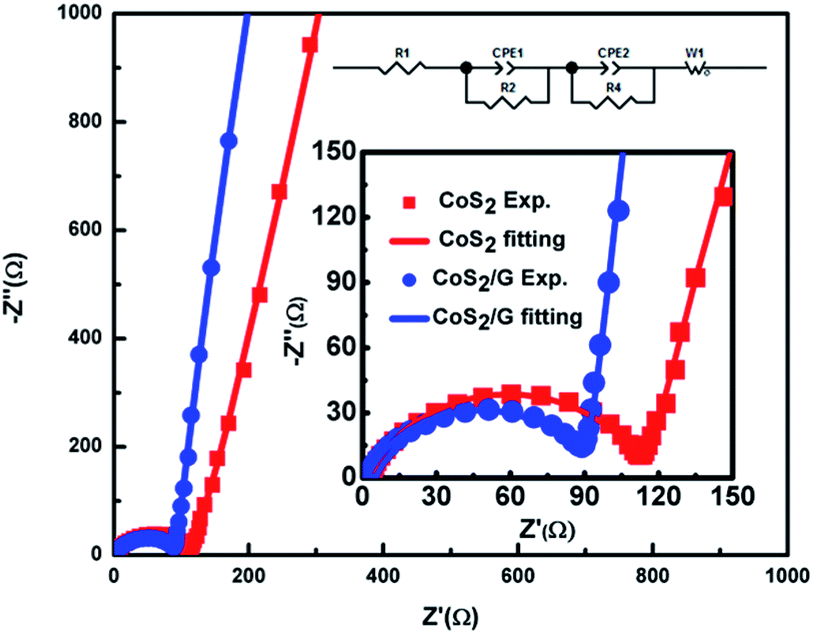 | ||
| Fig. 5 EIS data of bulk CoS2 and the CoS2/G hybrid composite. | ||
X-ray absorption fine structure (XAFS) analysis was also employed to further investigate the conversion reaction mechanism of CoS2/G. In Fig. 6, the different cut-off voltages of the XAFS spectra at the Co K-edge are compared. As can be seen, the XANES spectra of the pristine CoS2/G display a small pre-edge peak at around 7110 eV, which suggests octahedral coordination of Co by S. Fig. 6a shows that the Co K-edge of the white line is shifted to a lower energy during the discharge process, indicating the reduction of Co, but the spectrum after discharging is still different from that of Co metal. This may be due to the incomplete reduction of Co2+ and the likely small domain sizes of Co. When the voltage decreases to 0.6 V, the intensity of the pre-edge increases in the XANES spectra and the intensity of the white line is decreased, demonstrating that the local structure has changed at the end of the discharge process.49 During the charge process, the Co K-edge shift exhibits the inverse trend, but it is not fully recovered to the original state in the pristine sample. In addition, an increase in voltage up to 3.0 V led to a rise in the white line peak at 7724 eV, with a decrease in the shoulder at 7710 eV, suggesting that the local structure and coordination of Co in the charged products are quite different from those in pristine CoS2 (Fig. 6b). The EXAFS spectra are shown in Fig. 6c. The peak appearing at around 1.8 Å is attributed to the Co–S interaction in the CoS2/G composite. The intensity of the Co–S bond decreases and the length increases with the discharging depth, which may be because Li+ ions are gradually inserted into the CoS2 forming small domain sizes of Co metal and causing the local structure to become disordered. In contrast, the intensity and length of the Co–S bond decrease with the charging depth, indicating that the reaction is reversible, but not fully (Fig. 6d).
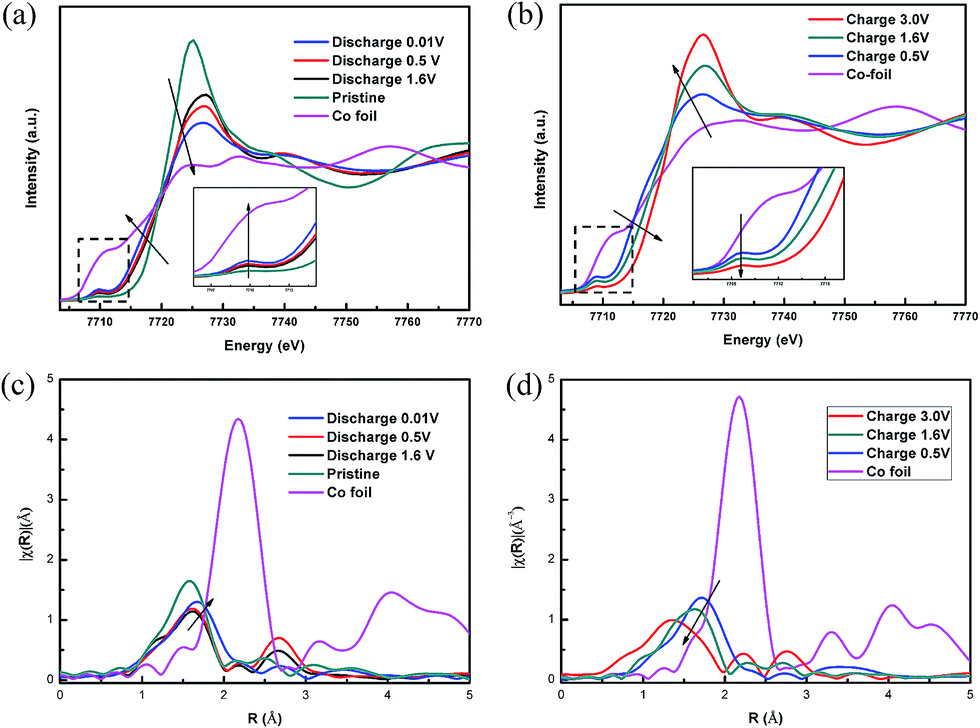 | ||
| Fig. 6 Ex situ XANES spectra for the Co K-edge of CoS2/G at different states: (a) discharge state, and (b) charge state. Corresponding ex situ EXAFS spectra: (c) discharge state, and (d) charge state. | ||
For the CoS2/G sample subjected to 1, 10 and 20 cycles, as shown in Fig. 7a, the Co K-edge shifts to a low energy, which indicates that the average chemical valence of Co decreases, due to partial CoS2 transfer to Co metal after cycling. In addition, the slight increase in the pre-edge at 7710 eV and the broad band at the white line peak demonstrate that the conversion reaction of the metallic Co and Li2S phase is not a fully reversible reaction for CoS2. This results can also be confirmed by the EXAFS spectra (Fig. 7b), where it can be observed that the intensity of the Co–S bond length increases after repeated charge–discharge processes. This can be ascribed to the content of metallic Co increasing with the cycling process.50 The results further confirm that the metallic Co cannot be fully converted to CoS2, which is the origin of the irreversible capacity loss of the CoS2 electrode material.
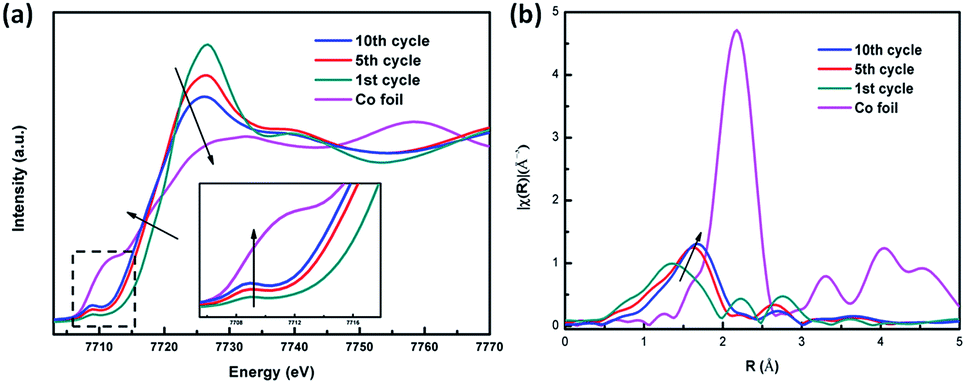 | ||
| Fig. 7 (a) Ex situ XANES spectra at the Co K-edge of CoS2/G at different cycling states. (b) Corresponding ex situ EXAFS spectra. | ||
4. Conclusions
In conclusion, we present a facile approach to prepare a hybrid composite consisting of well-defined graphene-encapsulated CoS2 nanoparticles with a hierarchical structure. The CoS2/G electrode material delivers a high rate capability of about 398 mA h g−1 at a current density of 3500 mA g−1. Moreover, a discharge capacity of about 400 mA h g−1 can be obtained after 1000 cycles at a current density of 500 mA g−1. The XAFS spectra were used to characterize the conversion mechanism for the first time, and the results demonstrate that the CoS2 is reduced to metallic Co when discharged to 0.01 V, which could not be fully oxidized back to CoS2 in the subsequent charge–discharge cycles. This is the main reason for the capacity loss of the CoS2 electrode.Conflicts of interest
There are no conflicts to declare.Acknowledgements
This work was partly supported by the National Natural Science Foundation of China (No. 11275227, 11605002, 11605201, 616040215), along with support from the China Postdoctoral Science Foundation (2015M580925), the Youth Innovation Promotion Association, CAS, the Natural Science Foundation of Jiangsu Educational Department (No. 15KJA430001), and the Six-talent Peak of Jiangsu Province (No. 2012-XCL-036). We sincerely acknowledge the staff of the XAS beamlines of the Beijing Synchrotron Radiation Facility.References
- M. Armand and J. M. Tarascon, Building Better Batteries, Nature, 2008, 451, 652–657 CrossRef CAS PubMed
.
- B. Dunn, H. Kamath and J. M. Tarascon, Science, 2011, 334, 928 CrossRef CAS PubMed
- L. W. Ji, Z. Lin, M. Alcoutlabi and X. W. Zhang, Recent developments in nanostructured anode materials for rechargeable lithium-ion batteries, Energy Environ. Sci., 2011, 4, 2682–2699 CAS
- M. R. Gao, Y. F. Xu, J. Jiang and S. H. Yu, Nanostructured metal chalcogenides: synthesis, modification, and applications in energy conversion and storage devices, Chem. Soc. Rev., 2013, 42, 2986–3017 RSC
- X. Liu, K. Zhang, K. X. Lei, F. J. Li, Z. L. Tao and J. Chen, Facile synthesis and electrochemical sodium storage of CoS2 micro/nano-structures, Nano Res., 2016, 9, 198–206 CrossRef CAS
- W. W. Chen, T. T. Li, Q. Hu, C. P. Li and H. Guo, Hierarchical CoS2@C hollow microspheres constructed by nanosheets with superior lithium storage, J. Power Sources, 2015, 286, 159–165 CrossRef CAS
- T. S. Wang, P. Hu, C. J. Zhang, H. P. Du, Z. H. Zhang, X. G. Wang, S. G. Chen, J. W. Xiong and G. L. Cui, Nickel disulfide-graphene nanosheets composites with improved electrochemical performance for sodium ion battery, ACS Appl. Mater. Interfaces, 2016, 8, 7811–7817 CAS
- H. Xue, D. Yu, J. Qing, X. Yang, J. Xu, Z. P. Li, M. L. Sun, W. P. Kang, Y. B. Tang and C. S. Lee, Pyrite FeS2 Microspheres Wrapped by Reduced Graphene Oxide as High-Performance Lithium-Ion Battery Anodes, J. Mater. Chem. A, 2015, 15, 7945–7949 Search PubMed
- Z. Hu, Z. Q. Zhu, F. Y. Cheng, K. Zhang, J. B. Wang, C. C. Chen and J. Chen, Pyrite FeS2 for high-rate and long-life rechargeable sodium batteries, Energy Environ. Sci., 2015, 8, 1309–1316 CAS
- Y. J. Zhu, X. L. Fan, L. M. Suo, C. Luo, T. Gao and C. S. Wang, Electrospun FeS2@Carbon fiber electrode as a high energy density cathode for rechargeable lithium batteries, ACS Nano, 2016, 10, 1529–1538 CrossRef CAS PubMed
- W. J. Yu, C. Liu, L. L. Zhang, P. X. Hou, F. Li, B. Zhang and H. M. Cheng, Synthesis and electrochemical lithium storage behavior of carbon nanotubes filled with iron sulfide nanoparticles, Adv. Sci., 2016, 1600113 CrossRef PubMed
- R. Tan, J. L. Yang, J. T. Hu, K. Wang, Y. Zhao and F. Pan, Core-shell nano-FeS2@N-doped graphene as an advanced cathode material for rechargeable Li-ion batteries, Chem. Commun., 2016, 52, 986–989 RSC
- W. S. V. Lee, E. Peng, T. A. J. Loh, X. L. Huang and J. M. Xue, Few-layer MoS2-anchored graphene aerogel paper for free-standing electrode materials, Nanoscale, 2016, 8, 8042–8047 RSC
- S. H. Choi, Y. N. Ko, J. K. Lee and Y. C. Kang, 3D MoS2-graphene microsphere consisting of multiple nanospheres with superior sodium ion storage properties, Adv. Funct. Mater., 2015, 25, 1780–1788 CrossRef CAS
- X. Q. Xie, T. Makaryan, M. Q. Zhao, K. L. V. Aken, Y. Gogotsi and G. X. Wang, MoS2 nanosheets vertically aligned on carbon paper: a freestanding electrode for highly reversible sodium-ion batteries, Adv. Energy Mater., 2016, 6, 1502161 CrossRef
- J. M. Yan, H. Z. Huang, J. Zhang, Z. J. Liu and Y. Yang, A study of novel anode material CoS2 for lithium ion battery, J. Power Sources, 2005, 146, 264–269 CrossRef CAS
- G. H. Huang, T. Chen, Z. Wang, K. Chang and W. X. Chen, Synthesis and electrochemical performances of cobalt sulfides/graphene nanocomposite as anode material of Li-ion battery, J. Power Sources, 2013, 235, 122–128 CrossRef CAS
- J. Xie, S. Y. Liu, G. S. Cao, T. J. Zhu and X. B. Zhao, Self-assembly of CoS2/graphene nanoarchitecture by a facile one-pot rout and its improved electrochemical Li-storage properties, Nano Energy, 2013, 2, 49–56 CrossRef CAS
- Y. M. Wang, J. J. Wu, Y. F. Tang, X. J. Lu, C. Y. Yang, M. S. Qin, F. Q. Huang, X. Li and X. Zhang, Phase-controlled synthesis of cobalt sulfides for lithium ion batteries, ACS Appl. Mater. Interfaces, 2012, 4, 4246–4250 CAS
- Q. M. Su, J. Xie, J. Zhang, Y. J. Zhong, G. H. Du and B. S. Xu, In situ transmission electron microscopy observation of electrochemical behavior of CoS2 in lithium-ion battery, ACS Appl. Mater. Interfaces, 2014, 6, 3016–3022 CAS
- Q. H. Wang, L. F. Jiao, Y. Han, H. M. Du, W. X. Peng, Q. N. Huan, D. W. Song, Y. C. Si, Y. J. Wang and H. T. Yuan, CoS2 hollow spheres: fabrication and their application in lithium-ion batteries, J. Phys. Chem. C, 2011, 115, 8300–8304 CAS
- W. Luo, Y. Xie, C. Z. Wu and F. Zheng, Spherical CoS2@carbon core-shell nanoparticles:one-pot synthesis an Li storage property, Nanotechnology, 2008, 19, 075602 CrossRef PubMed
- Z. X. Huang, Y. Wang, J. I. Wong, W. H. Shi and H. Y. Yang, Synthesis of self-assembled cobalt sulphide coated carbon nanotube and its electrochemical performance as anodes for Li-ion batteries, Electrochim. Acta, 2015, 167, 388–395 CrossRef CAS
- W. W. Chen, T. T. Li, Q. Hu, C. P. Li and H. Guo, Hierarchical CoS2@C hollow microspheres constructed by nanosheets with superior lithium storage, J. Power Sources, 2015, 286, 159–165 CrossRef CAS
- Q. F. Wang, R. Q. Zou, W. Xia, J. Ma, B. Qiu, A. Mahmood, R. Zhao, Y. Yang, D. G. Xia and Q. Xu, Facile synthesis of ultrasmall CoS2 nanoparticles within thin N-doped porous carbon shell for high performance lithium-ion batteries, Small, 2015, 11, 2511–2517 CrossRef CAS PubMed
- S. J. Peng, L. L. Li, S. G. Mhaisalkar, M. Srinivasan, S. Ramakrishna and Q. Y. Yan, Hollow nanospheres constructed by CoS2 nanosheets with a nitrogen-doped-carbon coating for energy-storage and photocatalysis, ChemSusChem, 2014, 7, 2212–2220 CrossRef CAS PubMed
- Z. Shadike, M. H. Cao, F. Ding, L. Sang and Z. W. Fu, Improve electrochemical performance of CoS2-MWCNT nanocomposites for sodium-ion batteries, Chem. Commun., 2015, 51, 10486–10489 RSC
- S. J. Peng, L. L. Li, X. P. Han, W. P. Sun, M. Srinivasan, S. G. Mhaisalkar, F. Y. Cheng, Q. Y. Yan, J. Chen and S. Ramakrishna, Cobalt sulfide nanosheet/graphene/carbon nanotube nanocomposites as flexible electrodes for hydrogen evolution, Angew. Chem., Int. Ed., 2014, 53, 12594–12599 CAS
- B. J. Cabana, L. Monconduit, D. Larcher and M. R. Palacín, Beyond intercalation-based Li-ion batteries: the state of the art and challenges of electrode materials reacting through conversion reactions, Adv. Energy Mater., 2010, 22, E170–E192 CrossRef PubMed
- C. Xu, B. Xu, Y. Gu, Z. Xiong, J. Sun and X. S. Zhao, Graphene-based electrodes for electrochemical energy storage, Energy Environ. Sci., 2013, 6, 1388–1414 CAS
- S. Yang, X. Feng, S. Ivanovici and K. Müllen, Fabrication of Graphene-Encapsulated Oxide Nanoparticles: Towards High-Performance Anode Materials for Lithium Storage, Angew. Chem., Int. Ed., 2010, 49, 8408–8411 CrossRef CAS PubMed
- V. Chabot, D. Higgins, A. Yu, X. C. Xiao, Z. W. Chen and J. J. Zhang, A review of graphene and graphene oxide sponge: material synthesis and applications to energy and the environment, Energy Environ. Sci., 2014, 7, 1564–1596 CAS
- J. R. He, Y. F. Chen, P. J. Li, F. Fu, Z. G. Wang and W. L. Zhang, Self-assembled CoS2 nanoparticles wapped by CoS2-quantum-dots-anchored graphene nanosheets as superior-capability anode for lithium-ion batteries, Electrochim. Acta, 2015, 182, 424–429 CrossRef CAS
- J. X. Guo, F. F. Li, Y. F. Sun, X. Zhang and L. Tang, Graphene-encapsulated cobalt sulfides nanocages with excellent anode performance for lithium ion batteries, Electrochim. Acta, 2015, 167, 32–38 CrossRef CAS
- S. Permien, S. Indris, U. Scürmann, L. Kienle, S. Zander, S. Doyle and W. Bensch, What happens structurally and electronically during the Li conversion reaction of CoFe2O4 nanoparticles: an operand XAS and XRD investigation, Chem. Mater., 2016, 28, 434–444 CrossRef CAS
- H. Su, Y. F. Xu, S. C. Feng, Z. G. Wu, X. P. Sun, C. H. Shen, J. Q. Wang, J. T. Li, L. Huang and S. G. Sun, Hierarchical Mn2O3 Hollow microspheres as anode material of lithium ion battery and its conversion reaction mechanism investigated by XANES, ACS Appl. Mater. Interfaces, 2015, 7, 8488–8494 CAS
- L. S. Li, R. Jacobs, P. Gao, L. Y. Gan, F. Wang, D. Morgan and S. Jin, Origins of large voltage hysteresis in high-energy-density metal fluoride lithium-ion battery conversion electrodes, J. Am. Chem. Soc., 2016, 138, 2838–2848 CrossRef CAS PubMed
- W. F. Huang, J. Zhou, B. Li, L. An, P. C. Cui, W. Xia, L. Song, D. G. Xia, W. S. Chu and Z. Y. Wu, A new rout toward improved sodium ion batteries: a multifunctional fluffy Na0.67FePO4/CNT nanocactus, Small, 2015, 11, 2170–2176 CrossRef CAS PubMed
- D. C. Marcano, D. V. Kosynkin, J. M. Berlin, A. Sinitskii, Z. Sun, A. Slesarev, L. B. Alemany, W. Lu and J. M. Tour, Improved synthesis of graphene oxide, ACS Nano, 2010, 4, 4806–4814 CrossRef CAS PubMed
- S. Tao, W. F. Huang, G. X. Wu, X. B. Zhu, X. B. Wang, M. Zhang, S. H. Wang, W. S. Chu, L. Song and Z. Y. Wu, Performance enhancement of lithium-ion battery with LiFePO4@C/RGO hybrid electrode, Electrochim. Acta, 2014, 144, 406–411 CrossRef CAS
- S. J. Peng, X. P. Han, L. L. Li, Z. Q. Zhu, F. Y. Cheng, M. Srinivansan, S. Adams and S. Ramakrishna, Unique cobalt sulfide/reduced graphene oxide composite as an anode for sodium-ion batteries with superior rate capability and long cycling stability, Small, 2016, 12, 1359–1368 CrossRef CAS PubMed
- C. H. Chuang, T. F. Wang, Y. C. Shao, Y. C. Yeh, D. Y. Wang, C. W. Chen, J. W. Chiou, S. C. Ray, W. F. Pong, L. Zhang and J. F. Zhu, The effect of thermal reduction on the photoluminescence and electronic structure of graphene oxides, Sci. Rep., 2014, 4, 4525 CrossRef PubMed
- J. Zhong, J. J. Deng, B. H. Mao, T. Xie, X. H. Sun, Z. G. Mou, C. H. Hong, P. Yang and S. D. Wang, Probing
solid state N-Doping in graphene by X-ray absorption near-edge structure spectroscopy, Carbon, 2012, 50, 321–341 CrossRef
- R. P. Gandhiraman, D. Nordlind, C. Jassica, J. E. Koehne, B. Chen and M. Meyyappan, X-ray absorption study of graphene oxide and transition metal oxide nanocomposites, J. Phys. Chem. C, 2014, 118, 18706–18712 CAS
- X. Y. Li, N. Q. Fu, J. Z. Zou, X. R. Zeng, Y. M. Chen, L. M. Zhou, W. Lu and H. T. Huang, Ultrafine cobalt sulfide nanoparticles encapsulated hierarchical N-doped carbon nanotubes for high-performance lithium storage, Electrochim. Acta, 2017, 137–142 CrossRef
- L. Yu, J. F. Yang and X. W. Lou, Formation of CoS2 nanobubble hollow prisms for highly reversible lithium storage, Angew. Chem., Int. Ed., 2016, 55, 13422–13426 CrossRef CAS PubMed
- H. Li, Y. H. Wang, J. X. Huang, Y. Y. Zhang and J. B. Zhao, Microwave-assisted of CuS/graphene composite for enhanced lithium storage properties, Electrochim. Acta, 2017, 225, 443–451 CrossRef CAS
- P. L. Lou, Z. H. Cui, Z. Q. Jia, J. Y. Sun, Y. B. Tan and X. X. Guo, Monodispersed carbon-coated cubic NiP2 nanoparticles anchored on carbon nanotubes as ultra-long-life anodes for reversible lithium storage, ACS Nano, 2017, 11, 3705–3715 CrossRef CAS PubMed
- B. M. Chae, E. S. Oh and Y. K. Lee, Conversion mechanisms of cobalt oxide anode for Li-ion battery: In situ X-ray absorption fine structure studies, J. Power Sources, 2015, 274, 748–754 CrossRef CAS
- K. F. Zhong, B. Zhang, S. H. Luo, W. Wen, H. Li, X. J. Huang and L. Q. Chen, Investigation on porous MnO microsphere anode for lithium ion batteries, J. Power Sources, 2011, 196, 6802–6808 CrossRef CAS
Footnote |
| † Electronic supplementary information (ESI) available: The Raman spectrum of GO and CoS2/G, TGA curve of CoS2/G sample, SEM and TEM images of the bare CoS2, CV curves and charge–discharge curves of bare CoS2 sample. See DOI: 10.1039/c7ra07068c |
| This journal is © The Royal Society of Chemistry 2017 |