 Open Access Article
A study of the water molecule using frequency control over nuclear dynamics in resonant X-ray scattering
Vinícius
Vaz da Cruz
a,
Emelie
Ertan
b,
Rafael C.
Couto
ac,
Sebastian
Eckert
d,
Mattis
Fondell
e,
Marcus
Dantz
f,
Brian
Kennedy
e,
Thorsten
Schmitt
f,
Annette
Pietzsch
e,
Freddy F.
Guimarães
c,
Hans
Ågren
 ag,
Faris
Gel'mukhanov
ag,
Michael
Odelius
ag,
Faris
Gel'mukhanov
ag,
Michael
Odelius
 *b,
Alexander
Föhlisch
*de and
Victor
Kimberg
*a
aTheoretical Chemistry and Biology, Royal Institute of Technology, 10691 Stockholm, Sweden. E-mail: kimberg@kth.se
bDepartment of Physics, Stockholm University, AlbaNova University Center, 10691 Stockholm, Sweden. E-mail: odelius@fysik.su.se
cInstituto de Química, Universidade Federal de Goiás, Campus Samambaia, CP 131 CEP 74001-970, Goiânia-GO, Brazil
dInstitut für Physik und Astronomie, Universität Potsdam, Karl-Liebknecht-Strasse 24-25, 14476 Potsdam, Germany
eInstitute for Methods and Instrumentation in Synchrotron Radiation Research G-ISRR, Helmholtz-Zentrum Berlin für Materialien und Energie Albert-Einstein-Strasse 15, 12489 Berlin, Germany. E-mail: alexander.foehlisch@helmholtz-berlin.de
fResearch Department Synchrotron Radiation and Nanotechnology, Paul Scherrer Institut, CH-5232 Villigen PSI, Switzerland
gInstitute of Nanotechnology, Spectroscopy and Quantum Chemistry, Siberian Federal University, 660041 Krasnoyarsk, Russia
First published on 14th March 2017
Abstract
In this combined theoretical and experimental study we report a full analysis of the resonant inelastic X-ray scattering (RIXS) spectra of H2O, D2O and HDO. We demonstrate that electronically-elastic RIXS has an inherent capability to map the potential energy surface and to perform vibrational analysis of the electronic ground state in multimode systems. We show that the control and selection of vibrational excitation can be performed by tuning the X-ray frequency across core-excited molecular bands and that this is clearly reflected in the RIXS spectra. Using high level ab initio electronic structure and quantum nuclear wave packet calculations together with high resolution RIXS measurements, we discuss in detail the mode coupling, mode localization and anharmonicity in the studied systems.
I. Introduction
Understanding the properties of water has for long formed a prioritized research area because of the obvious importance of liquid water as a solvent and its role in biological life.1–4 Water in the gas-phase shows an interesting study case due to its simplicity of symmetry, geometry and non-degenerate electronic structure, while yet representing most of the intricacies of a full many-body system. This makes water a superb model system for theory and high-resolution spectroscopy and their combined application. Infra-red (IR) spectroscopy has stood out as a powerful tool for studying the ro-vibrational structure of ground state water. Its main advantage is the attainable ultra-high resolution.1,5,6 In the last few decades, new approaches to study water and other gas-phase molecules have been made available by the development of X-ray spectroscopic techniques.7–17 Modern resonant inelastic X-ray scattering (RIXS)18,19 has been established as a powerful tool in studies of ultrafast nuclear dynamics. The combination of element selectivity and drastic improvement of spectral resolution20,21 makes RIXS complementary to the IR spectroscopy technique in studies addressing the nuclear degrees of freedom.The structure of hydrogen bonds in liquid water22–26 as well as the isotope substitution effect on ultrafast dynamics upon core-excitation27–29 was addressed in several recent studies using X-rays. In this context, a comprehensive understanding of the structure and dynamics of the isolated water molecule is an important basis for the studies of structure and dynamics also in the liquid phase.
An important aspect of soft X-ray spectroscopy, in particular, is that the core-electron transitions can induce nuclear dynamics. Indeed, upon excitation of an 1s core-electron to an unoccupied orbital, the molecule undergoes nuclear distortions according to the multi-dimensional potential energy surface (PES), the shape of which depends drastically on the electronic configuration of the core-excited state of the molecule. The nuclear dynamics occurs within a short core-hole lifetime (e.g., for oxygen 1s it is about 4 fs). Such X-ray induced dynamics, much owing to the site selectivity and ultra-short time scales, has been extensively used for probing single mode systems to great detail.30–36 In multi-mode systems, the X-ray induced nuclear wave packet dynamics can be very complicated due to the multi-dimensional PESs and vibrational modes coupling,37–39 resulting in a challenging analysis of the X-ray spectra. Due to this circumstance, a very important task of modern spectroscopy is to beat complexity by using the selectivity of X-ray excitation.
We have recently demonstrated40 that the three lowest intermediate core-excited states of gas-phase water can be considered as filters which single out excitations of a particular type of vibrational motion in the ground electronic state: bending, symmetric and antisymmetric stretching, something that can be applied for easier mapping of the PES of multimode molecular systems. In the present article, we go further and study the dynamical effect in RIXS by changing the excitation energy across particular resonances, which appears as an additional probe for the vibrational states in the ground electronic state and their localization in symmetric (H2O, D2O) and asymmetric (HDO) systems. Here, we will show that, by means of the detuning control, one can reach vibrational levels up to the dissociation limit, which showcases the potential of using the RIXS technique to investigate the multi-dimensional potential surface of complex molecular systems.
In the present paper, we report a thorough and detailed analysis of vibrationally resolved electronically-elastic RIXS of gas-phase water, allowing for advanced studies of the molecular ground state. We do so by combining high-resolution experimental measurements over a broad range of excitation energies, high level ab initio electronic structure methods and a multi-dimensional quantum wave packet description of the nuclear motion. Furthermore, in order to reach a more complete understanding of the nuclear dynamics upon core excitation of water, our study is extended by numerical simulations of the D2O and HDO isotopes. Indeed, as the electronic structures of the ground and core-excited states are the same for water and its isotope analogues, this provides an opportunity to study the RIXS spectral changes only in terms of dynamical features. In contrast to the symmetric H2O and D2O molecules, the symmetry breaking of HDO results in a localization of the stretching vibrations on the OH and OD bonds. One should note that although in HDO vibrational localization occurs in the ground state, vibrational delocalization is restored in certain core-excited states.41 Special attention is paid to the decay transitions from the HO and DO fragments of dissociation in the core-excited state. The corresponding RIXS feature known as the “atomic” peak42,43 is different in H2O, D2O and HDO. The reason for this is the difference in the vibrational structure of these fragments as well as the slower dissociation of hydrogen in comparison with deuterium.
The paper is organized as follows. The details of the experiment are discussed in Section II. Modeling of electronic states and of nuclear dynamics in simulations of RIXS of gas-phase water is presented in Section III. Section IV collects the results of numerical simulations, their analysis including the comparison with the experiment and the results of simulations of isotopic substitutions of H2O. Our findings are summarized in Section V.
II. Experiment
The experimental spectra presented here were measured using the SAXES spectrometer44 at the RIXS end station of the ADRESS beam line45 at the Swiss Light Source. As described in our previous report,40 the H2O(g) sample was prepared by evacuation and heating of a 10 ml H2O(l) sample reservoir at 60°. The obtained gas was then transferred through previously evacuated and heated steel capillaries towards the interaction point. The sample volume was separated from the experimental chamber by a 150 nm thick silicon nitride membrane. We established a continuous sample replacement by constant evacuation of the H2O(l) sample reservoir, in turn generating a flow of fresh sample at the interaction volume. The signal emitted from the sample volume was detected using a spherical variable line space high-resolution RIXS spectrometer. The photon energy ω used for the excitation of the sample was scanned around the three lowest core-excited states |1a1−14a11〉, |1a1−12b21〉, |1a1−12b11〉 (also referred in what follows as 4a1, 2b2 and 2b1, respectively), extending over a total energy interval 533.25 ≤ ω ≤ 537.56 eV. The resonantly scattered photons were detected at a 90° angle from the incoming photons with a combined experimental resolution of 75 meV.III. Theory
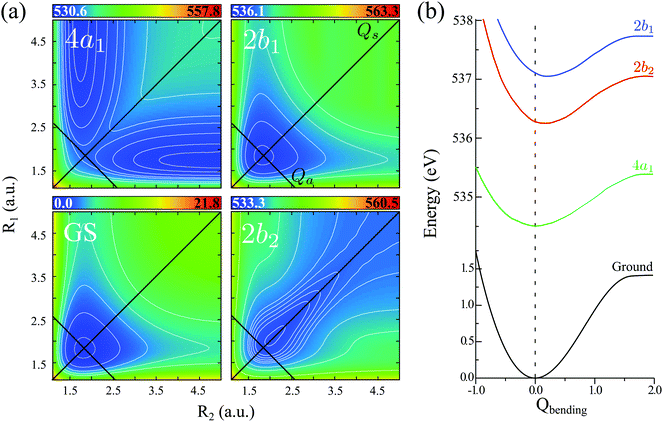
The water molecule has three vibrational normal modes: bending (b), symmetric (s) and antisymmetric (a) stretching. It is known46,47 that the two stretching modes are strongly coupled (Darling–Dennison coupling) due to the close vibrational frequencies (ωs = 3656.65 cm−1 and ωa = 3755.79 cm−1) and anharmonicity. The weaker coupling between the bending mode and the stretching motion allows one to treat the one-dimensional (1D) bending and the two-dimensional (2D) stretching motions separately in what we call a 2D + 1D model.40 We assume that the Born–Oppenheimer approximation is valid. Therefore, the electronic structure is described through the calculated ab initio PESs (see Fig. 1 and the detailed description given in Section IIIA), while the nuclear degrees of freedom are treated by numerical time-dependent wave packet propagation48,49 (described in Section IIIC).In the 2D + 1D model, the 2D stretching motion is modeled by means of wave packet propagation on a two-dimensional PES, whereas simultaneously the bending mode is treated by solving the time-independent Schrödinger equation followed by calculations of the 1D Franck–Condon (FC) amplitudes. The 2D stretching dynamics is obtained by numerical solution of the time-dependent Schrödinger equation,50,51
 | (1) |
 | (2) |
 | (3) |
A. Electronic structure and potential energy surfaces
The electronic structure calculations presented in this article were performed using RASPT2 calculations, in which static electron correlation is treated variationally within the restricted-active-space self-consistent field (RASSCF) framework53,54 and dynamical electron correlation is included in a perturbative fashion. The RASSCF orbital space is subdivided into three smaller sections with different restrictions applied to the MOs in these subspaces. The three subspaces are referred to as RAS1, where the number of allowed (electrons) holes is restricted, RAS2, where a full CI is performed (all possible permutations of electrons are allowed) and RAS3, where a restricted number of electrons is admitted. Hence, the choice of the orbital space and the partitioning of the active orbitals are of great importance in these calculations.In the water molecule, in order to study the states we were interested in, at the very least, the consideration of 8 MOs O1s(1a1), 2a1, 3a1, 1b2, 1b1, 4a1, 2b2, 2b1, however, to improve the description of the states, additional higher energy MOs were also included. In particular, the ground state geometry optimization and the determination of the normal vibrational modes were performed with an active space of 8 electrons in 9 active orbitals, with the 1a1 MO placed in the inactive space. In the calculation of the PESs, we included three additional MOs in the active space, resulting in an active space of 10 electrons in 11 active orbitals. The 1a1 orbital, which was frozen from the Hartree–Fock calculation, was placed in RAS3 and the ground state and the three core-excited states were generated in two separate RASSCF calculations with two and one electrons occupying RAS3, respectively. RASSCF state-averaging was employed over the |1a1−14a11〉 and |1a1−12b21〉 core-excited states. All calculations were performed employing Cs symmetry and Cholesky decomposition of the two-electron integrals.
To accurately represent the dynamic electron correlation, we employed the CAS/RAS-PT2 scheme55,56 for all electronic structure calculations, wherein second-order multi-configurational perturbation is performed on the reference states (CAS/RASSCF). To avoid the problems introduced by intruder states (weakly interacting), an imaginary shift of 0.1 a.u. was used. Multi-state RASPT2 was performed over the |1a1−14a11〉 and |1a1−12b21〉 core-excited states. Spin-free energy eigenstates and the transition dipole moments were calculated in the RAS state interaction program (RASSI).57,58
To obtain correct excitation energies for the core-excited states, relativistic effects should be accounted for. Scalar relativistic effects were included by using the ANO-RCC59 relativistic basis set in combination with the Douglas–Kroll–Hess approach,60,61 wherein block-diagonalization of the relativistic (Dirac) Hamiltonian by a unitary operator transforms the four-component relativistic wave function to a two-component form and mean-field integrals were computed using the atomic mean field (AMFI)62 approximation.
The presence of low-lying electronically excited states of the Rydberg character in the water molecule63 made it necessary to employ a basis set that could describe the character of both the valence excited states and the lowest Rydberg excited states. To this end, a (2s2p1d) Rydberg basis set was generated according to the steps described in ref. 64, and used in combination with the main ANO-RCC basis set for the calculation of the PESs. All calculations described in this section were performed using the MOLCAS 8.0 software.65
B. Spectrum of the ground state stretching modes
The vibrational spectrum related to the 2D stretching potential (Fig. 1) of the ground state H2O is shown in Fig. 2a and summarized in more detail in Table 1, where it is compared with previous studies.66 For the very lowest vibrational levels of the ground electronic state, the harmonic approximation is applicable, and as a result the 2D stretching motion can be modeled as two uncoupled harmonic oscillators – symmetric and antisymmetric – described by the normal coordinates Qs ∝ R1 + R2 and Qa ∝ R2 − R1, respectively. However, this model fails to explain the spectrum starting from the n = 3 vibrational group due to the anharmonicity of the PES (see the PES shape in Fig. 1). In spite of this, it is useful to keep the assignment of the 2D vibrational states ψns,na based on the quantum numbers ns and na of the symmetric and antisymmetric stretching modes.67Fig. 2a shows that the stretching vibrational energy levels of the ground state are grouped according to the group number n| n = ns + na. | (4) |
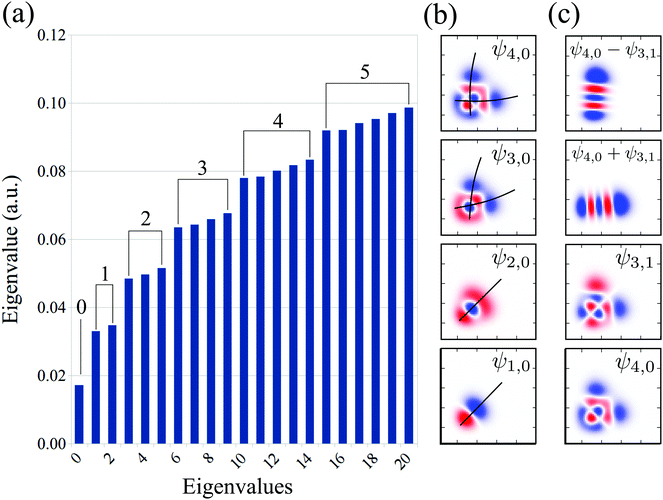 | ||
| Fig. 2 Theoretical vibrational eigenvalues and eigenfunctions computed using the 2D stretching PES of the ground state H2O (Fig. 1). (a) Vibrational spectrum. The numbers on the top of the bars represent the group number n = 0, 1, 2,… The assignment of each eigenstate is collected in Table 1. (b) Bifurcation of the vibrational wave function, illustrated by the black lines. (c) Vibrational mode localization: delocalized vs localized representation. | ||
| n | N | (ns, na) | This work | Theo.66 | Exp.66 |
|---|---|---|---|---|---|
| 1 | 1 | (1,0) | 0.4588 | 0.4532 | 0.4531 |
| 2 | (0,1) | 0.4680 | 0.4654 | 0.4654 | |
| 2 | 3 | (2,0) | 0.9003 | 0.8924 | 0.8923 |
| 4 | (1,1) | 0.9037 | 0.8983 | 0.8983 | |
| 5 | (0,2) | 0.9295 | 0.9224 | 0.9224 | |
| 3 | 6 | (3,0) | 1.3222 | 1.3134 | 1.3133 |
| 7 | (2,1) | 1.3229 | 1.3151 | 1.3150 | |
| 8 | (1,2) | 1.3581 | 1.3467 | 1.3467 | |
| 9 | (0,3) | 1.3763 | 1.3669 | 1.3669 | |
| 4 | 10 | (4,0) | 1.7241 | 1.7133 | 1.7133 |
| 11 | (3,1) | 1.7242 | 1.7136 | 1.7137 | |
| 12 | (2,2) | 1.7769 | 1.7621 | 1.7620 | |
| 13 | (1,3) | 1.7869 | 1.7741 | 1.7741 | |
| 14 | (0,4) | 1.8141 | 1.8011 | 1.8012 | |
| 5 | 15 | (5,0) | 2.1070 | 2.0936 | 2.0937 |
| 16 | (4,1) | 2.1070 | 2.0936 | 2.0938 | |
| 17 | (3,2) | 2.1807 | 2.1631 | 2.1631 | |
| 18 | (2,3) | 2.1841 | 2.1676 | 2.1677 | |
| 19 | (1,4) | 2.2153 | 2.1990 | 2.1990 | |
| 20 | (0,5) | 2.2408 | 2.2237 | — | |
| 6 | 21 | (6,0) | 2.4702 | 2.4507 | 2.4509 |
| 22 | (5,1) | 2.4702 | 2.4507 | 2.4509 | |
| 23 | (4,2) | 2.5647 | 2.5440 | 2.5442 | |
| 24 | (3,3) | 2.5654 | 2.5418 | 2.5453 | |
| 25 | (2,4) | 2.6102 | 2.5903 | — | |
| 26 | (1,5) | 2.6271 | 2.6069 | — | |
| 27 | (0,6) | 2.6579 | 2.6357 | — | |
The energy spacing between the vibrational states has a peculiar behavior. A strict solution of the eigenvalue problem for the 2D stretching potential of H2O gives a qualitatively different spectrum (Fig. 2a) compared to the one predicted by the independent stretching mode approximation, which gives a monotonically varying energy spacing. Within the nth group (n ≥ 3), a degeneracy of the low lying energy vibrational states ψn,0 and ψn−1,1 can be observed (Table 1). This degeneracy is accompanied by bifurcations of the ground state vibrational wave functions ψn,0 and ψn−1,1, where one can find density lobes localized along the bonds R1 and R2 (Fig. 2b). This phenomenon is known as the normal-to-local mode transition.67,68 The degeneracy of the states means that the delocalized ψn,0, ψn−1,1 and localized
 | (5) |
C. RIXS cross section
In the 2D + 1D model, the total vibrational wave function is the product of the bending wave function |νi〉 and the stretching one |ψns,na〉. The initial state of the presently investigated electronically-elastic RIXS process is the lowest vibrational level |0〉|ψ0,0〉 of the ground electronic state, while the final RIXS state is the vibrationally excited state| |νf〉|ψns,na〉. | (6) |
The RIXS cross section is given by the Kramers–Heisenberg equation,18 which can be written in the 2D + 1D model as
 | (7) |
 | (8) |
 , the RIXS cross section can be written as48,49
 | (9) |
 | (10) |
D. Symmetry selection rules and propensity rules
The PESs of H2O (Fig. 1) is symmetric with respect to the reflection Qa → −Qa relative to the Qs axis. This results in the following symmetry property of the stretching vibrational wave function of the ground state40| ψnsna(Qs,−Qa) = (−1)naψnsna(Qs,Qa). | (11) |
On top of the strict symmetry (parity) selection rules additional propensity rules can be applied in the case of RIXS, depending on the relative shapes of the core-excited wave-packet (8) and the final anharmonic vibrational wave functions (Fig. 2). They will be discussed in detail by comparing the wave packet dynamics in the dissociative 4a1 and bound 2b2 core-excited states (Section IVB).
E. Details of numerical simulations
All wave packet propagations were computed employing the eSPec program,51,70 which uses a second-order propagation scheme and a discrete variable representation (DVR) of the wave functions.70,71 The kinetic energy operator in (2) was implemented considering fourth-order![[scr O, script letter O]](https://www.rsc.org/images/entities/char_e52e.gif) (ΔR4) finite difference numerical derivatives. For the one-dimensional cases, direct diagonalization of the Hamiltonian was carried out to obtain the vibrational eigenstates, for the 2D potentials the Lanczos tridiagonalization algorithm was used.71 The wave packets were discretized with coordinate steps of ΔR1 = ΔR2 = 4.0 × 10⁻² a.u. on a 320 × 320 grid and were propagated with a time step of Δt = 5.0 × 10⁻⁴ fs. Absorbing boundary conditions72 were used for the dissociative potential in order to avoid non-physical reflections at the edges of the spatial grid.
(ΔR4) finite difference numerical derivatives. For the one-dimensional cases, direct diagonalization of the Hamiltonian was carried out to obtain the vibrational eigenstates, for the 2D potentials the Lanczos tridiagonalization algorithm was used.71 The wave packets were discretized with coordinate steps of ΔR1 = ΔR2 = 4.0 × 10⁻² a.u. on a 320 × 320 grid and were propagated with a time step of Δt = 5.0 × 10⁻⁴ fs. Absorbing boundary conditions72 were used for the dissociative potential in order to avoid non-physical reflections at the edges of the spatial grid.
Because both ω and ω′ lie close to the X-ray absorption profile, the absorption of incoming and scattered photons is important. We took into account the self-absorption for the scattering cross section using the equation73–75
 | (12) |
 | (13) |
In order to reproduce the experimental profile, the theoretical RIXS cross section (12) was convoluted using the instrumental function Φ(ω1′ − ω′), which we approximated by using the Gaussian function:
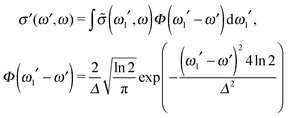 | (14) |
IV. Results
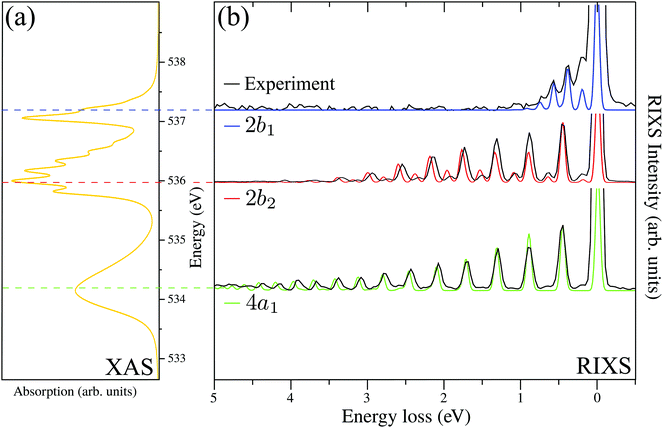
The RIXS spectrum is very sensitive to nuclear dynamics in the intermediate core-excited state, and due to this we start with an analysis of the vibrationally resolved XAS (13). The computed near-edge X-ray absorption spectrum of the gas-phase H2O (Fig. 3a) consists of three bands corresponding to the three lowest core-excited states 4a1, 2b2 and 2b1, in agreement with previous experimental and theoretical studies.13,15 In order to reproduce the relative intensity of the three core-excited resonances, an appropriate ratio of the transition dipole moments has to be taken into account. In our simulations, we use the following ratio of the squared electronic transition dipole moments76d4a1,02![[thin space (1/6-em)]](https://www.rsc.org/images/entities/char_2009.gif) :
:![[thin space (1/6-em)]](https://www.rsc.org/images/entities/char_2009.gif) d2b2,02
d2b2,02![[thin space (1/6-em)]](https://www.rsc.org/images/entities/char_2009.gif) :
:![[thin space (1/6-em)]](https://www.rsc.org/images/entities/char_2009.gif) d2b1,02 = 1
d2b1,02 = 1![[thin space (1/6-em)]](https://www.rsc.org/images/entities/char_2009.gif) :
:![[thin space (1/6-em)]](https://www.rsc.org/images/entities/char_2009.gif) 1.37
1.37![[thin space (1/6-em)]](https://www.rsc.org/images/entities/char_2009.gif) :
:![[thin space (1/6-em)]](https://www.rsc.org/images/entities/char_2009.gif) 0.57.
0.57.
Due to the dissociative character of the 4a1 core-excited state, this state is presented in the XAS as a broad band centered at ω = 534.15 eV without any vibrational structure. In contrast, the 2b2 state has a bound character with the PES strongly different from the ground state potential (Fig. 1). Due to this, the XAS profile (maximum at 536.00 eV) displays a rather long vibrational progression. The narrow absorption peak at 537.06 eV corresponds to the transition to the bound 2b1 state. The reason for the suppression of the vibrational structure for this band is the nearly parallel PESs of the ground and 2b1 core-excited states (Fig. 1). The nuclear dynamics in the core-excited state, and hence the RIXS spectral profile, also depends strongly on the detuning
| Ω = ω − ωXASc | (15) |
A. RIXS of H2O near the top of the 2b1, 2b2 and 4a1 resonances
Fig. 3b collects the experimental and theoretical RIXS spectra near the top of the 2b1, 2b2 and 4a1 resonances: Ω2b1 = +0.20 eV, Ω2b2 = −0.025 eV and Ω4a1 = +0.05 eV.B. Spatial distribution of the core-excited wave packet and propensity rule
One can discern an interesting effect by comparing the RIXS spectra at the 2b2 and 4a1 resonances (see Fig. 5). Both experiment and theory display a shift between these spectra for ω − ω′ > 1 eV (n > 2). To understand this phenomenon, let us scrutinize the stretching states ψns,na involved in the formation of the RIXS spectrum.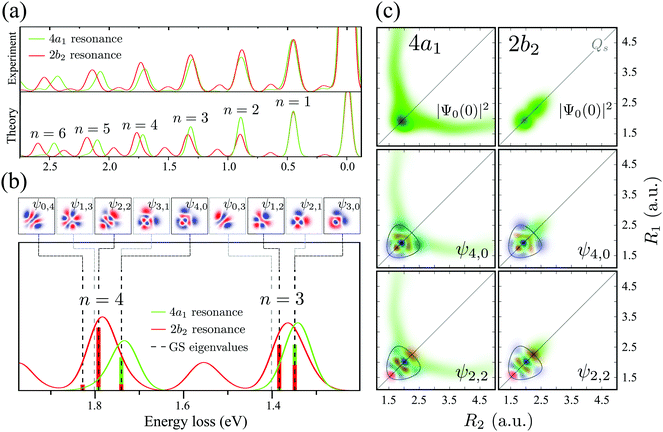 | ||
| Fig. 5 (a) Comparison between experimental and theoretical RIXS at 4a1 and 2b2 resonances. The experimental curves are smoothed by spline interpolation. The detuning is the same as in Fig. 3. (b) A closer look at the theoretical RIXS spectra from panel (a). The ground state wave functions are shown on the top. The colored bars below the spectra are the Franck–Condon factors between the ground state wave functions and the core-excited wave packets |〈ψns,na|Ψ0(0)〉|2. The gray dashed lines show the energies of the ψ1,3, ψ3,1, ψ0,3 and ψ2,1 states, which are forbidden in RIXS according to the selection rules (Section IIIC). (c) The overlap between the core-excited wave packet |Ψ0(0)|2 at the 4a1 and 2b2 resonances and the ground state wave functions (ψns,na). The contour lines in the wave function plots represent the classical turning curve of the ground state PES. The detuning is the same as in Fig. 3. | ||
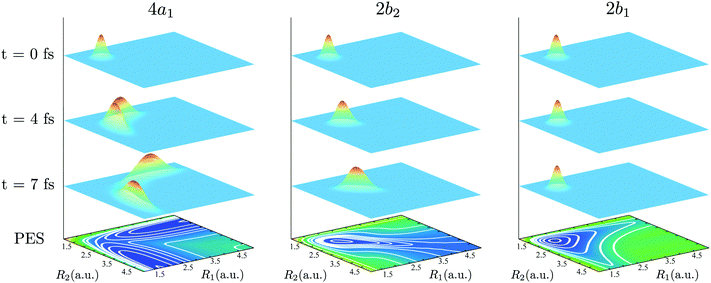
The bars in the zoomed RIXS spectra (Fig. 5b) show the positions and strengths of the stretching states which contribute to the observed peak. The strength of the resonance is given by the overlap |〈ψns,na|Ψ0(0)〉|2 between the core-excited wave packet Ψ0(0) and the ground state wave functions ψns,na (see eqn (7)). According to the selection rules (Section IIID), transitions to the states with odd na are forbidden in the RIXS via both 4a1 and 2b2 states. In order to explain the observed spectral shift we have to address additional propensity rules arising from the qualitatively different shape of the core-excited wave packet in the 4a1 and 2b2 states. Indeed, the RIXS process at the 4a1 resonance populates mainly the states ψns,0, which are suppressed in the RIXS spectrum at the 2b2 resonance, where the main contributions come from the states ψns,na with na ≠ 0. To explain this propensity rule, let us pay attention to the qualitatively different propagation dynamics of ψc(t) in the 4a1 and 2b2 core-excited states (Fig. 4), which results in different spatial shapes of the integrated wave packet Ψ0(0) hence leading to changes in the FC amplitudes |〈ψns,na|Ψ0(0)〉|2 to the same final state ψns,na.
Upon excitation at the 4a1 resonance, the wave packet propagates along the bonds R1 and R2, and within 7 fs the H atom is already 4 a.u. apart from the ˙OH fragment, characterizing an ultrafast dissociation. The symmetric shape of the wave packet shows equal probability of the dissociation of either of the OH bonds. In the 2b2 core-excited state, however, the wave packet is confined within the potential well and it bounces back and forth along the symmetric stretching coordinate Qs, which means that both OH bonds are excited coherently in this RIXS channel. The propensity rule is fully explained by Fig. 5c which compares |Ψ0(0)|2 (8) and its projection on the ground state wave functions ψ4,0 and ψ2,2 for the 4a1 and 2b2 intermediate core-excited states. Let us pay attention to the density lobes of the wave functions allocated near the eigenvalue contour lines, corresponding to the classical turning curves of the ground state potential, where the wave packet resides most of the time.18 The 4a1 core-excited wave packet overlaps better with ψ4,0, which has density lobes along R1 and R2, rather than with ψ2,2 the density lobes of which lie along Qs (Fig. 5c). At the 2b2 resonance, in contrast, the wave packet overlaps poorly with ψ4,0 and perfectly with ψ2,2 (Fig. 5c, right-hand side). This phenomenon results in an approximate selection rule, or propensity rule, in contrast to the strict symmetry selection rules (Section IIID). We will see in the following Section IVC that the propensity rule for the RIXS at the 4a1 resonance is violated for the large positive detuning, where the population of the state ψns,2 becomes significant.
There is an alternative explanation for why ψ4,0 overlaps much better with the dissociative core-excited wave packet rather than with the 2b2 one. Due to the degeneracy of the vibrational states ψn,0 and ψn−1,1 (for n ≥ 3) one can use on the same footing the localized states ψR1 and ψR2 defined in eqn (5) and displayed in Fig. 2c. The strong bond localization of these states explains the discussed propensity rules for the ψn,0 levels in the 4a1 and 2b2 spectra.
It is important to emphasize that the spatial shape of Ψ0(0) is defined by the shape of the PES, which is in general different for different core-excited states in a molecule. Due to this, the propensity rules can be exploited for selective probing of the ground state potential of multimode systems, as it has been recently demonstrated.40
C. Wave packet dynamics controlled by the excitation energy detuning
It is well established that the shape of a RIXS spectrum is very sensitive to the dynamics of the nuclear wave packet in the core-excited PES, which depends inherently on the PES shape. However, there is also a possibility to manipulate the core-excited wave packet dynamics within the selected PES by controlling the scattering duration18,50 | (16) |
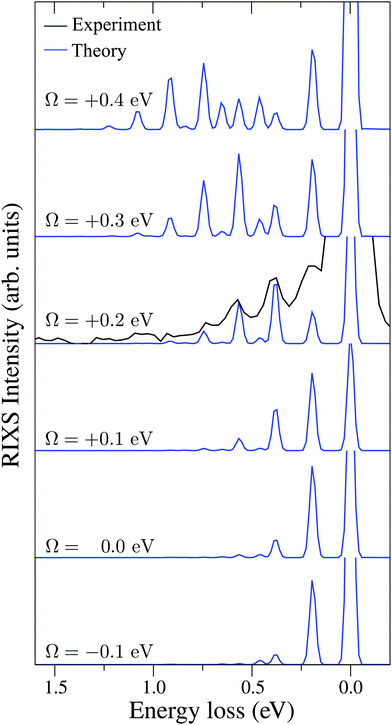 | ||
| Fig. 6 Experimental RIXS at the 2b1 resonance for Ω = +0.2 eV and theoretical RIXS at various detuning values Ω. | ||
It is necessary to address the peculiar behavior observed for the peak intensities in the theoretical model, showing a non-monotonous intensity distribution. It arises due to the self-absorption effect, which is taken into account approximately in our theoretical model (12), and it is clearly overestimated for the second vibrational peak in the RIXS at the 2b1 resonance.
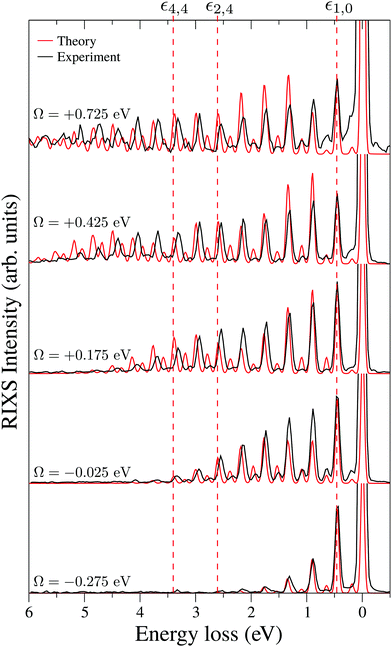
To explain in more detail the shortening of the vibrational progression on the way from positive to negative detuning lets us compare the frequency of sign-changing oscillations of the wave packet Ψ0(0) and the eigenstate ψ4,4 along Qs (see Fig. 8). This frequency is proportional to the number of nodes along the antisymmetric mode. The number of nodes is 5 for ψ4,4, while Ψ0(0) has 6, 2 and 3 nodes for Ω = +0.725, +0.175 and −0.025 eV, respectively. The growing mismatch of the frequency of the sign-changing oscillations (number of nodes) of ψ4,4 and Ψ0(0) explains the strong suppression of the peak ε4,4 on the way from Ω = +0.725 to −0.025 eV seen in Fig. 7.
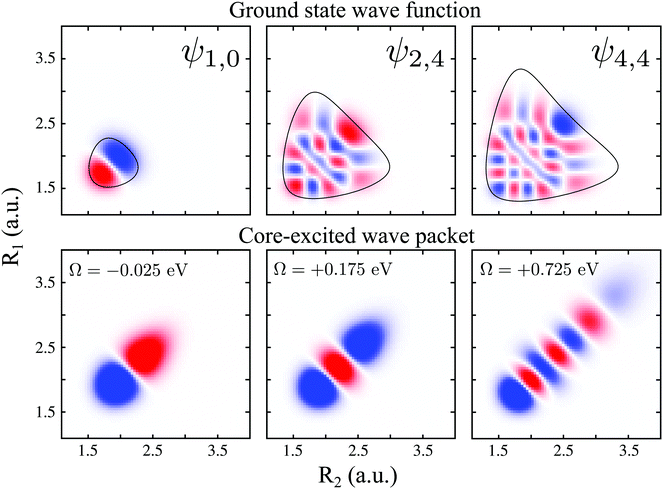 | ||
| Fig. 8 Upper panel: ψ1,0, ψ2,4 and ψ4,4 ground state wave functions. The contour around the wave functions represents the edges of the PES (classical turning curves). Lower panel: real part of the 2b2 core-excited wave packet Ψ0(0) giving by eqn (10), for detuning values Ω = −0.025, +0.175 and +0.725 eV. | ||
One should note that each peak of the spectra shown in Fig. 7 has an underlying fine structure (see Table 1), caused by quasi-degenerated stretching modes, which is, however, hidden by the total experimental broadening Δ = 0.098 eV. One can see that each bending peak (ν = 0 → νf = 1) copies the fine structure of the parent stretching peak because the coupling between the bending and stretching motions is neglected.
Fig. 7 displays some shift between the theoretical and experimental RIXS spectra for energy loss ω − ω′ > 1 eV, which deserves a special comment. The potentials used in the simulations are obtained directly from the ab initio electronic structure calculations, the accuracy of which drops down as the geometry becomes distorted. Due to this fact, the potential energy surface steepness is overestimated at large R1 and R2, resulting in a slightly larger vibrational frequency as compared to one observed in the experiment (Table 1). In previous studies,81 the most accurate potentials were obtained by combining ab initio and experimental data, where the computed potential was fitted with the vibrational energies measured in IR experiments. Another possible reason for the observed shift is a breakdown of the 2D + 1D approximation, resulting in a shift of the center of gravity of the stretching peak due to possible redistribution of the FC factors within the nth group. One can also observe some overestimation of the intensity of the bending peaks in the region ω − ω′ > 3 eV for Ω = +0.425 and +0.725 eV, which can also be attributed to the limitation of the 2D + 1D model. The 2D + 1D approximation may breakdown for higher vibrational states (ω − ω′ > 2 eV), where R1 and R2 are large and the bond angle may deviate significantly from the equilibrium.
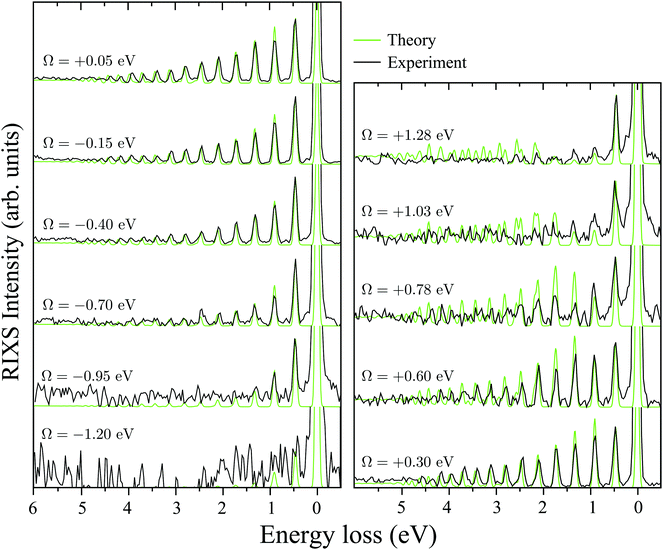
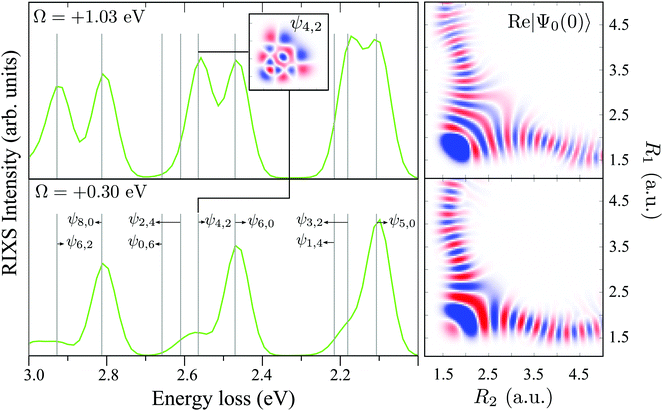
The RIXS at the 4a1 resonance (Fig. 9) shows that the propensity rule, which allows only the ψn,0 to be excited, is valid in the region Ω < 0.6 eV. This rule is violated for higher detuning where one can observe a doubling of the RIXS resonances in the theoretical spectra, and hence the loss of selectivity. The loss of selectivity is also observed in the experimental spectra, however, due to a low signal-to-noise ratio the doubling of peaks is not sharply seen. To shed light on this effect, let us look at Fig. 10, which compares the spectra for Ω = +0.30 and Ω = +1.03 eV. At the lower detuning the intensity of the ψ4,2 vibrational state is strongly suppressed, as it is expected according to the propensity rule. However, this “forbidden” peak arises for the larger detuning. The reason for this is the extension of the wave packet Ψ0(0) along Qs ≈ R2 − R1. In this case, Ψ0(0) becomes more similar to the shape of the ψ4,2 wave function and the intensity of the “forbidden” peak |〈ψ4,2|Ψ0(0)〉|2 increases. The breakdown of the propensity rule for Ω > 0.6 eV is seen in the region ω − ω′ > 2 eV (Fig. 9). Therefore, this shows how the excitation energy constitutes an extra tool to control the previously reported gating effect.40
D. Role of isotopic substitution
To obtain a complete picture of the RIXS spectrum of water, we study here the isotopically substituted water molecules, D2O and HDO. Replacing the hydrogen atom by deuterium leads to a large effect in the vibrational spectrum of RIXS. The effect of the isotopic substitution H2O → D2O is twofold: the vibrational energy spacing is reduced in the RIXS spectrum and the nuclear dynamics becomes slower. The isotopic substitution H2O → HDO, besides changing the vibrational frequencies and the dynamics, also breaks the symmetry of the molecule, resulting in the localization of the vibrational modes on either of the bonds (see, however, Section I and ref. 41). Since the stretching modes are responsible for the main spectral features, the bending mode is fully neglected here for clarity. For the same reason, we omit here the discussion of RIXS via the 2b1 state, where only the bending mode is excited (Fig. 3b). The PESs used to describe the ground and core-excited states of D2O and HDO are the same as for H2O (Fig. 1), since the atomic masses affect mainly the nuclear dynamics. One should mention that different isotopes may couple the electronic potentials slightly via weak vibronic coupling.It is helpful to analyze the ground state vibrational properties of D2O and HDO. The numerical solution of the 2D eigenvalue problem gives the vibrational spectrum (Table 2) and the respective wave functions (Fig. 11). Fig. 11 shows that for HDO, the vibrational wave functions are localized along the bonds R1 (OH) or R2 (DO), due to the breaking of the molecular symmetry. Therefore, in contrast to the ψns,na notation used for H2O and D2O, we assign the localized vibrational states ψnD,nH of HDO using the quantum numbers nD and nH, as well as the group number n = nD + nH. Table 2 also shows the violation of the grouping of the vibrational states of HDO within the group n = nD + nH. For example, at n = 3 the last vibrational level should be the ψ0,3 level (as in H2O and D2O), but the ψ4,0 level is seen instead. The vibrational wave functions of H2O and D2O (Fig. 11) are similar, as the molecular symmetry is preserved upon the isotopic substitution. However, the wave functions of D2O have slightly smaller size since they are localized closer to the PES bottom due to the smaller DO vibrational frequency (ωDO = 0.32 eV and ωOH = 0.45 eV).
| n | N | (ns, na) | H2O | D2O | (nD, nH) | HDO |
|---|---|---|---|---|---|---|
| 1 | 1 | (1,0) | 0.4588 | 0.3361 | (1,0) | 0.3403 |
| 2 | (0,1) | 0.4680 | 0.3450 | (0,1) | 0.4637 | |
| 2 | 3 | (2,0) | 0.9003 | 0.6637 | (2,0) | 0.6678 |
| 4 | (1,1) | 0.9037 | 0.6683 | (1,1) | 0.8034 | |
| 5 | (0,2) | 0.9295 | 0.6853 | (0,2) | 0.9043 | |
| 3 | 6 | (3,0) | 1.3222 | 0.9810 | (3,0) | 0.9837 |
| 7 | (2,1) | 1.3229 | 0.9826 | (2,1) | 1.1303 | |
| 8 | (1,2) | 1.3581 | 1.0025 | (1,2) | 1.2433 | |
| 9 | (0,3) | 1.3763 | 1.0186 | (4,0) | 1.2892 | |
| 4 | 10 | (4,0) | 1.7241 | 1.2875 | (0,3) | 1.3252 |
| 11 | (3,1) | 1.7242 | 1.2878 | (3,1) | 1.4455 | |
| 12 | (2,2) | 1.7769 | 1.3150 | (2,2) | 1.5695 | |
| 13 | (1,3) | 1.7869 | 1.3260 | (5,0) | 1.5846 | |
| 14 | (0,4) | 1.8141 | 1.3461 | (1,3) | 1.6634 | |
| 5 | 15 | (5,0) | 2.1070 | 1.5833 | (0,4) | 1.7274 |
| 16 | (4,1) | 2.1070 | 1.5834 | (4,1) | 1.7504 | |
| 17 | (3,2) | 2.1807 | 1.6214 | (6,0) | 1.8703 | |
| 18 | (2,3) | 2.1841 | 1.6272 | (3,2) | 1.8841 | |
| 19 | (1,4) | 2.2153 | 1.6468 | (2,3) | 1.9888 | |
| 20 | (0,5) | 2.2408 | 1.6675 | (5,1) | 2.0451 | |
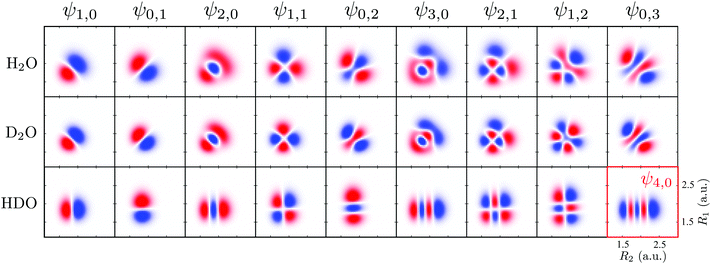 | ||
| Fig. 11 Wave functions of the ground state of H2O, D2O (ψns,na) and HDO (ψnD,nH). In the HDO, R1 represents the O–H bond and R2 the D–O bond. All wave functions are in the same scale. | ||
The XAS of D2O and HDO are presented in Fig. 12a, and a quick comparison with spectrum of H2O (Fig. 3a) does not show significant changes in the spectral profile, except for the slight shift of the XAS maxima:  and
and  for HDO, and
  and
and  for D2O. Considering the excitation energy at the top of absorption resonance (Ω = 0), the RIXS spectra of D2O and HDO at the 4a1 and 2b2 resonances were simulated, and are presented in Fig. 12b along with the RIXS spectrum of H2O for comparison. As expected, the RIXS spectra of H2O and D2O have similar vibrational profiles, but due to the different OH and OD vibrational frequencies, the spectra are shifted, at both 4a1 and 2b2 resonances. However, the HDO RIXS presents a more interesting profile. From Fig. 12b, one can see that for ω − ω′ < 1 eV, the HDO RIXS contains both H2O and D2O resonances, since both OH and OD vibrations are present. Moreover, due to the symmetry breaking, the selection rules discussed in Section IIID are not valid anymore for the HDO molecule. Therefore, transitions to all states are allowed and the number of vibrational resonances in the RIXS spectrum increases (Fig. 13). However, the propensity rule is yet preserved, as observed for ω − ω′ > 1.5 eV. The real part of the core-excited wave packet in the 4a1 and 2b2 states (Fig. 13b) shows that even though the symmetry is broken in HDO and the wave functions are localized in the ground state, the core-excited wave packet is delocalized, as in H2O (Fig. 5c), preserving the propensity rule. A deeper insight into this mode delocalization in core-excited states can be found elsewhere.41
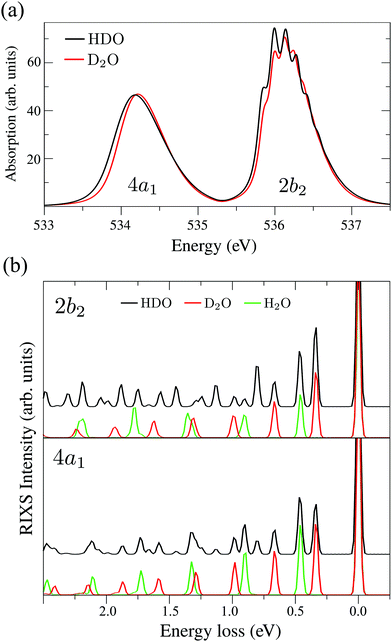 | ||
| Fig. 12 (a) Theoretical X-ray absorption spectra of HDO and D2O. (b) Theoretical RIXS at the 4a1 and 2b2 resonances for H2O, D2O and HDO (Ω2b2 = −0.025 eV and Ω4a1 = +0.05 eV). | ||
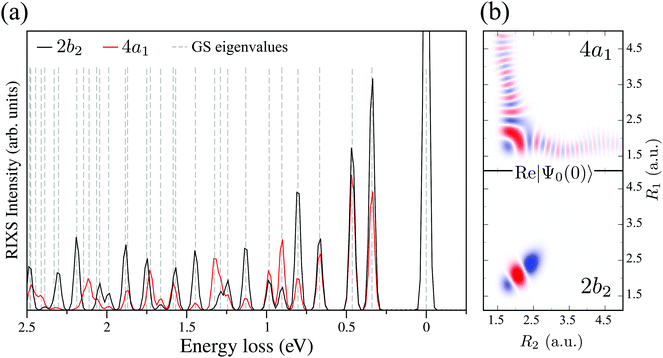 | ||
| Fig. 13 (a) Theoretical HDO RIXS at the 4a1 and 2b2 resonances. The ground state eigenvalues are shown by the dashed lines and their assignment follows the energy order of Table 2. (b) Real part of the core-excited wave packet Ψ0(0) at 4a1 and 2b2 resonances for HDO. | ||
E. “Atomic” peak
Following core excitation at the 4a1 resonance, the ultrafast dissociation of an OH bond of the water molecule is observed. This can be observed from the analysis of the time-dependent core-excited wave packet ψc(t), which propagates far away from the equilibrium during the lifetime of the core-excited state (Fig. 4). The wave packet ψc(t) on the way to the asymptotic region of the dissociation decays continuously to the ground state. The continuum-bound decay near the equilibrium forms the so-called molecular band (5 eV ≳ ω − ω′ ≥ 0, see Fig. 14). When the wave packet approaches the region of dissociation, the dominant process is the continuum–continuum decay, which is nothing else than the decay transitions in the fragment of dissociation ˙OH. These decay transitions form the so-called “atomic” peak,42,43,82 which in the case of the ˙OH fragment has a vibrational structure defined by the OH vibrational frequency. The RIXS spectra at the 4a1 resonance for H2O, D2O and HDO are presented in Fig. 14, with the “atomic” peak shown at around 7.5 eV of energy loss. The “atomic” peak of D2O has a smaller intensity than the H2O and HDO ones. As deuterium is heavier than hydrogen the dissociation D–O⋯D is slower, and a smaller portion of the wave packet reaches the dissociation region during the short core-hole lifetime. The “atomic” peaks of HDO and H2O are comparable, showing only a slightly different structure. This happens because the “atomic” peak of HDO is composed by the H⋯DO and D⋯HO fragmentation.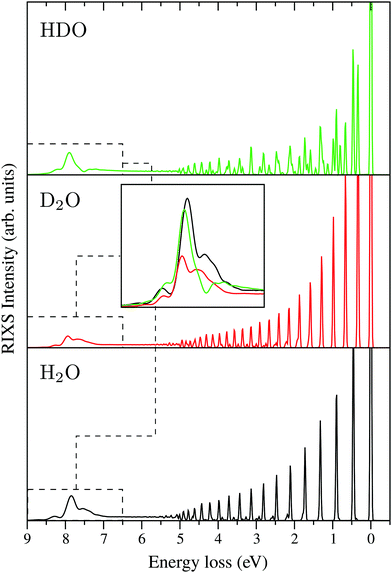 | ||
| Fig. 14 RIXS spectra at the 4a1 resonance for H2O, D2O and HDO, which show the formation of the “atomic” peak at around 7.5 eV. The detuning is the same as used in Fig. 12b. All spectra are given at the same intensity scale. The “atomic” peak exhibits a vibrational structure as it is formed by the emission transition from the core-excited fragment of dissociation ˙OH. | ||
The isotope sensitivity of the “atomic” peak in the presented RIXS spectra sheds light on its dynamical origin. This is important in order to understand the electronically-inelastic scattering spectrum of gas-phase water.83 This peak cannot be isolated in the total experimental RIXS spectrum, due to overlap with the |1b1−14a11〉 final state, which has the same dissociation limit as the ground state. Our simulations, however, can help to understand the recent experimental results,83 where a splitting of the inelastic band of the |1b1−14a11〉 final state is observed and tentatively referred to the nuclear dynamics effect. Our analysis assures that the Ω-dependence of the observed doublet83 is due to the presence of the “atomic” peak which is very sensitive to the dissociation dynamics defined by the scattering duration and mass of OH or OD.
V. Conclusions
Using ultra-high resolution X-ray spectroscopy, state-of-the-art ab initio potential energy surfaces and strict nuclear wave packet propagation calculations, we carried out a complete elucidation of the electronically-elastic RIXS spectra of gas-phase water. Based on an excellent agreement between theory and experiment, several conclusions, of detailed as well as general character, could be drawn. The simulations show rather complicated structures of the vibrational spectrum of the ground state due to strong anharmonicity and strong mode coupling. We demonstrated through a fine analysis of the wave packet dynamics that RIXS offers a simplification of the challenging coupled-mode dynamics problem in H2O since scattering through different core-excited states acts as a filter to probe different vibrational progressions, thus probing different parts of the multi-dimensional ground state PES. Close to the respective top of resonance, RIXS at the 2b1 resonance excites solely the bending vibrational mode, while at the 4a1 resonance mainly the symmetric stretching mode is excited. In RIXS process through the 2b2 core-excited state, the bending mode and a mixture of the two stretching vibrational modes are excited.The nuclear dynamics in the core-excited state plays a key role in the formation of the spectra. The comparatively large propagation distance in the intermediate core-excited state provides a unique opportunity to observe high-energy vibrational states and hence to probe the full PES. We demonstrate also that frequency detuning, and thereby the control of the scattering time duration and the multimode wave packet propagation offers a possibility to manipulate the dynamics within the selected core-excited PES and that it can be used as an additional tool to probe the ground state PES via various vibrational modes.
Isotope substitution significantly changes the RIXS spectra of the water molecule due to the change in vibrational frequency, followed by distinct nuclear wave packet dynamics. The symmetry breaking in the case of HDO is seen via the breakdown of the selection rules caused by the localization of the vibrations. The replacement of hydrogen by the heavier deuterium affects strongly the ultra-fast nuclear dynamics in the core-excited 4a1 dissociative state and changes the relative intensity and the spectral shape of the so-called “atomic” peak. This dynamical effect plays an important role in understanding the inelastic X-ray scattering of water vapor.
Our work demonstrates that RIXS spectroscopy, taking advantage of the high resolution offered by currently available high performance instrumentation, not only allows us to understand the details and dynamics of the X-ray molecular scattering process as such, but also that it possesses an inherent mode selectivity that can reveal new facts about the vibrational structure and potential energy surfaces of the ground state not reachable by other techniques. Although the system studied here, water, is a simple triatomic system, it is yet sufficiently complex to allow us to generalize these conclusions to common polyatomic gas-phase molecules. The deep insight brought by our findings may also have a bearing on interpreting the properties and structure of other phases, i.e. liquid water and ice.
Author contributions
V. V. C. and R. C. C. performed all nuclear dynamics simulations and prepared the text of manuscript and figures; V. V. C. and F. F. G. developed the software and participated in the theoretical analysis and discussion of the results; E. E. and M. O. did all electronic structure calculations; S. E., M. F., M. D., B. K., T. S., A. P. and A. F. suggested and planned the experiment, collected the data and carried out the data analysis; V. K., H. Å. and F. G. took the main responsibility for the theoretical modelling and the writing of the paper, in which all authors contributed. All authors reviewed the manuscript.Acknowledgements
This work was supported by the Swedish Research Council (VR), The Knut and Alice Wallenberg foundation (Grant No. KAW-2013.0020), and the Carl Tryggers foundation (CTS 15:266). V. V. C. and R. C. C. acknowledge the Conselho Nacional de Desenvolvimento Científico e Tecnológico (CNPq-Brazil); F. G. and V. K. acknowledge support within the State contract of the Russian Federation Ministry of Education and Science for Siberian Federal University for scientific research in 2017–2019 (Project 3.2662.2017); M. D. and T. S. would like to acknowledge the funding from the Swiss National Science Foundation within the D-A-CH programme (SNSF Research Grant 200021L 141325). S. E. and A. F. acknowledge funding from the ERC-ADG-2014-Advanced Investigator Grant-No. 669531 EDAX under the Horizon 2020 EU Framework, Programme for Research and Innovation. M. O. and A. F. acknowledge partial funding by the Helmholtz Virtual Institute VI419 “Dynamic Pathways in Multidimensional Landscapes”. The experiments were performed at the ADRESS beam line of the Swiss Light Source at the Paul Scherrer Institute. The calculations were performed on resources provided by the Swedish National Infrastructure for Computing (SNIC).References
- J. Tennyson, N. F. Zobov, R. Williamson, O. L. Polyansky and P. F. Bernath, J. Phys. Chem. Ref. Data, 2001, 30, 735 CrossRef CAS.
- P. F. Bernath, Phys. Chem. Chem. Phys., 2002, 4, 1501–1509 RSC.
- P. Maksyutenko, M. Grechko, T. R. Rizzo and O. V. Boyarkin, Philos. Trans. R. Soc., A, 2012, 370, 2710–2727 CrossRef CAS PubMed.
- L. Lodi and J. Tennyson, J. Phys. B: At., Mol. Opt. Phys., 2010, 43, 133001 CrossRef.
- P. Maksyutenko, J. S. Muenter, N. F. Zobov, S. V. Shirin, O. L. Polyansky, T. R. Rizzo and O. V. Boyarkin, J. Chem. Phys., 2007, 126, 10–14 Search PubMed.
- M. Grechko, O. V. Boyarkin, T. R. Rizzo, P. Maksyutenko, N. F. Zobov, S. V. Shirin, L. Lodi, J. Tennyson, A. G. Császár and O. L. Polyansky, J. Chem. Phys., 2009, 131, 221105 CrossRef PubMed.
- J. Nordgren, L. P. Werme, H. Ågren, C. Nordling and K. Siegbahn, J. Phys. B: At. Mol. Phys., 1975, 8, L18–L19 CrossRef CAS.
- H. Ågren, S. Svensson and U. Wahlgren, Chem. Phys. Lett., 1975, 35, 336–344 CrossRef.
- J. Nordgren and H. Ågren, Comments At. Mol. Phys., 1984, 14, 203 CAS.
- G. Fronzoni, M. Stener, A. Lisini and P. Decleva, Chem. Phys., 1996, 210, 447–459 CrossRef CAS.
- V. Carravetta and H. Ågren, Phys. Rev. A: At., Mol., Opt. Phys., 1987, 35, 1022–1032 CrossRef CAS.
- A. Cesar, H. Ågren and V. Carravetta, Phys. Rev. A: At., Mol., Opt. Phys., 1989, 40, 187–206 CrossRef CAS.
- A. Hiraya, K. Nobusada, M. Simon, K. Okada, T. Tokushima, Y. Senba, H. Yoshida, K. Kamimori, H. Okumura, Y. Shimizu, A.-L. Thomas, P. Millie, I. Koyano and K. Ueda, Phys. Rev. A: At., Mol., Opt. Phys., 2001, 63, 042705 CrossRef.
- I. Hjelte, M. N. Piancastelli, R. F. Fink, O. Björneholm, M. Bässler, R. Feifel, A. Giertz, H. Wang, K. Wiesner, A. Ausmees, C. Miron, S. L. Sorensen and S. Svensson, Chem. Phys. Lett., 2001, 334, 151–158 CrossRef CAS.
- S. Myneni, Y. Luo, L. Å. Näslund, M. Cavalleri, L. Ojamäe, H. Ogasawara, A. Pelmenschikov, P. Wernet, P. Väterlein, C. Heske, Z. Hussain, L. G. M. Pettersson and A. Nilsson, J. Phys.: Condens. Matter, 2002, 14, L213–L219 CrossRef CAS.
- L. Inhester, C. F. Burmeister, G. Groenhof and H. Grubmüller, J. Chem. Phys., 2012, 136, 144304 CrossRef CAS PubMed.
- S. Petretti, A. Saenz, A. Castro and P. Decleva, Chem. Phys., 2013, 414, 45–52 CrossRef CAS.
- F. Gel'mukhanov and H. Ågren, Phys. Rep., 1999, 312, 87–330 CrossRef.
- L. J. P. Ament, M. van Veenendaal, T. P. Devereaux, J. P. Hill and J. van den Brink, Rev. Mod. Phys, 2011, 83, 705–767 CrossRef CAS.
- A. Pietzsch, Y.-P. Sun, F. Hennies, Z. Rinkevicius, T. Karlsson, H. O. Schmitt, V. Strocov, J. Andersson, B. Kennedy, J. Schlappa, A. Föhlisch, J.-E. Rubensson and F. Gel'mukhanov, Phys. Rev. Lett., 2011, 106, 153004 CrossRef CAS PubMed.
- M. Le Tacon, A. Bosak, S. M. Souliou, G. Dellea, T. Loew, R. Heid, K.-P. Bohnen, G. Ghiringhelli, M. Krisch and B. Keimer, Nat. Phys., 2014, 10, 52–58 CrossRef CAS.
- J.-H. Guo, Y. Luo, A. Augustsson, J.-E. Rubensson, C. Såthe, H. Ågren, H. Siegbahn and J. Nordgren, Phys. Rev. Lett., 2002, 89, 137402 CrossRef PubMed.
- S. Kashtanov, A. Augustsson, Y. Luo, J.-H. Guo, C. Såthe, J.-E. Rubensson, H. Siegbahn, J. Nordgren and H. Ågren, Phys. Rev. B: Condens. Matter Mater. Phys., 2004, 69, 24201 CrossRef.
- T. Tokushima, Y. Harada, O. Takahashi, Y. Senba, H. Ohashi, L. G. M. Pettersson, A. Nilsson and S. Shin, Chem. Phys. Lett., 2008, 460, 387–400 CrossRef CAS.
- J. Guo and Y. Luo, J. Electron. Spectrosc. Relat. Phenom., 2010, 177, 181–191 CrossRef CAS.
- A. Pietzsch, F. Hennies, P. S. Miedema, B. Kennedy, J. Schlappa, T. Schmitt, V. N. Strocov and A. Föhlisch, Phys. Rev. Lett., 2015, 114, 088302 CrossRef CAS PubMed.
- M. Odelius, H. Ogasawara, D. Nordlund, O. Fuchs, L. Weinhardt, F. Maier, E. Umbach, C. Heske, Y. Zubavichus, M. Grunze, J. D. Denlinger, L. G. M. Pettersson and A. Nilsson, Phys. Rev. Lett., 2005, 94, 227401 CrossRef PubMed.
- O. Fuchs, M. Zharnikov, L. Weinhardt, M. Blum, M. Weigand, Y. Zubavichus, M. Bär, F. Maier, J. D. Denlinger, C. Heske, M. Grunze and E. Umbach, Phys. Rev. Lett., 2008, 100, 027801 CrossRef CAS PubMed.
- Y. Harada, T. Tokushima, Y. Horikawa, O. Takahashi, H. Niwa, M. Kobayashi, M. Oshima, Y. Senba, H. Ohashi, K. T. Wikfeldt, A. Nilsson, L. G. M. Pettersson and S. Shin, Phys. Rev. Lett., 2013, 111, 1–5 CrossRef PubMed.
- M. Simon, L. Journel, R. Guillemin, W. C. Stolte, I. Minkov, F. Gel'mukhanov, P. Sałek, H. Ågren, S. Carniato, R. Taieb, a. C. Hudson and D. W. Lindle, Phys. Rev. A: At., Mol., Opt. Phys., 2006, 73, 20706 CrossRef.
- F. Hennies, A. Pietzsch, M. Berglund, A. Föhlisch, T. Schmitt, V. Strocov, H. O. Karlsson, J. Andersson and J.-E. Rubensson, Phys. Rev. Lett., 2010, 104, 193002 CrossRef PubMed.
- V. Kimberg, A. Lindblad, J. Söderström, O. Travnikova, C. Nicolas, Y. P. Sun, F. Gel'mukhanov, N. Kosugi and C. Miron, Phys. Rev. X, 2013, 3, 011017 Search PubMed.
- C. Miron, C. Nicolas, O. Travnikova, P. Morin, Y. Sun, F. Gel'mukhanov, N. Kosugi and V. Kimberg, Nat. Phys., 2011, 8, 135–138 CrossRef.
- Q. Miao, O. Travnikova, F. Gel'mukhanov, V. Kimberg, Y.-P. Sun, T. D. Thomas, C. Nicolas, M. Patanen and C. Miron, J. Phys. Chem. Lett., 2015, 6, 1568–1572 CrossRef CAS PubMed.
- X.-J. Liu, Q. Miao, F. Gel'mukhanov, M. Patanen, O. Travnikova, C. Nicolas, H. Ågren, K. Ueda and C. Miron, Nat. Photonics, 2015, 9, 120–125 CrossRef CAS.
- H. Sann, T. Havermeier, C. Mueller, H. K. Kim, F. Trinter, M. Waitz, J. Voigtsberger, F. Sturm, T. Bauer, R. Wallauer, D. Schneider, M. Weller, C. Goihl, J. Tross, K. Cole, J. Wu, M. S. Schoeffler, H. Schmidt-Boecking, T. Jahnke, M. Simon and R. Doerner, Phys. Rev. Lett., 2016, 117, 243002 CrossRef CAS PubMed.
- V. Kimberg, N. Kosugi and F. Gel'mukhanov, J. Chem. Phys., 2009, 130, 114302 CrossRef PubMed.
- J.-C. Liu, C. Nicolas, Y.-P. Sun, R. Flammini, P. O'Keeffe, L. Avaldi, P. Morin, V. Kimberg, N. Kosugi, F. Gel'mukhanov and C. Miron, J. Phys. Chem. B, 2011, 115, 5103–5112 CrossRef CAS PubMed.
- M. Odelius, Phys. Rev. B: Condens. Matter Mater. Phys., 2009, 79, 144204 CrossRef.
- R. C. Couto, V. Vaz da Cruz, E. Ertan, S. Eckert, M. Fondell, M. Dantz, B. O'Cinneide, T. Schmitt, A. Pietzsch, F. F. Guimarães, H. Ågren, F. Gel'mukhanov, M. Odelius, V. Kimberg and A. Föhlisch, Nat. Commun., 2017, 8, 14165 CrossRef CAS PubMed.
- N. Ignatova, V. Vaz da Cruz, R. C. Couto, E. Ertan, A. Zimin, F. F. Guimaraes, S. Polyutov, H. Ågren, V. Kimberg, M. Odelius and F. Gel'mukhanov, Sci. Rep., 2017, 7, 43891 CrossRef PubMed.
- P. Morin and I. Nenner, Phys. Rev. Lett., 1986, 56, 1913–1916 CrossRef CAS PubMed.
- F. Gel'mukhanov and H. Ågren, Phys. Rev. A: At., Mol., Opt. Phys., 1996, 54, 379–393 CrossRef.
- G. Ghiringhelli, A. Piazzalunga, C. Dallera, G. Trezzi, L. Braicovich, T. Schmitt, V. N. Strocov, R. Betemps, L. Patthey, X. Wang and M. Grioni, Rev. Sci. Instrum., 2006, 77, 113108 CrossRef.
- V. N. Strocov, T. Schmitt, U. Flechsig, T. Schmidt, A. Imhof, Q. Chen, J. Raabe, R. Betemps, D. Zimoch, J. Krempasky, X. Wang, M. Grioni, A. Piazzalunga and L. Patthey, J. Synchrotron Radiat., 2010, 17, 631–643 CrossRef CAS PubMed.
- G. Herzberg, Molecular Spectra and Molecular Structure II: Infrared and Raman Spectra of Polyatomic Molecules, Van Nostrand Reinhold, New York, 1945 Search PubMed.
- B. T. Darling and D. M. Dennison, Phys. Rev., 1940, 57, 128–139 CrossRef CAS.
- P. Sałek, A. Baev, F. Gel'mukhanov and H. Ågren, Phys. Chem. Chem. Phys., 2003, 5, 1–11 RSC.
- P. Sałek, Comput. Phys. Commun., 2003, 150, 85–98 CrossRef.
- F. Gel'mukhanov, P. Sałek, T. Privalov and H. Ågren, Phys. Rev. A: At., Mol., Opt. Phys., 1999, 59, 380–389 CrossRef.
- V. C. Felicíssimo, F. F. Guimarães, F. Gel'mukhanov, A. Cesar and H. Ågren, J. Chem. Phys., 2005, 122, 094319 CrossRef PubMed.
- P. Jensen, J. Chem. Soc., Faraday Trans. 2, 1988, 84, 1315–1340 RSC.
- H. Ågren, A. Flores-Riveros, H. Jørgen and A. Jensen, Phys. Scr., 1989, 40, 745–750 CrossRef.
- J. Olsen, P. Jørgensen and J. Simons, Chem. Phys. Lett., 1990, 169, 463–472 CrossRef CAS.
- P.-Å. Malmqvist, A. Rendell and B. O. Roos, J. Phys. Chem., 1990, 94, 5477–5482 CrossRef CAS.
- P.-Å. Malmqvist, K. Pierloot, A. R. M. Shahi, C. J. Cramer and L. Gagliardi, J. Chem. Phys., 2008, 128, 204109 CrossRef PubMed.
- P.-Å. Malmqvist, B. O. Roos and B. Schimmelpfennig, Chem. Phys. Lett., 2002, 357, 230–240 CrossRef CAS.
- P.-Å. Malmqvist and B. O. Roos, Chem. Phys. Lett., 1989, 155, 189–194 CrossRef CAS.
- B. O. Roos, R. Lindh, P.-Å. Malmqvist, V. Veryazov and P. O. Widmark, J. Phys. Chem. A, 2004, 108, 2851–2858 CrossRef CAS.
- B. A. Hess, Phys. Rev. A: At., Mol., Opt. Phys., 1986, 33, 3742–3748 CrossRef CAS.
- M. Douglas and N. M. Kroll, Ann. Phys., 1974, 82, 89–155 CAS.
- B. Schimmelpfenning, AMFI – an atomic mean field integral program, University of Stockholm, Stockholm, Sweden, 1996 Search PubMed.
- M. Rubio, L. Serrano-Andrés and M. Merchán, J. Chem. Phys., 2008, 128, 104305 CrossRef PubMed.
- L. Weinhardt, E. Ertan, M. Iannuzzi, M. Weigand, O. Fuchs, M. Bär, M. Blum, J. D. Denlinger, W. Yang, E. Umbach, M. Odelius and C. Heske, Phys. Chem. Chem. Phys., 2015, 17, 27145–27153 RSC.
- F. Aquilante, J. Autschbach, R. K. Carlson, L. F. Chibotaru, M. G. Delcey, L. De Vico, I. Fdez. Galván, N. Ferré, L. M. Frutos, L. Gagliardi, M. Garavelli, A. Giussani, C. E. Hoyer, G. Li Manni, H. Lischka, D. Ma, P.-Å. Malmqvist, T. Müller, A. Nenov, M. Olivucci, T. B. Pedersen, D. Peng, F. Plasser, B. Pritchard, M. Reiher, I. Rivalta, I. Schapiro, J. Segarra-Mart, M. Stenrup, D. G. Truhlar, L. Ungur, A. Valentini, S. Vancoillie, V. Veryazov, V. P. Vysotskiy, O. Weingart, F. Zapata and R. Lindh, J. Comput. Chem., 2015, 37, 506–541 CrossRef PubMed.
- A. G. Császár, E. Mátyus, T. Szidarovszky, L. Lodi, N. F. Zobov, S. V. Shirin, O. L. Polyansky and J. Tennyson, J. Quant. Spectrosc. Radiat. Transfer, 2010, 111, 1043–1064 CrossRef.
- M. E. Kellman, Annu. Rev. Phys. Chem., 1995, 46, 395–421 CrossRef CAS PubMed.
- D. X. H. Li and H. Guo, J. Chem. Phys., 2004, 121, 4156 CrossRef PubMed.
- B. Brena, D. Nordlund, M. Odelius, H. Ogasawara, A. Nilsson and L. G. M. Pettersson, Phys. Rev. Lett., 2004, 93, 148302 CrossRef CAS PubMed.
- F. F. Guimarães, V. C. Felicíssimo, V. Kimberg, A. Cesar and F. Gel'mukhanov, eSPec wave packet propagation program, Universidade Federal de Minas Gerais (Brazil) and Royal Institute of Technology (Sweden), 2004 Search PubMed.
- F. F. Guimarães, X-ray Spectroscopy of Molecules Driven by Strong Infrared Fields, PhD thesis, School of Biotecnology, KTH-Stockholm, Sweeden, 2006 Search PubMed.
- D. Neuhauser and M. Baer, J. Chem. Phys., 1989, 91, 4651–4657 CrossRef CAS.
- Y.-P. Sun, Spontaneous and stimulated X-ray raman scattering, PhD thesis, KTH, Stockholm, Sweden, 2011 Search PubMed.
- Y.-P. Sun, F. Hennies, A. Pietzsch, B. Kennedy, T. Schmitt, V. N. Strocov, J. Andersson, M. Berglund, J.-E. Rubensson, K. Aidas, F. Gel'mukhanov, M. Odelius and A. Föhlisch, Phys. Rev. B: Condens. Matter Mater. Phys., 2011, 84, 132202 CrossRef.
- J. Stöhr, NEXAFS Spectroscopy, Springer, Berlin, 1992 Search PubMed.
- M. Eroms, O. Vendrell, M. Jungen, H.-D. Meyer and L. S. Cederbaum, J. Chem. Phys., 2009, 130, 154307 CrossRef PubMed.
- S. Schreck, A. Pietzsch, B. Kennedy, C. Såthe, P. S. Miedema, S. Techert, V. N. Strocov, T. Schmitt, F. Hennies, J.-E. Rubensson and A. Föhlisch, Sci. Rep., 2016, 7, 20054 CrossRef PubMed.
- F. Gel'mukhanov, T. Privalov and H. Ågren, Phys. Rev. A: At., Mol., Opt. Phys., 1997, 56, 256–264 CrossRef.
- S. Sundin, F. Kh. Gel'mukhanov, H. Ågren, S. J. Osborne, A. Kikas, O. Björneholm, A. Ausmees and S. Svensson, Phys. Rev. Lett., 1997, 79, 1451–1454 CrossRef CAS.
- F. Gel'mukhanov, T. Privalov and H. Ågren, Phys. Rev. A: At., Mol., Opt. Phys., 1997, 56, 256–264 CrossRef.
- O. L. Polyansky, N. F. Zobov, I. I. Mizus, L. Lodi, S. N. Yurchenko, J. Tennyson, A. G. Császár and O. V. Boyarkin, Philos. Trans. R. Soc., A, 2012, 370, 2728–2748 CrossRef CAS PubMed.
- P. Sałek, V. Carravetta, F. Gel'mukhanov and H. Ågren, J. Chem. Phys., 2002, 116, 629–645 CrossRef.
- L. Weinhardt, A. Benkert, F. Meyer, M. Blum, R. G. Wilks, W. Yang, M. Bar, F. Reinert and C. Heske, J. Chem. Phys., 2012, 136, 144311 CrossRef PubMed.
| This journal is © the Owner Societies 2017 |

