 Open Access Article
Creative Commons Attribution 3.0 Unported Licence
The tetrahedral structure and luminescence properties of Bi-metallic Pt1Ag28(SR)18(PPh3)4 nanocluster†
Xi
Kang
 a,
Meng
Zhou
b,
Shuxin
Wang
 a,
Shan
Jin
 a,
Guodong
Sun
 a,
Manzhou
Zhu
*a and
Rongchao
Jin
 *b
*b
aDepartment of Chemistry and Center for Atomic Engineering of Advanced Materials, Anhui University, Hefei, Anhui 230601, China. E-mail: zmz@ahu.edu.cn
bDepartment of Chemistry, Carnegie Mellon University, Pittsburgh, PA 15213, USA. E-mail: rongchao@andrew.cmu.edu
First published on 5th January 2017
Abstract
The atomic-structure characterization of alloy nanoclusters (NCs) remains challenging but is crucial in order to understand the synergism and develop new applications based upon the distinct properties of alloy NCs. Herein, we report the synthesis and X-ray crystal structure of the Pt1Ag28(S-Adm)18(PPh3)4 nanocluster with a tetrahedral shape. Pt1Ag28 was synthesized by reacting Pt1Ag24(SPhMe2)18 simultaneously with Adm-SH (1-adamantanethiol) and PPh3 ligands. A tetrahedral structure is found in the metal framework of Pt1Ag28 NC and an overall surface shell (Ag16S18P4), as well as discrete Ag4S6P1 motifs. The Pt1Ag12 kernel adopts a face-centered cubic (FCC) arrangement, which is observed for the first time in alloy nanoclusters in contrast to the commonly observed icosahedral structure of homogold and homosilver NCs. The Pt1Ag28 nanocluster exhibits largely enhanced photoluminescence (quantum yield QY = 4.9%, emission centered at ∼672 nm), whereas the starting material (Pt1Ag24 NC) is only weakly luminescent (QY = 0.1%). Insights into the nearly 50-fold enhancement of luminescence were obtained via the analysis of electronic dynamics. This study demonstrates the atomic-level tailoring of the alloy nanocluster properties by controlling the structure.
1 Introduction
Atomically precise metal nanoclusters (NCs) have attracted increasing interest as functional materials due to their distinct optical, catalytic, magnetic, and electrochemical properties.1–7 The well-defined structure of NCs with precise compositions permits atomic level structure–property correlations.8–18 To date, great progress has been achieved in the synthesis and characterization of NCs, including mono-metallic NCs (gold or silver) and alloy NCs.19–26 Among them, bi-metallic NCs may offer significantly enhanced properties compared to that of the single-component NCs due to the synergistic effects induced by the heteroatom(s).20b,21b,22b,23,25a For example, drastically improved catalytic activity and enhanced luminescence (compared with the mono-metallic counterparts of NCs) have been achieved in M–Au (with a single dopant M = Pt or Pd)27,28 and Au–Ag bi-metallic NCs (with Au dopants),21b,22b respectively. These results demonstrate the great potential of alloy NCs in catalytic, optical and biological applications.Thus far, the atomic-level structural determination of bi-metallic NCs by X-ray crystallography has only been achieved in a few cases.11,20a,21b,22–26 The synthetic methods used to prepare bimetallic NCs can be roughly classified into two strategies: (1) the co-reduction of two metal precursors (e.g. complexes) in one-pot reactions7,11,20,21b,22b,24 and (2) doping mono-metallic NCs (which serve as templates) with heteroatom complexes.25a,29–32 For the synthesis of mono-metallic NCs, the thiol etching-induced transformation method is commonly used,19,33 which gives rise to NCs with novel structures and distinct properties. However, this etching strategy has not been applied to the synthesis of alloy NCs. The etching strategy is highly attractive for alloy NCs because the heteroatom(s) can be regarded as labelling atom(s), which provide mechanistic insights into the etching process (similar to the isotope tracing method used in molecular chemistry).
Herein, we report the attainment of Pt1Ag28 nanocluster co-protected by 1-adamantanethiolate (HS-Adm) and triphenyl phosphine (PPh3) ligands, formulated as Pt1Ag28(S-Adm)18(PPh3)4. The Pt1Ag28 nanoclusters are obtained by etching Pt1Ag24(SPhMe2)18 with both the HS-Adm and PPh3 ligands, and the crystal structure of Pt1Ag28 reveals that the Pt atom resides in the central position of the nanocluster. In addition, Pt1Ag28 shows unique structural features including: (1) the presence of a face-centered cubic (FCC) Pt1Ag12 kernel, which is observed for the first time in silver-based alloy NCs, as opposed to the common icosahedral structure, and (2) the discovery of new surface motifs, such as the Ag4(SR)6(PPh3)1 motif and its assembled cage-like structure that protects the FCC kernel. Furthermore, compared to the Pt1Ag24 precursor, the photoluminescence (PL) quantum yield (QY) of Pt1Ag28 is largely increased from 0.1% to 4.9% (i.e. about 50 times of enhancement) due to the suppressed relaxation of the excited state via phonon emission and other non-radiative pathways. Moreover, a significant enhancement in the thermal stability was also achieved in Pt1Ag28 compared to that of the Pt1Ag24 precursor nanocluster.
2 Experimental
Materials
Hexachloroplatinic(IV) acid (H2PtCl6·6H2O, 99.99%, metals basis), silver nitrate (AgNO3, 99%, metals basis), 2,4-dimethylbenzenethiol (HSPhMe2, 99%), 1-adamantanethiol (C10H16S, 99%), triphenylphosphine (PPh3, 99%), tetraphenyl phosphonium bromide (PPh4Br, 98%) and sodium borohydride (NaBH4, 99.9%). Methylene chloride (CH2Cl2, HPLC grade, Aldrich), ethyl acetate (CH3COOC2H5, HPLC, Aldrich), methanol (CH3OH, HPLC, Aldrich) and n-hexane (Hex, HPLC grade, Aldrich). Pure water was purchased from Wahaha Co. Ltd. All reagents were used as received without further purification. All glassware were thoroughly cleaned with aqua regia (HCl![[thin space (1/6-em)]](https://www.rsc.org/images/entities/char_2009.gif) :
:![[thin space (1/6-em)]](https://www.rsc.org/images/entities/char_2009.gif) HNO3 = 3
HNO3 = 3![[thin space (1/6-em)]](https://www.rsc.org/images/entities/char_2009.gif) :
:![[thin space (1/6-em)]](https://www.rsc.org/images/entities/char_2009.gif) 1 vol%), rinsed with copious amounts of pure water and then dried in an oven prior to use.
1 vol%), rinsed with copious amounts of pure water and then dried in an oven prior to use.
Synthesis of the [Pt1Ag24(SPhMe2)18](PPh4)2 nanocluster
For the nanocluster synthesis, AgNO3 (30 mg, 0.18 mmol) was dissolved in 5 mL of CH3OH and 15 mL of CH3COOC2H5. H2PtCl6·6H2O (4 mg, 0.0075 mmol) was dissolved in 5 mL of CH3OH and added to the reaction mixture. The resulting solution was vigorously stirred (about 1200 rpm) with a magnetic stirrer bar for 15 min. Then, 100 μL of HSPhMe2 was added. After another 15 min, 1 mL of NaBH4 aqueous solution (20 mg mL−1) was added quickly to the reaction mixture under vigorous stirring. The reaction was allowed to proceed for 24 hours under a N2 atmosphere. After the reaction was complete, the mixture in the organic phase was rotavaporated under vacuum, and then 20 mL of CH3OH was used to extract the product, which also contained the redundant HSPhMe2 and by-products. 5 mL of a CH3OH solution containing excess PPh4Br was added into the abovementioned CH3OH solution. Subsequently, the resulting solution was centrifuged to obtain the solid. Approximately 15 mL of methanol was added to wash the synthesized nanocluster. The precipitate was then dissolved in CH2Cl2 giving rise to [Pt1Ag24(SPhMe2)18](PPh4)2 nanoclusters (34 mg, 0.006 mmol, yield: 80.5% on a Ag mole basis).Synthesis of Pt1Ag28(S-Adm)18(PPh3)4 nanocluster
For the nanocluster synthesis, 10 mg of (PPh4)2[Pt1Ag24(SPhMe2)18] was dissolved in 10 mL of CH2Cl2. Then, 5 mg of PPh3 and 10 mg of AdmSH were added to the solution simultaneously. The reaction was allowed to proceed for 30 min at room temperature. The colour of solvent transformed from bright green to orange. The organic layer was separated from the precipitate and evaporated to dryness. The Pt1Ag28(S-Adm)18(PPh3)4 nanocluster was obtained afterwards. The dried nanocluster was washed with methanol at least 3 times and collected by centrifugation (7 mg, 0.001 mmol, yield: 63.2% on a Ag mole basis).Characterization
All UV-vis absorption spectra of the nanoclusters dissolved in CH2Cl2 were recorded using an Agilent 8453 diode array spectrometer, whose background correction was made using a CH2Cl2 blank. Solid samples were dissolved in CH2Cl2 to make a dilute solution with its subsequent transformation to a 1 cm path length quartz cuvette, which was followed by the spectral measurements. Thermogravimetric analysis (TGA) was carried out on a thermogravimetric analyzer (DTG-60H, Shimadzu Instruments, Inc.) with 5 mg of nanocluster in a SiO2 pan at a heating rate of 10 K min−1 from room temperature (about 298 K) to 1073 K. X-ray photoelectron spectroscopy (XPS) measurements were performed on a Thermo ESCALAB 250, configured with a monochromated Al Kα (1486.8 eV) 150 W X-ray source, 0.5 mm circular spot size, a flood gun to counter charging effects, and a analysis chamber base pressure lower than 1 × 10⁻⁹ mbar; data were collected at FAT = 20 eV. Photoluminescence spectra were measured on a FL-4500 spectrofluorometer with the same optical density (OD) ∼0.05. In these experiments, the nanocluster solutions were prepared in CH2Cl2 at a concentration of less than 1 mg mL−1. Absolute quantum yields (QY) were measured using dilute solutions of the clusters (0.05 OD absorption at 480 nm) on a HORIBA FluoroMax-4P. Inductively coupled plasma-atomic emission spectrometry (ICP-AES) measurements were performed on an Atomscan Advantage instrument made by Thormo Jarrell Ash Corporation (USA). The nanoclusters were digested with concentrated nitric acid and the concentration of the nanoclusters was set to ∼0.5 mg L−1.Single-crystal growth and analysis
Single crystals of the Pt1Ag28(S-Adm)18(PPh3)4 nanocluster were grown at 4 °C for 2–3 days in CH2Cl2/hexane. Red crystals were collected and the structures of Pt1Ag28(S-Adm)18(PPh3)4 were determined. The data collection for single crystal X-ray diffraction was carried out on a Bruker Smart APEX II CCD diffractometer under a liquid nitrogen flow at 150 K using graphite-monochromatized Cu Kα radiation (λ = 1.54178 Å). Data reductions and absorption corrections were performed using the SAINT and SADABS programs, respectively. The structure was solved using direct methods and refined with full-matrix least squares on F2 using the SHELXTL software package. All non-hydrogen atoms were refined anisotropically, and all the hydrogen atoms were set in geometrically calculated positions and refined isotropically using the riding model.Femto-nanosecond transient absorption spectra
Details of the femtosecond experiments have been described elsewhere.37 Nanosecond transient absorption spectra were measured based on the same ultrafast pump pulses along with an electronically delayed supercontinuum light source with a sub-nanosecond pulse duration (EOS, Ultrafast Systems).Time-correlated single-photon counting
Fluorescence lifetimes were measured using a time-correlated single photon counting (TCSPC) technique (Fluorolog-3 HORIBA Jobin Yvon); a pulsed LED source (376 nm, 1.1 ns) was used as the excitation source. The instrument response function (IRF) of detection was about 1.5 ns.3 Results and discussion
Characterization of the reaction
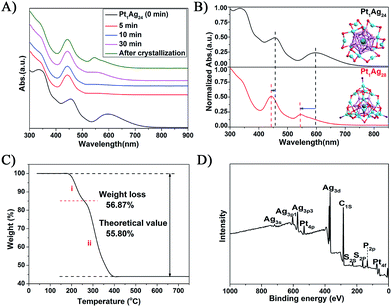
The reaction was monitored via UV-vis spectroscopy (Fig. 1A), in which the spectra show the gradual conversion of Pt1Ag24(SR)18 to Pt1Ag28(S-Adm)18(PPh3)4 when reacting with Adm-SH and PPh3 together as reflected in the spectral changes. For a close comparison, the spectra of Pt1Ag24 and the etching product Pt1Ag28 are shown in Fig. 1B, in which one can see that the 465 and 600 nm absorption bands of Pt1Ag24 are blue-shifted to 445 and 545 nm, respectively, after the conversion. In addition, we tested Adm-SH as the sole etching reagent in this reaction. The product was a mixture of larger nanoclusters as opposed to pure Pt1Ag28 (Fig. S2†).Thermogravimetric analysis (TGA) of the product shows a total weight loss of 56.8 wt% (Fig. 1C), which is consistent with the theoretical loss (55.8 wt%) according to the formula determined via X-ray crystallography (vide infra); it should be noted that the loss of PPh3 ligands accounts for 15.2 wt% and S-Adm ligands for 41.6 wt% (Fig. 1C), which is also consistent with the theoretical losses (14.4 and 41.4 wt%, respectively). The atomic ratio of Pt to Ag was analyzed via inductively coupled plasma (ICP) atomic emission spectroscopy to be Pt/Ag = 3.9/96.1 and also by X-ray photoelectron spectroscopy (XPS) to be Pt/Ag = 3.5/96.5, which are consistent with the expected ratio of Pt/Ag = 3.5/96.5 (see Fig. 1D, S3 and Table S1† for the data and details). Electrospray ionization mass spectrometry (ESI-MS) confirmed the purity of Pt1Ag28 (Fig. S4†), in the results of which only one peak was found (m/z = 3637.67 Da, with z = 2+ and perfectly matched the experimental and simulated isotope patterns of [Pt1Ag28(SR)18(PPh3)4]2+).
Atomic structure
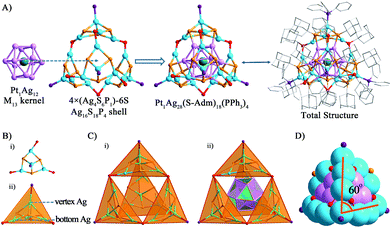
The structure of Pt1Ag28 can be divided into two parts, the kernel and the surface shell. By comparing the crystal structures of the Pt1Ag24 and Pt1Ag28 nanoclusters, we identified that the six Ag2S3 (–R groups omitted) staple motifs surrounding the Pt1Ag12 kernel in the Pt1Ag24 nanocluster change to the four Ag4S6P1 motifs sharing six S atoms, forming an overall Ag16S18P4 shell in a tetrahedral shape with the 4 motifs at the 4 vertices of tetrahedron (Fig. 2). As for the kernel structure, the icosahedral Pt1Ag12 kernel of Pt1Ag24 was converted into an FCC kernel (vide infra). The single Pt atom is surrounded by an Ag12 shell to form the Pt1Ag12 kernel. The Pt1Ag12 kernel was further encircled by an integrated Ag16S18P4 cage-like exterior shell. Thus, the entire structure shows a tri-stratified arrangement—Pt(center)@Ag12(shell)@Ag16S18P4 (exterior). The bond lengths and bond angles are given in the ESI (Table S2†).For a better view, the overall Ag16S18P4 shell was dissected into four equivalent Ag4S6P1 motifs sharing six S atoms. The six S atoms in each Ag4S6P1 motif are divided into two forms (Fig. 2A and B): (1) the three S atoms (in red, vertically linking to the Ag atoms) bond to the Ag atoms in the kernel–shell (3 × 4 = 12Ag atoms in the M13 kernel), which can be regarded as the bridges between the kernel and motif outside. The total 12S atoms stabilize the M13 kernel in the overall structure; (2) the other three S atoms (in orange, connecting the bottom Ag atoms) act as linkers to connect two nearby Ag4S6P1 motifs to form the integrated motif shell—Ag16S18P4. Interestingly, the P atom and three bottom S atoms in each Ag4S6P1 motif constitute a tetrahedral structure. The overall Ag16S18P4 shell consists of four Ag4S6P1 tetrahedral motifs (Fig. 2C), and the integrated configuration is also approximately a tetrahedron. The overall metal framework of Pt1Ag28 (Fig. 2D) also adopts a tetrahedral shape, which is constructed by six 4-atom-long edges (Ag atoms from the shell) and four faces of Ag3 (Ag atoms from the kernel). In addition, the angle between the edges is approximately 60° (Fig. 2D), which is consistent with the standard tetrahedral structure.
As to the structure of the Pt1Ag12 kernel, the icosahedral kernel of Pt1Ag24 was transformed to the FCC arrangement in Pt1Ag28 after the etching process. To the best of our knowledge, all the previously reported M13 (M = Au/Ag/Pt) kernels are icosahedral, and thus the FCC arrangement in the M13 kernel was observed for the first time in an alloy NC. Based on the well-defined structure of Pt1Ag24 and Pt1Ag28, we propose a plausible mechanism for the transformation process. As shown in Fig. 3, the Pt1Ag12 kernel of Pt1Ag24 is in an icosahedral arrangement by the triangular shape of each face. When etched with Adm-SH and PPh3 ligands, the relative positions of the Ag atoms on the kernel's surface shift, and consequently the bonds of the Pt1Ag12 kernel in Pt1Ag24 (i.e. bonds i–iii in Fig. 3A, 2.960–2.991 Å) stretch to ∼3.610 Å, indicating that the Ag–Ag bonds were broken. Simultaneously, the angle α enlarges from 73.6° to 84.7°. Thus, some of the triangular faces in the kernel of Pt1Ag24 are re-arranged into a quadrilateral in Pt1Ag28 and the kernel is thus converted from an icosahedral to FCC arrangement. Furthermore, the slight distortion of the Pt1Ag12 kernel in Pt1Ag28 compared to the typical FCC M13 kernel (Fig. 3C) was caused by the interaction between the kernel and the outside motifs.
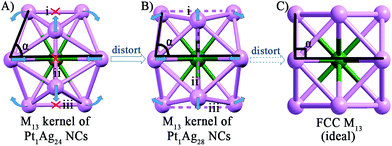 | ||
| Fig. 3 The Pt1Ag12 kernels of the (A) Pt1Ag24 and (B) Pt1Ag28 NCs. (C) The standard FCC M13 kernel. Color codes: green sphere, Pt; violet sphere, Ag. | ||
As mentioned earlier, the heteroatom(s) can be used as labeling atom(s) to shed light on the mechanism of the structural transformation. In this study, the central position of the Pt atom (as the only heteroatom) was retained during the etching process. This phenomenon indicates that the M13 kernel of Pt1Ag24 does not fall apart in the etching process and instead it just becomes distorted in response to the transformation of the exterior motifs. On the other hand, the stability of the central Pt atom was also established in the Pt1Ag24 and Pt1Au24 cases using density functional theory (DFT) calculations and experimental studies.20b,28
Recently, an Ag29 NC co-protected with BDT (1,3-benzenedithiol) and PPh3 ligands as well as a single Au doped Au1Ag28 NC have been reported by Bakr and co-workers.22 In the present study, we discovered that the framework of Pt1Ag28 was largely different from Ag29 and Au1Ag28, albeit all of them have the same metal atom number (i.e. 29). The distinct differences in Pt1Ag28 compared to the other two examples are manifested in the following (see Fig. S5–8†): (1) the kernels of Ag29 and its Au-doped alloy are an icosahedral M13, whereas Pt1Ag28 possesses an FCC Pt1Ag12 kernel; (2) the motifs on the nanocluster surface are also entirely different; the Ag29 (or Au1Ag28) NC possesses four Ag1S3P1 and four Ag3S3 motifs (carbon tails omitted), whereas the Pt1Ag28 is comprised of four new Ag4S6P1 motifs. By sharing six thiolates, the four Ag4S6P1 motifs form a cage-like Ag16S18P4 structure; (3) in the Pt1Ag28 nanocluster, all the metal atoms are located within the tetrahedron constructed via the four P atoms, while in Ag29 and Au1Ag28, 12Ag atoms out of the 29 metal atoms overflow the corresponding tetrahedron (i.e., only 17 atoms are completely contained in the tetrahedron). In addition, it should be noted that tetrahedron-shaped Au NCs have been studied previously34 and our study fills in the blank in tetrahedral Ag NCs; (4) several smaller tetrahedral units were found in Pt1Ag28, such as the Ag4S6P1 motifs, the assembled motif structure and the overall metal nanocluster structure; however, such tetrahedrons are not observed in the Ag29 and Au1Ag28 NCs; (5) a charge state of −3 was reported for Ag29 and Au1Ag28 with an electron count of 8e (that is, 29 − 24 + 3 = 8e). In Pt1Ag28, ESI-MS (Fig. S4†) identified that the cluster bears 2+ charges (not 3− in Ag29 and Au1Ag28), but the X-ray crystallographic analysis did not find any counter ion (presumably Cl− disordered in the crystal). Taking the results together, the nominal electron count of Pt1Ag28 is 8e (that is, 28 − 18 − 2 = 8e).
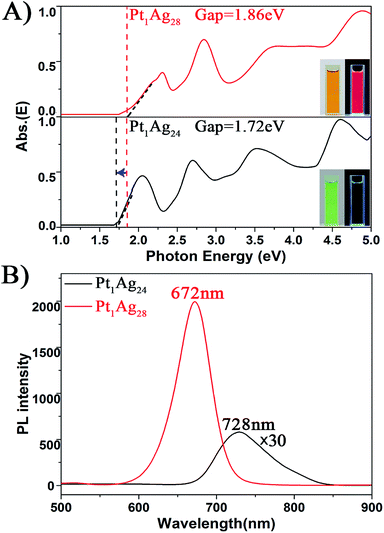 | ||
| Fig. 4 The spectra on the (A) energy scale and (B) PL of the Pt1Ag24 and Pt1Ag28 NCs. Insets of (A): digital photographs of each nanocluster in CH2Cl2 solution under visible and UV light. | ||
With respect to the PL properties (Fig. 4B), the QY of Pt1Ag24 is very low (0.1%),20b but interestingly the QY is largely increased to 4.9% in Pt1Ag28 (by about a 50-fold enhancement). The PL of Pt1Ag28 is strong enough to be perceived by the naked eye. In addition, the PL peak of Pt1Ag24 was centered at 728 nm but it blue-shifts to 672 nm in Pt1Ag28 (a shift of ca. 56 nm). The PL excitation spectrum of Pt1Ag28 was also measured, which is almost identical to its absorption spectrum (Fig. S9†), indicating typical quantum confinement behavior and electron relaxation to the LUMO level before fluorescing.
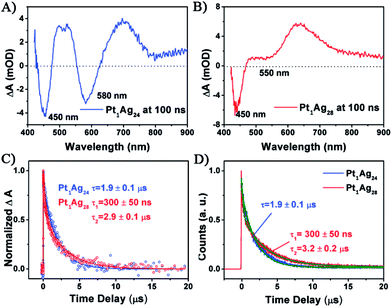
For Pt1Ag24, the kinetic traces can be well fitted by a single exponential decay with a time constant of 1.9 μs, whereas for Pt1Ag28, two exponential decays (300 ns, 2.9 μs) were required to obtain the best fitting quality. Further femtosecond transient absorption measurements were performed, and the ultrafast relaxation dynamics for both clusters indeed exhibited similar behavior, which contain an ultrafast and a long lived decay (Fig. S10†). The fluorescence decays measured using time-correlated single-photon counting (TCSPC) exhibit lifetimes similar to that obtained from ns-TA measurements (cf.Fig. 5C and D), which suggests that the decay components in Pt1Ag24 and Pt1Ag28 clusters are all radiative.
The long-lived decay in silver nanoclusters has been ascribed to ligand to metal charge transfer (LMCT) but the origin of which is not fully understood.21b,22b,35–37 As the crystal structures of Pt1Ag24 and Pt1Ag28 are different, it would be helpful to compare the excited state behavior between the homosilver Ag25 and Ag29 nanoclusters with their Pt doped counterparts, which have similar structures.21a,22a,38 Table S3† lists the excited state lifetimes of Ag25 and Ag29 from the literature together with those of Pt1Ag24 and Pt1Ag28 obtained in this study. Both Ag25 and Ag29 have relatively low fluorescence (QYs < 1%).21a,22a From Ag25 to Pt1Ag24, the lifetime slightly increases from 1.1 μs (ref. 21b) to 1.9 μs, whereas from Ag29 to Pt1Ag28 the lifetime increases from 300 ns (ref. 22b) to dual lifetimes (300 ns and 3.3 μs). The more drastic change in lifetime from Ag29 to Pt1Ag28 suggests that the electronic structure is more strongly modified in the case of Pt1Ag28, which may enhance the LMCT and lead to a higher fluorescence quantum yield. Moreover, prominent coherent oscillations were observed in the femtosecond kinetic traces of Pt1Ag24, whereas no such phenomenon was observed for Pt1Ag28 (Fig. S11†). The stronger phonon emission observed in Pt1Ag24 suggests that more excited-state energy is dissipated into the environment through heat, which also explains its weaker luminescence than that of Pt1Ag28.
Thermal stability
In addition to the PL properties, we further investigated the stability of Pt1Ag24 and its etching product, Pt1Ag28 (Fig. 6). The stability of these NCs was tested at 50 °C in air (NCs dissolved in CHCl3). As to Pt1Ag28, the UV-vis spectra were essentially unchanged over time (12 hours tested), which indicates its high stability, whereas the UV-vis spectra of Pt1Ag24 significantly decrease in intensity after two hours and completely disappear in approximately six hours. The higher thermal stability of Pt1Ag28 than that of Pt1Ag24 was ascribed to the more robust tetrahedral structure than the icosahedral one of Pt1Ag24.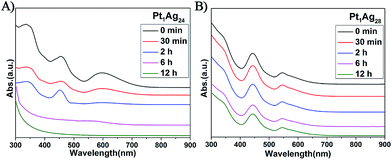 | ||
| Fig. 6 UV/Vis spectra confirming the thermal stability at 50 °C of the (A) Pt1Ag24 and (B) Pt1Ag28 NCs over time. | ||
The stability of Pt1Ag24 and Pt1Ag28 was also characterized via TGA measurements. As depicted in Fig. S12b and d,† the maximum weight loss temperature of Pt1Ag24 was 240 °C (i.e. the derivative curve), which was much lower than that of Pt1Ag28 (310 °C). It should be noted that the 220 °C peak in Pt1Ag28 corresponds to the loss of PPh3 ligands, which are easier to lose compared to the thiolate ligands. Bakr and co-workers reported that the lack of PPh3 ligands did not alter the overall configuration of Ag29 and Au1Au28.22 Thus, we suspect that the configuration of Pt1Ag28 was maintained at this stage. These results indicate higher stability of Pt1Ag28 compared to that of Pt1Ag24.
4 Conclusion
In summary, we devised an etching method for the conversion of Pt1Ag24(SPhMe2)18 to Pt1Ag28(S-Adm)18(PPh3)4 in the presence of Adm-SH and PPh3. The central Pt atom is retained in the conversion process; however, the Pt1Ag12 kernel was converted from an icosahedron to FCC arrangement, which is observed for the first time in the M13 kernel of alloy NCs. Multiple tetrahedral motifs were identified in the alloy NC, such as the Ag4S6P1 surface motif, the integrated motif shell Ag16S18P4, and the overall metal framework. The PL QY is significantly increased from only 0.1% for Pt1Ag24 to 4.9% for Pt1Ag28 (about a 50-fold enhancement). The ultrafast dynamics results reveal that the enhanced luminescence of Pt1Ag28 was due to the suppressed phonon emission and other non-radiative pathways in the tetrahedral structure. In addition, the thermal stability of Pt1Ag28 was drastically enhanced compared to that of its precursor, Pt1Ag24. It is hoped that this study will help stimulate the future discovery of new alloy NCs with tailored functionalities for wide applications in sensing and energy fields.Acknowledgements
M. Z. acknowledges the financial support provided by the NSFC (21372006, U1532141 & 21631001), the Ministry of Education, the Education Department of Anhui Province and 211 Project of Anhui University. R. J. acknowledges the financial support obtained from the U.S. Air Force Office of Scientific Research (AFOSR) under the AFOSR Award No. FA9550-15-1-9999 (FA9550-15-1-0154) and the Camille Dreyfus Teacher-Scholar Awards Program.Notes and references
- R. Jin, C. Zeng, M. Zhou and Y. Chen, Chem. Rev., 2016, 116, 10346 CrossRef CAS PubMed.
- K. L. Dimuthu, M. Weerawardene and C. M. Aikens, J. Am. Chem. Soc., 2016, 138, 11202 CrossRef PubMed.
- C. P. Joshi, M. S. Bootharaju and O. M. Bakr, J. Phys. Chem. Lett., 2015, 6, 3023 CrossRef CAS PubMed.
- S. Yanazoe, K. Koyasu and T. Tsukuda, Acc. Chem. Res., 2014, 47, 816 CrossRef PubMed.
- N. Goswami, Q. Yao, Z. Luo, J. Li, T. Chen and J. Xie, J. Phys. Chem. Lett., 2016, 7, 962 CrossRef CAS PubMed.
- A. Mathew and T. Pradeep, Part. Part. Syst. Charact., 2014, 31, 1017 CrossRef CAS.
- W. Kurashige, Y. Niihori, S. Sharma and Y. Negishi, J. Phys. Chem. Lett., 2014, 5, 4134 CrossRef CAS PubMed.
- W. W. Xu, Y. Gao and X. C. Zeng, Sci. Adv., 2015, 1, e1400211 Search PubMed.
- S. Yamazoe, S. Takano, W. Kurashige, T. Yokoyama, K. Nitta, Y. Negishi and T. Tsukuda, Nat. Commun., 2016, 7, 10414 CrossRef CAS PubMed.
- S. Tian, Y.-Z. Li, M.-B. Li, J. Yuan, J. Yang, Z. Wu and R. Jin, Nat. Commun., 2015, 6, 8667 CrossRef CAS PubMed.
- S. Wang, S. Jin, S. Yang, S. Chen, Y. Song, J. Zhang and M. Zhu, Sci. Adv., 2015, 1, e1500441 Search PubMed.
- H. –C. Weissker, H. B. Escobar, V. D. Thanthirige, K. Kwak, D. Lee, G. Ramakrishna, R. L. Whetten and X. Lopez-Lozano, Nat. Commun., 2014, 5, 3785 Search PubMed.
- O. Lopez-Acevedo, K. A. Kacprzak, J. Akola and H. Häkkinen, Nat. Chem., 2010, 2, 329 CrossRef CAS PubMed.
- M. Azubel, J. Koivisto, S. Malola, D. Bushnell, G. L. Hura, A. L. Koh, H. Tsunoyama, T. Tsukuda, M. Pettersson, H. Häkkinen and R. D. Kornberg, Science, 2014, 345, 909 CrossRef CAS PubMed.
- G. Li, H. Abroshan, Y. Chen, R. Jin and H. J. Kim, J. Am. Chem. Soc., 2015, 137, 14295 CrossRef CAS PubMed.
- K. Kwak, Q. Tang, M. Kim, D. –E. Jiang and D. Lee, J. Am. Chem. Soc., 2015, 137, 10833 CrossRef CAS PubMed.
- X.-D. Zhang, Z. Luo, J. Chen, X. Shen, S. Song, Y. Sun, S. Fan, F. Fan, D. T. Leong and J. Xie, Adv. Mater., 2014, 26, 4565 CrossRef CAS PubMed.
- Y. Zhu, H. Qian, M. Zhu and R. Jin, Adv. Mater., 2010, 22, 1915 CrossRef CAS PubMed.
- (a) C. Zeng, Y. Chen, C. Liu, K. Nobusada, N. L. Rosi and R. Jin, Sci. Adv., 2015, 1, e1500425 Search PubMed; (b) C. Zeng, Y. Chen, K. Iida, K. Nobusada, K. Kirschbaum, K. J. Lambright and R. Jin, J. Am. Chem. Soc., 2016, 138, 3950 CrossRef CAS PubMed; (c) T. Higaki, C. Liu, C. Zeng, R. Jin, Y. Chen, N. L. Rosi and R. Jin, Angew. Chem., Int. Ed., 2016, 55, 6694 CrossRef CAS PubMed.
- (a) H. Yang, Y. Wang, H. Huang, L. Gell, L. Lehtovaara, S. Malola, H. Häkkinen and N. Zheng, Nat. Commun., 2013, 4, 2422 Search PubMed; (b) J. Yan, H. Su, H. Yang, S. Malola, S. Lin, H. Häkkinen and N. Zheng, J. Am. Chem. Soc., 2015, 137, 11880 CrossRef CAS PubMed.
- (a) C. P. Joshi, M. S. Bootharaju, M. J. Alhilaly and O. M. Bakr, J. Am. Chem. Soc., 2015, 137, 11578 CrossRef CAS PubMed; (b) M. S. Bootharaju, C. P. Joshi, M. R. Parida, O. F. Mohammed and O. M. Bakr, Angew. Chem., Int. Ed., 2016, 55, 922 CrossRef CAS PubMed.
- (a) L. G. AbdulHalim, M. S. Bootharaju, Q. Tang, S. D. Gobbo, R. G. AbdulHalim, M. Eddaoudi, D. –E. Jiang and O. M. Bakr, J. Am. Chem. Soc., 2015, 137, 11970 CrossRef CAS PubMed; (b) G. Soldan, M. A. Aljuhani, M. S. Bootharaju, L. G. AbdulHalim, M. R. Parida, A. –H. Emwas, O. F. Mohammed and O. M. Bakr, Angew. Chem., Int. Ed., 2016, 55, 5749 CrossRef CAS PubMed.
- Z. Lei, X. –Y. Pei, Z. –G. Jiang and Q. –M. Wang, Angew. Chem., Int. Ed., 2014, 53, 12771 CrossRef CAS PubMed.
- Y. Wang, X. –K. Wan, L. Ren, H. Su, G. Li, S. Malola, S. Lin, Z. Tang, H. Häkkinen, B. K. Teo, Q. –M. Wang and N. Zheng, J. Am. Chem. Soc., 2016, 138, 3278 CrossRef CAS PubMed.
- (a) S. Wang, X. Meng, A. Das, T. Li, Y. Song, T. Cao, X. Zhu, M. Zhu and R. Jin, Angew. Chem., Int. Ed., 2014, 53, 2376 CrossRef CAS PubMed; (b) X. Kang, S. Wang, Y. Song, S. Jin, G. Sun, H. Yu and M. Zhu, Angew. Chem., Int. Ed., 2016, 55, 3611 CrossRef CAS PubMed; (c) X. Kang, L. Xiong, S. Wang, H. Yu, S. Jin, Y. Song, T. Chen, L. Zheng, C. Pan, Y. Pei and M. Zhu, Chem.–Eur. J., 2016, 22, 17145 CrossRef CAS PubMed.
- (a) C. Kumara, C. M. Aikens and A. Dass, J. Phys. Chem. Lett., 2014, 5, 461 CrossRef CAS PubMed; (b) C. Kumara, K. J. Gagnon and A. Dass, J. Phys. Chem. Lett., 2015, 6, 1223 CrossRef CAS PubMed.
- S. Xie, H. Tsunoyama, W. Kurashige, Y. Negishi and T. Tsukuda, ACS Catal., 2012, 2, 1519 CrossRef CAS.
- H. Qian, D. –E. Jiang, G. Li, C. Gayathri, A. Das, R. R. Gil and R. Jin, J. Am. Chem. Soc., 2012, 134, 16159 CrossRef CAS PubMed.
- T. Udayabhaskararao, Y. Sun, N. Goswami, S. K. Pal, K. Balasubramanian and T. Pradeep, Angew. Chem., Int. Ed., 2012, 51, 2155 CrossRef CAS PubMed.
- (a) C. Yao, J. Chen, M. –B. Li, L. Liu, J. Yang and Z. Wu, Nano Lett., 2015, 15, 1281 CrossRef CAS PubMed; (b) L. Liao, S. Zhou, Y. Dai, L. Liu, C. Yao, C. Fu, J. Yang and Z. Wu, J. Am. Chem. Soc., 2015, 137, 9511 CrossRef CAS PubMed.
- M. A. Tofanelli, T. W. Ni, B. D. Phillips and C. J. Ackerson, Inorg. Chem., 2016, 55, 999 CrossRef CAS PubMed.
- S. Wang, Y. Song, S. Jin, X. Liu, J. Zhang, Y. Pei, X. Meng, M. Chen, P. Li and M. Zhu, J. Am. Chem. Soc., 2015, 137, 4018 CrossRef CAS PubMed.
- (a) C. Zeng, T. Li, A. Das, N. L. Rosi and R. Jin, J. Am. Chem. Soc., 2013, 135, 10011 CrossRef CAS PubMed; (b) C. Zeng, H. Qian, T. Li, G. Li, N. L. Rosi, B. Yoon, R. N. Barnett, R. L. Whetten, U. Landman and R. Jin, Angew. Chem., Int. Ed., 2012, 51, 13114 CrossRef CAS PubMed.
- (a) C. Zeng, H. Qian, T. Li, G. Li, N. L. Rosi, B. Yoon, R. N. Barnett, R. L. Whetten, U. Landman and R. Jin, Angew. Chem., Int. Ed., 2012, 51, 13114 CrossRef CAS PubMed; (b) J. Li, X. Li, H.-J. Zhai and L.-S. Wang, Science, 2003, 299, 864 CrossRef CAS PubMed; (c) W. Huang, S. Bulusu, R. Pal, X. C. Zeng and L.-S. Wang, ACS Nano, 2009, 3, 1225 CrossRef CAS PubMed.
- M. Pelton, Y. Tang, O. M. Bakr and F. Stellacci, J. Am. Chem. Soc., 2012, 134, 11856 CrossRef CAS PubMed.
- M. Zhou, J. Zhong, S. Wang, Q. Guo, M. Zhu, Y. Pei and A. Xia, J. Phys. Chem. C, 2015, 119, 18790 CAS.
- M. Zhou, H. Qian, M. Y. Sfeir, K. Nobusada and R. Jin, Nanoscale, 2016, 8, 7163 RSC.
- S. M. Aly, L. G. AbdulHalim, T. M. D. Besong, G. Soldan, O. M. Bakr and O. F. Mohammed, Nanoscale, 2016, 8, 5412 RSC.
Footnote |
| † Electronic supplementary information (ESI) available. CCDC 1495551. For ESI and crystallographic data in CIF or other electronic format see DOI: 10.1039/c6sc05104a |
| This journal is © The Royal Society of Chemistry 2017 |

