
 Open Access Article
 This Open Access Article is licensed under a
 Creative Commons Attribution 3.0 Unported Licence
Spin-crossover and high-spin iron(II) complexes as chemical shift 19F magnetic resonance thermometers†
Agnes E.
Thorarinsdottir
,
Alexandra I.
Gaudette
and
T. David
Harris
*
Department of Chemistry, Northwestern University, 2145 Sheridan Road, Evanston, IL 60208-3113, USA. E-mail: dharris@northwestern.edu
First published on 6th January 2017
Abstract
The potential utility of paramagnetic transition metal complexes as chemical shift 19F magnetic resonance (MR) thermometers is demonstrated. Further, spin-crossover FeII complexes are shown to provide much higher temperature sensitivity than do the high-spin analogues, owing to the variation of spin state with temperature in the former complexes. This approach is illustrated through a series of FeII complexes supported by symmetrically and asymmetrically substituted 1,4,7-triazacyclononane ligand scaffolds bearing 3-fluoro-2-picolyl derivatives as pendent groups (Lx). Variable-temperature magnetic susceptibility measurements, in conjunction with UV-vis and NMR data, show thermally-induced spin-crossover for [Fe(L1)]2+ in H2O, with T1/2 = 52(1) °C. Conversely, [Fe(L2)]2+ remains high-spin in the temperature range 4–61 °C. Variable-temperature 19F NMR spectra reveal the chemical shifts of the complexes to exhibit a linear temperature dependence, with the two peaks of the spin-crossover complex providing temperature sensitivities of +0.52(1) and +0.45(1) ppm per °C in H2O. These values represent more than two-fold higher sensitivity than that afforded by the high-spin analogue, and ca. 40-fold higher sensitivity than diamagnetic perfluorocarbon-based thermometers. Finally, these complexes exhibit excellent stability in a physiological environment, as evidenced by 19F NMR spectra collected in fetal bovine serum.
Introduction
The noninvasive measurement of temperature in vivo represents a growing area of research, largely due to its utility in medical applications such as low-temperature hyperthermia,1,2 high-temperature thermal ablation,1,2 and the treatment of heart arrhythmias.3 Here, thermometry may be used to discriminate normal from abnormal tissue, and also to ensure that thermal treatments are localized to prevent damage to healthy tissue.1,2,4 Magnetic resonance spectroscopy (MRS) and imaging (MRI) are particularly well-suited toward this end, owing to their use of non-ionizing radiation and ability to deeply penetrate tissue.1,5 Indeed, a number of temperature-sensitive MR parameters of water, including T1 and T2 relaxation times, proton resonance frequency (PRF), diffusion coefficient, and proton density, can be used to monitor tissue temperature.1,4,6 Currently, methods based on water PRF shift are the most widely used for imaging temperature in clinical studies due to their high-resolution and independence on tissue type.7 However, these techniques suffer from a low temperature sensitivity of ca. −0.01 ppm per °C, and their ability to accurately determine absolute temperature is limited.1,7,8In order to overcome sensitivity limitations, paramagnetic lanthanide9 and transition metal complexes10 that function as MRS probes have been developed for thermometry. These complexes feature paramagnetically shifted proton resonances, thus minimizing the interference from background signal in biological tissue. In particular, proton resonances of Tm3+, Tb3+, Dy3+ and Yb3+ complexes have been shown to exhibit temperature sensitivities of up to 1.8 ppm per °C,9q and have been employed for temperature mapping in vitro and in vivo.9 Additionally, transition metal MRS probes have been shown to exhibit similar sensitivity10 and may alleviate toxicity concerns associated with lanthanides.11
While paramagnetic MRS probes offer significant improvements in sensitivity over PRF thermometry, they are nevertheless limited to the inherent Curie temperature dependence of chemical shift in paramagnetic compounds.12 Alternatively, one can employ a strategy of tuning a physical parameter that itself depends on temperature and governs chemical shift. Since both contact (through-bond) and dipolar (through-space) hyperfine shift scale as S(S + 1), where S represents the electronic spin state, variation of S as a function of temperature can result in dramatic changes in chemical shift.12 As such, an ideal temperature-responsive chemical shift probe might feature a value of S that changes with temperature. Spin-crossover FeII complexes that undergo a thermally-induced electronic spin transition from a low-spin, S = 0 ground state to a high-spin, S = 2 excited state satisfy just such a criterion. Moreover, the ligand field in spin-crossover complexes can be chemically modulated to precisely tune the crossover temperature (T1/2), defined as the temperature at which the low-spin and high-spin states are equally populated,13 to near 37 °C. Indeed, the utility of spin-crossover in MR thermometry has been demonstrated through  modulation in FeII-based nanoparticles14 and through paramagnetic chemical exchange saturation transfer (PARACEST) in molecular FeII complexes.15
While the vast majority of MRS thermometry probes exploit changes in the chemical shift of 1H NMR resonances, the employment of 19F MR offers several key advantages. First, the 19F nucleus features a 100% natural abundance, a nuclear spin of I = 1/2, and a gyromagnetic ratio and sensitivity close to that of 1H.16 Moreover, the near absence of endogenous fluorine signals in the body, the large spectral window of 19F resonances, and the remarkable sensitivity of 19F chemical shift to the local environment, give rise to NMR spectra with minimal peak overlap.17 Indeed, it has been demonstrated that 19F chemical shifts of transition metal porphyrin complexes are highly sensitive to their solution electronic structure, in particular to oxidation state and spin state.18 In addition, lanthanide-based 19F chemical shift probes for monitoring pH have been reported.19 However, despite the potential of S as a tunable parameter to increase the temperature sensitivity of 19F MR chemical shift, to our knowledge no paramagnetic 19F MR thermometers have been reported. In fact, diamagnetic perfluorocarbons represent the only examples of 19F MR thermometry, but the application of these compounds is limited by the small temperature dependence of their 19F chemical shifts that affords a maximum sensitivity of only 0.012 ppm per °C.20
Given the advantages of 19F over 1H MR, in conjunction with the temperature sensitivity of 1H MR chemical shifts of our previously reported spin-crossover FeII PARACEST probes15 and the high-spin FeII 1H MR shift probes reported by Morrow and coworkers,10 we sought to develop fluorine-substituted spin-crossover and high-spin FeII complexes for chemical shift 19F MR thermometry. Herein, we report a series of complexes that feature new symmetrically and asymmetrically-substituted 1,4,7-triazacyclononane (tacn) derivatives with fluorinated 2-picolyl donors. The potential utility of spin-crossover and high-spin FeII complexes as chemical shift 19F MR thermometers is demonstrated through detailed analysis of their temperature-dependent spectroscopic and magnetic properties. Furthermore, these compounds exhibit excellent stability in a physiological environment, as revealed by variable-temperature 19F NMR spectra recorded in fetal bovine serum (FBS). To our knowledge, this work provides the first examples of paramagnetic chemical shift 19F MR thermometers.
Results and discussion
Syntheses and structures
With the goal to prepare air- and water-stable complexes, tacn-based ligands bearing three pendent pyridyl groups offer an ideal platform, as these hexadentate scaffolds have been shown to afford highly-stable FeII complexes.10,21 In addition, the ligand field can be readily tuned to obtain spin-crossover complexes within a physiologically relevant temperature range by chemical modulation of the electronic and steric properties of the pyridyl donors.21e,22 Toward this end, we sought to synthesize related ligands that support FeII complexes in selected spin states through controlled introduction of methyl groups into the 6-position of the pyridyl groups, which serves to weaken the ligand field by virtue of steric crowding at the FeII center. In addition, in order to enable utilization of these compounds in 19F MRS thermometry, we installed fluorine substituents onto the 3-positions of the pyridyl groups.The preparation of ligands Lx (x = 1–3; see Fig. 1) was carried out through a five-step synthesis involving stepwise addition of 2-picolyl derivatives to the tacn backbone via reductive amination of the corresponding 2-pyridinecarboxaldehydes with tacn precursors (see Experimental section and Scheme S1†). Through judicious selection of the aldehyde reagent in each step, this synthetic route enabled the preparation of both symmetric and asymmetric tri-functionalized tacn-based ligands, appended with one or two types of 2-picolyl donors. Metalation of the ligands with FeII and ZnII was effected through reaction of equimolar amounts of Lx and the corresponding divalent metal ion in CH3CN. Subsequent diffusion of Et2O into a concentrated CH3CN or CH3OH/CH3CN solution afforded crystalline [Fe(L1)][BF4]2·0.5CH3CN (1a·0.5CH3CN), [Zn(L1)][BF4]2 (1b), [Fe(L2)][BF4]2 (2a), [Zn(L2)][BF4]2 (2b), and [Fe(L3)][BF4]2 (3a).
 | ||
| Fig. 1 Molecular structures of ligands Lx (x = 1–3). | ||
Single-crystal X-ray diffraction analysis for 1a·0.5CH3CN, 1b, 2a, 2b, and 3a, was carried out at 100 K (see Table S1†). Compound 1a·0.5CH3CN crystallized in the triclinic space group P![[1 with combining macron]](https://www.rsc.org/images/entities/char_0031_0304.gif) , and features two [Fe(L1)]2+ cations in the asymmetric unit. Compound 1b crystallized in the monoclinic space group Pc, with the asymmetric unit comprised of two [Zn(L1)]2+ cations. In contrast to the metal complexes of asymmetric L1, compounds 2a and 2b are isostructural and crystallized in the cubic space group F
, and features two [Fe(L1)]2+ cations in the asymmetric unit. Compound 1b crystallized in the monoclinic space group Pc, with the asymmetric unit comprised of two [Zn(L1)]2+ cations. In contrast to the metal complexes of asymmetric L1, compounds 2a and 2b are isostructural and crystallized in the cubic space group F![[4 with combining macron]](https://www.rsc.org/images/entities/char_0034_0304.gif) 3c, with one third of the [M(L2)]2+ (M = Fe, Zn) cation in the asymmetric unit. In these two structures, the MII metal center resides on a site of crystallographic three-fold symmetry. Finally, the asymmetric unit of the crystal structure of 3a, which crystallized in the trigonal space group P3, features one-third of three unique [Fe(L3)]2+ cations, with the remainder of each complex related through a crystallographic three-fold axis (see Fig. S1†).
3c, with one third of the [M(L2)]2+ (M = Fe, Zn) cation in the asymmetric unit. In these two structures, the MII metal center resides on a site of crystallographic three-fold symmetry. Finally, the asymmetric unit of the crystal structure of 3a, which crystallized in the trigonal space group P3, features one-third of three unique [Fe(L3)]2+ cations, with the remainder of each complex related through a crystallographic three-fold axis (see Fig. S1†).
In the cationic complex of each compound, the MII center resides in a distorted octahedral coordination environment, comprised of three facially bound tertiary amine nitrogen atoms from the tacn backbone and three picolyl nitrogen atoms (see Fig. 2). Examination of bond distances associated with the FeII cations reveals the spin state of these complexes in the solid-state at 100 K (see Table 1). The mean Fe–N bond distances for 1a·0.5CH3CN and 3a fall in the ranges 1.974(2)–2.088(2) and 1.969(3)–1.999(3) Å, respectively, indicative of low-spin FeII.15,22,23 In 1a·0.5CH3CN, the Fe–NMe-pyr bond lengths of 2.085(2) and 2.090(2) Å are significantly longer than the Fe–NF-pyr bond distances of 1.970(2)–1.978(2) Å, due to the steric effects imposed by the methyl substituent on one of the picolyl groups.22 In contrast, the average Fe–NMeF-pyr and Fe–Ntacn bond distances for 2a of 2.224(2) and 2.230(2) Å, respectively, are substantially longer and are characteristic of high-spin FeII.22,23a-c,24 Finally, the mean Zn–N bond distances of 2.196(3) and 2.212(2) Å for 1b, and 2b, respectively, are consistent with reported distances for ZnII ions in similar coordination environments.25
 | ||
| Fig. 2 (Left–Right) Crystal structures of [Fe(Lx)]2+ (x = 1, 2), as observed in 1a·0.5CH3CN and 2a, and [Zn(Lx)]2+ (x = 1, 2), as observed in 1b and 2b. Turquoise, orange, green, blue and gray spheres represent Zn, Fe, F, N and C atoms, respectively; H atoms are omitted for clarity. | ||
| 1a·0.5CH3CN | 1b | 2a | 2b | 3a | |
|---|---|---|---|---|---|
| a NMe-pyr corresponds to a N atom on a 6-methyl-2-picolyl group. b NF-pyr corresponds to a N atom on a 3-fluoro-2-picolyl group. c NMeF-pyr corresponds to a N atom on a 3-fluoro-6-methyl-2-picolyl group. d Octahedral distortion parameter (Σ) = sum of the absolute deviations from 90° of the 12 cis angles in the MN6 coordination sphere. e Data obtained from Zn1 due to severe crystallographic disorder associated with Zn2. | |||||
| M–Ntacn | 2.009(2) | 2.206(3) | 2.230(2) | 2.217(2) | 1.999(3) |
| M–NMe-pyra | 2.088(2) | 2.225(4) | — | — | — |
| M–NF-pyrb | 1.974(2) | 2.167(4) | — | — | 1.969(3) |
| M–NMeF-pyrc | — | — | 2.224(2) | 2.207(2) | — |
| Ntacn–M–Ntacn | 85.07(6) | 79.1(2) | 78.40(8) | 79.39(7) | 86.3(2) |
| cis Ntacn–M–NMe-pyr | 90.38(6) | 97.4(2) | — | — | — |
| cis Ntacn–M–NF-pyr | 89.08(6) | 93.2(2) | — | — | 90.0(1) |
| cis Ntacn–M–NMeF-pyr | — | — | 87.05(8) | 87.34(7) | — |
| NMe-pyr–M–NF-pyr | 96.79(7) | 97.7(2) | — | — | — |
| NF-pyr–M–NF-pyr | 94.59(6) | 94.9(2) | — | — | 94.07(9) |
| NMeF-pyr–M–NMeF-pyr | — | — | 105.27(7) | 104.21(6) | — |
| trans Ntacn–M–NMe-pyr | 166.76(7) | 148.9(2) | — | — | — |
| trans Ntacn–M–NF-pyr | 168.02(7) | 150.9(2) | — | — | 169.7(1) |
| trans Ntacn–M–NMeF-pyr | — | — | 156.40(8) | 157.85(7) | — |
| Σ | 72.4(3) | 159.7(5) | 134.8(3) | 127.7(2) | 59.9(4) |
| M⋯F | 5.102(2) | 5.260(3) | 5.277(2) | 5.258(2) | 5.094(2) |
The presence of fluoro and methyl substituents on the 2-picolyl pendent groups of ligands L1–3 leads to a distortion from octahedral coordination at the metal centers. This deviation from perfect octahedral geometry can be quantified through the octahedral distortion parameter Σ, defined as the sum of the absolute deviations of the 12 cis-oriented N–M–N angles from 90°.26 Analysis of the FeII centers in 1a·0.5CH3CN, 2a, and 3a gives values of Σ = 72.4(3), 134.8(3), and 59.9(4)°, respectively. The much larger value for 2a than for 1a·0.5CH3CN and 3a reflects the significant steric crowding in 2a and further corroborates the high-spin and low-spin assignments of these complexes.27 The larger distortion of the [Fe(L1)]2+ cation in 1a·0.5CH3CN relative to [Fe(L3)]2+ in 3a is attributed to presence of one vs. zero picolyl methyl substituents, respectively. The coordination environment of the FeII complex in 2a and its isostructural ZnII analogue in 2b are similar, where 2b is slightly less distorted than 2a, evident from a smaller Σ value of 127.7(2)°. In contrast, the difference between the structures of 1a·0.5CH3CN and 1b is substantial. Upon moving from Fe to Zn, the mean Ntacn–M–Ntacn angle decreases by 7.1%, from 85.07(6) to 79.1(2)°, and the mean trans Ntacn–M–Npyr angles decrease by 10.7 (NMe-pyr), and 10.2% (NF-pyr), respectively. Finally, a more than two-fold increase in Σ is observed for 1b relative to 1a·0.5CH3CN. These differences reflect a much greater degree of distortion at the ZnII center in 1b than at the FeII center in 1a·0.5CH3CN, which likely stems from increased coordination flexibility at the d10 ZnII ion due to lack of ligand field stabilization, and the larger six-coordinate ionic radius of ZnII (0.88 Å) compared to low-spin FeII (0.75 Å).27a
Compounds 1a·0.5CH3CN, 1b, 2a, 2b, and 3a feature intramolecular M⋯F distances in the range 5.094(2)–5.277(2) Å. The shortest M⋯F distances are observed between the 3-fluoro-2-picolyl pendent groups and the FeII centers in compounds 1a·0.5CH3CN and 3a, with slightly longer M⋯F distances of 5.26–5.28 Å in compounds 1b, 2a, and 2b. The longer Zn⋯F distance in 1b, compared to the corresponding Fe⋯F distance in 1a·0.5CH3CN, can be attributed to the longer Zn–N bond distances relative to Fe. In the case of compounds 2a and 2b, the presence of bulky 3-fluoro-6-methyl-2-picolyl groups increase the M⋯F distances relative to 1a·0.5CH3CN and 3a. Importantly, the M⋯F distances of 1a and 2a are within the optimal range of 4.5–7.5 Å to balance the benefits of paramagnetic hyperfine shift with the decrease in sensitivity due to spectral broadening,19d,e which demonstrates the potential of these complexes as candidates for 19F chemical shift MR probes.
UV-vis spectroscopy
To probe the solution electronic structures of the cationic complexes in 1a, 1b, 2a, 2b, and 3a, UV-vis absorption spectra were collected for crystalline samples in CH3CN solution. The spectrum of 1a obtained at 25 °C exhibits an intense band at 264 nm (ε = 10![[thin space (1/6-em)]](https://www.rsc.org/images/entities/char_2009.gif) 700 M−1 cm−1), in addition to a weaker broad band at 424 nm (ε = 2800 M−1 cm−1) with a high-energy shoulder (see Fig. 3 and S2†). Based on literature precedent of FeII complexes in similar ligand environments, we assign these absorption bands as ligand-centered π–π* and metal–ligand charge transfer (MLCT) transitions, respectively.22,28 The UV-vis spectrum of 2a at 25 °C is dominated by the intense π–π* band (λmax = 273 nm, εmax = 11100 M−1 cm−1), and an additional broad feature of low intensity between 320 and 460 nm (λmax = 375 nm) corresponds to a MLCT transition (see Fig. 3, lower, and S3†). The weak intensity and the small temperature dependence between −35 and 65 °C for the latter band (εmax = 1000 vs. 700 M−1 cm−1, respectively) are characteristic of high-spin FeII.28c,29 Compound 3a is also relatively insensitive to temperature changes and at 25 °C displays a similar ligand-centered π–π* transition at 261 nm, but with a more intense MLCT band at 436 nm (εmax = 10600 M−1 cm−1), and as such is indicative of low-spin FeII (see Fig. 3, lower, and S4†).22,30 The variable-temperature UV-vis spectra of the ZnII compounds 1b and 2b in CH3CN each exhibits a single intense band with λmax = 268 and 278 nm, respectively (see Fig. S5 and S6†), consistent with ligand-centered π–π* transitions.31
700 M−1 cm−1), in addition to a weaker broad band at 424 nm (ε = 2800 M−1 cm−1) with a high-energy shoulder (see Fig. 3 and S2†). Based on literature precedent of FeII complexes in similar ligand environments, we assign these absorption bands as ligand-centered π–π* and metal–ligand charge transfer (MLCT) transitions, respectively.22,28 The UV-vis spectrum of 2a at 25 °C is dominated by the intense π–π* band (λmax = 273 nm, εmax = 11100 M−1 cm−1), and an additional broad feature of low intensity between 320 and 460 nm (λmax = 375 nm) corresponds to a MLCT transition (see Fig. 3, lower, and S3†). The weak intensity and the small temperature dependence between −35 and 65 °C for the latter band (εmax = 1000 vs. 700 M−1 cm−1, respectively) are characteristic of high-spin FeII.28c,29 Compound 3a is also relatively insensitive to temperature changes and at 25 °C displays a similar ligand-centered π–π* transition at 261 nm, but with a more intense MLCT band at 436 nm (εmax = 10600 M−1 cm−1), and as such is indicative of low-spin FeII (see Fig. 3, lower, and S4†).22,30 The variable-temperature UV-vis spectra of the ZnII compounds 1b and 2b in CH3CN each exhibits a single intense band with λmax = 268 and 278 nm, respectively (see Fig. S5 and S6†), consistent with ligand-centered π–π* transitions.31
 | ||
| Fig. 3 (Upper) UV-vis spectra of 1a in CH3CN at selected temperatures. Arrows denote isosbestic points. (Lower) UV-vis spectra in CH3CN at 25 °C. The asterisk denotes an instrumental artifact. | ||
The absorption spectra of 1a demonstrate remarkable temperature dependence between −35 and 65 °C (see Fig. 3, upper). While the position of the π–π* band is relatively invariant to temperature, εmax decreases significantly from 14800 to 8400 M−1 cm−1 upon warming, as has been observed for related pyridyl complexes.32 At −35 °C, the MLCT band exhibits a λmax value of 439 nm (εmax = 5500 M−1 cm−1) with a shoulder at ca. 385 nm. Upon warming, the MLCT bands broaden and decrease in intensity, resulting in a single peak with λmax = 385 nm (εmax = 1600 M−1 cm−1) at 65 °C that corresponds to ca. 3.5-fold reduction in intensity from the −35 °C spectrum. This temperature dependence of the spectra is indicative of a thermally-induced spin state transition.22,33 Indeed, approximating a metal complex of Oh symmetry, the intensity of the MLCT band is directly correlated to the number of electrons in t2g orbitals.32c,d As such, moving from low-spin FeII (t62g) to high-spin FeII (t42ge2g) with increasing temperature results in a weaker absorption. Moreover, the presence of three isosbestic points at 222, 273, and 302 nm suggests an equilibrium between two spin states for the FeII centers in 1a.
The temperature-dependent spin state of FeII in 1a in CH3CN can be further examined by comparing the UV-vis spectra of 1a with the corresponding spectra of the high-spin compound 2a and the low-spin compound 3a (see Fig. 3, lower). At lower temperature, the spectrum of 1a strongly resembles that of 3a (see Fig. S7†), whereas at higher temperature the broad spectrum resembles that of 2a (see Fig. S8†). These temperature-dependent spectral changes demonstrate the thermally-induced spin-crossover of 1a in CH3CN solution from primary population of a low-spin state at −35 °C to a high-spin state at 65 °C.
With an eye toward employing these complexes in MR thermometry, UV-vis spectra were collected for aqueous solutions of compounds 1a, 1b, 2a, 2b, and 3a at ambient temperature. All compounds show similar characteristics in H2O as in CH3CN, giving comparable values of λmax and εmax (see Fig. S9–S13†). Nevertheless, the spectrum of 1a in H2O reveals some key differences from the spectrum obtained in CH3CN at 25 °C. The absorption maximum of the MLCT band is shifted to a longer wavelength in H2O (λmax = 436 nm), and the intensity of this band compared to the intensity of the analogous band for 3a in the same solvent is considerably greater in H2O than in CH3CN (H2O: εmax,3a/εmax,1a = 1.5; CH3CN: εmax,3a/εmax,1a = 3.8). These observations indicate that moving from CH3CN to H2O serves to stabilize the low-spin state of [Fe(L1)]2+, leading to a higher T1/2. Similar trends have been reported for other spin-crossover FeII complexes and stem from the donor strength of the two solvents.34 Importantly, 1a exhibits remarkable water and air stability, as the absorption spectra of this compound in deoxygenated water and after four weeks in oxygenated water are identical (see Fig. S9†).
Magnetic properties
To probe the magnetic properties of compounds 1a and 2a, variable-temperature magnetic susceptibility data were collected in the temperature range 5–60 °C for aqueous solutions in a 9.4 T NMR spectrometer using the Evans method (see Fig. 4).35 For 2a, χMT is constant over this temperature range, with an average value of χMT = 3.63 cm3 K mol−1 that corresponds to a high-spin, S = 2 FeII ion with g = 2.20. In stark contrast, for 1a, χMT increases nearly linearly with increasing temperature, from a minimum value of 0.93 cm3 K mol−1 at 5 °C to a maximum value of 1.99 cm3 K mol−1 at 60 °C, indicative of thermally-induced spin-crossover. Note that the high-spin excited state contributes considerably to the overall magnetic moment of 1a at 5 °C, as the observed value of χMT = 0.93 cm3 K mol−1 is significantly higher than the theoretical value of 0 cm3 K mol−1 for a solely populated S = 0 ground state. Analogously, a mixture of low-spin and high-spin FeII centers is present at 60 °C, as evident from the significant deviation of χMT = 1.99 cm3 K mol−1 from the average value of the high-spin analogue 2a. Considering a value of χMT = 0 cm3 K mol−1 for a solely populated S = 0 low-spin state and χMT = 3.63 cm3 K mol−1 for a solely populated S = 2 high-spin state with g = 2.20, the high-spin molar fraction of FeII centers in 1a was calculated as a function of temperature (see Fig. S14†). A linear fit to the data gives T1/2 = 325(1) K or 52(1) °C. Moreover, the data were simulated using the regular solution model36,37 to estimate thermodynamic parameters of ΔH = 18.0(3) kJ mol−1 and ΔS = 55.5(9) J K−1 mol−1, which are similar in magnitude to related mononuclear spin-crossover FeII complexes (see Fig. S15†).15,28c,36,38 | ||
| Fig. 4 Variable-temperature magnetic susceptibility data for aqueous solutions of 1a (purple) and 2a (red), obtained in a 9.4 T NMR spectrometer using the Evans method. Error bars represent standard deviations of the measurements. | ||
To test our hypothesis that the low-spin state of [Fe(L1)]2+ in 1a is stabilized in H2O relative to CH3CN, variable-temperature magnetic susceptibility data were collected for an acetonitrile solution of 1a, using the same procedure as described above (see Fig. S16†). As observed in aqueous solution, χMT increases nearly linearly with increasing temperature, from 0.62 cm3 K mol−1 at −42 °C to 2.71 cm3 K mol−1 at 60 °C. Furthermore, a linear fit to the data affords T1/2 = 17(1) °C, which is 35 °C lower than observed in H2O, and demonstrates the different donor strengths of the H2O and CH3CN (see Fig. S17†).
Variable-temperature NMR spectroscopy
To further investigate the solution properties of compounds 1a, 1b, 2a, 2b, and 3a, variable-temperature 1H NMR spectra were collected in CD3CN at selected temperatures. The 1H NMR spectra of compounds 1b, 2b, and 3a resemble those of their respective ligands (see Fig. S18–S20†) and show minimal changes in the temperature range 25–56 °C, confirming diamagnetic electronic structures (see Fig. S21–S23†). In contrast, the 1H NMR spectra of 2a display nine paramagnetically shifted resonances, consistent with time-averaged C3 symmetry in CH3CN solution (see Fig. S24†). At −1 °C, these resonances span −18 to 225 ppm, typical for high-spin FeII complexes.10,12,21b,d,e,g,h,28c As the temperature is increased to 56 °C, the peaks shift linearly toward the diamagnetic region. This Curie behavior (δ ∝ T−1) is characteristic of high-spin complexes and confirms that 2a remains S = 2 over the entire temperature range. In contrast, the 1H NMR resonances of 1a show anti-Curie behavior, shifting away from the diamagnetic region with increasing temperature (see Fig. S25†). Specifically, at −38 °C, the proton resonances are dispersed between −2 and 13 ppm, barely beyond the diamagnetic region, suggesting primary population of an S = 0 ground state. Increasing the temperature to 56 °C results in an expansion of the chemical shift range to −25–150 ppm, indicative of thermal population of the high-spin excited state. An analogous trend is observed in the variable-temperature 1H NMR spectra of 1a in D2O, though the resonances are broader and less shifted than in CD3CN at analogous temperatures, giving a chemical shift range from −17 to 107 ppm at 56 °C (see Fig. S26†). These observations are consistent with the higher T1/2 in H2O relative to CH3CN, as evident from solution magnetic measurements and UV-vis data.In order to determine the effect of spin state on 19F resonances, and to assess these compounds as candidates for 19F MRS thermometry, we collected variable-temperature 19F NMR spectra for aqueous solutions of 1a and 2a from 4 to 61 °C, using trifluoroethanol (TFE) as an internal standard (see Experimental section, Fig. S27, and Table S2†). To better understand how the temperature dependence of 19F NMR chemical shifts is affected by the electronic spin state, and to quantify the hyperfine shifts of the paramagnetic FeII compounds 1a and 2a, their corresponding ZnII analogues, 1b and 2b, were employed as diamagnetic references (see Table 2).18c Importantly, the chemical shifts of the fluorine resonances of ZnII compounds 1b and 2b are effectively invariant to temperature changes (see Fig. 5, S28, and S29†).
| CD3CN | H2O | FBS | |||||||
|---|---|---|---|---|---|---|---|---|---|
| 1a | 2a | 1a | 2a | 1a | 2a | ||||
| a Referenced to corresponding ZnII analogues at 40 °C. b Obtained from the temperature range −22–40 °C. c Obtained from the temperature range 4–61 °C. d Obtained from data at 40 °C. | |||||||||
| δ (ppm)a | 59.4 | 52.6 | 55.9 | 41.6 | 36.3 | 59.2 | 40.7 | 35.5 | 59.0 |
| Δδ (ppm) | +40.9b | +36.2b | −13.6b | +28.3c | +24.6c | −12.0c | +28.8c | +25.1c | −11.7c |
| CT (ppm per °C) | +0.67(2)b | +0.59(2)b | −0.24(2)b | +0.52(1)c | +0.45(1)c | −0.21(1)c | +0.52(1)c | +0.45(1)c | −0.21(1)c |
| FWHM (Hz)d | 287 | 270 | 105 | 282 | 243 | 868 | 251 | 241 | 872 |
| |CT|/FWHM (per °C) | 1.10 | 1.03 | 1.07 | 0.87 | 0.87 | 0.11 | 0.97 | 0.88 | 0.11 |
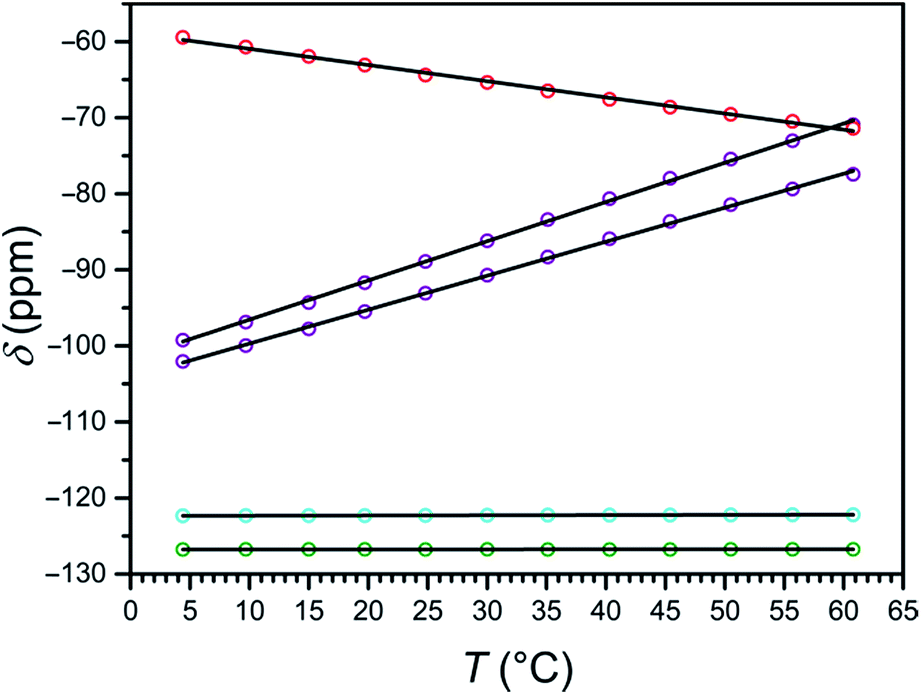 | ||
| Fig. 5 Plot of the temperature dependence of the 19F NMR chemical shift of 1a (purple), 1b (cyan), 2a (red), and 2b (green) in H2O. Chemical shift values are corrected with TFE internal standard and referenced to CFCl3. Solid black lines represent linear fits to the data. | ||
At 4 °C, the 19F NMR spectrum of the high-spin compound 2a displays a single resonance at −59.4 ppm vs. CFCl3 that is shifted +67.3 ppm from its diamagnetic ZnII analogue 2b. As the temperature is raised to 61 °C, the chemical shift of the paramagnetic signal shifts upfield to −71.4 ppm, closer to the 19F resonance of its diamagnetic analogue, as expected for Curie behavior (see Fig. S30 and S31, and Tables S3 and S4†). The observation of a single signal for 2a further supports the C3 symmetry of the [Fe(L2)]2+ cation in solution, as suggested by 1H NMR spectroscopy. Analysis of the temperature dependence of the 19F NMR chemical shift reveals a linear temperature dependence over 4–61 °C following the equation δppm = −0.21 × T − 58.8, affording a temperature coefficient39 of CT = −0.21(1) ppm per °C (see Fig. 5, and Table 2). Since linewidth has a significant effect on the precision of MRS probes, the value |CT|/FWHM (FWHM = full width at half maximum) is also a useful measure of probe sensitivity. At 40 °C, the fluorine resonance of 2a exhibits a FWHM of 868 Hz, giving a |CT|/FWHM = 0.11 per °C.
The 19F NMR spectrum of 1a obtained at 4 °C exhibits two resonances of equal intensity at −99.3 and −102.1 ppm vs. CFCl3 (see Fig. S32, and Table S3†), suggesting that the two 3-fluoro-2-picolyl arms of L1 are inequivalent on the NMR timescale. These peaks are shifted +23.1 and +20.3 ppm from the diamagnetic ZnII analogue 1b (see Fig. S33, and Table S4†), which exhibits two overlapping resonances centered at −122.3 ppm (see Fig. S28†). Increasing the temperature to 61 °C results in a downfield shift of the resonances of 1a to +51.3 and +44.8 ppm from 1b, consistent with the anti-Curie behavior observed in the corresponding 1H NMR spectra. The 19F chemical shift of both resonances for 1a vary linearly between 4 and 61 °C following the equations δppm = 0.52 × T − 101.7 and δppm = 0.45 × T − 104.2, providing temperature sensitivities of CT = +0.52(1) and +0.45(1) ppm per °C, respectively (see Fig. 5, and Table 2). Fluorine resonances with the narrowest linewidths are obtained at 20 °C, but the peaks broaden significantly above 55 °C (FWHM > 500 Hz). At 40 °C, the fluorine resonances each shows a value of |CT|/FWHM = 0.87 per °C.
The two 19F NMR resonances of 1a exhibit 2.5- and 2.1-fold higher CT values than that of the high-spin 2a. Furthermore, the narrower linewidths of the resonances of 1a afford an 8-fold higher |CT|/FWHM value than 2a at 40 °C. Remarkably, the two 19F resonances of 1a represent 43- and 38-fold enhancement of temperature sensitivity compared to diamagnetic perfluorocarbons that have been employed for in vivo thermometry.20 Despite the much narrower peak widths of the diamagnetic fluorine resonances relative to those of 1a, the |CT|/FWHM value of 1a at 40 °C is 2.9-fold higher owing to the strong temperature dependence of the chemical shift of its two resonances. These observations demonstrate that the use of spin-crossover complexes may provide an excellent strategy for improving the sensitivity of 19F MR thermometers.
Furthermore, the separation between the two fluorine resonances of 1a varies strongly with temperature, from 2.81 ppm at 4 °C to 6.52 ppm at 61 °C, following the linear relationship Δδppm = 0.069 × T + 2.47 (see Fig. S34†). This peak separation provides an internal method of correcting errors in the 19F chemical shift that arise from complicating physiological effects, such as motion, magnetic susceptibility changes, and varying oxygen tension.20 Overall, three temperature-dependent parameters of compound 1a can be followed for MR thermometry, namely the 19F NMR chemical shifts of two inequivalent fluorine substituents, and the chemical shift difference between these signals.
To evaluate the efficacy of 1a and 2a in a physiological environment, 19F NMR spectra were collected from 4 to 61 °C on 13.4 and 15.0 mM solutions of 1a and 2a, respectively, in fetal bovine serum (FBS), using NaF as an internal standard (see Fig. S35†). The 19F NMR spectra in FBS are essentially identical to those recorded in H2O and provide the same CT values (see Fig. S36 and S37 and Tables 2 and S5†). Plots of the temperature dependence of fluorine chemical shifts of compounds 1a and 2a in FBS are depicted in Fig. 6, where the chemical shifts of the FeII complexes have been referenced to the corresponding shifts of ZnII analogues 1b and 2b in water (see Table S6†). The linewidths for the resonance of 2a are similar in FBS and H2O, while 1a exhibits slightly narrower peaks in the high-temperature region (>30 °C) in FBS compared to those in H2O, resulting in higher |CT|/FWHM values in FBS. Furthermore, both complexes remain intact while incubated with FBS for over 24 h, as evidenced by identical 19F NMR spectra recorded at 25 °C initially and after 24 h (see Fig. S38 and S39†). Taken together, these results demonstrate the stability of compounds 1a and 2a in a physiological environment and indicate that temperature measurements with +0.52(1) and −0.21(1) ppm per °C sensitivity, respectively, can be achieved with these probes through chemical shift 19F MR thermometry. Moreover, the excellent stability and favorable 19F MR properties of 1a under physiological conditions suggest that this compound is a viable candidate for in vivo studies.
 | ||
| Fig. 6 Variable-temperature 19F NMR spectra of 1a (upper) and 2a (lower) in FBS, using a NaF internal standard. The chemical shifts of the FeII compounds 1a and 2a are referenced to their corresponding ZnII analogues 1b and 2b, set to 0 ppm. Black numbers correspond to temperature in °C. | ||
A comparison of the 19F NMR properties of compounds 1a and 2a in CD3CN (see Fig. S40–S44†), H2O and FBS is summarized in Table 2. The hyperfine shift of the spin-crossover compound 1a is significantly affected by the solvent, in contrast to high-spin 2a (see Tables S3 and S7†). Along these lines, the resonances of 1a display a 1.3-fold higher temperature sensitivity in CD3CN than in H2O, which is consistent with a lower T1/2 in CD3CN. These observations reflect the pronounced effects of spin state on 19F NMR chemical shift, as has been previously reported for transition metal porphyrin complexes.18 Nevertheless, the results presented here provide a rare examination of spin state effects on 19F NMR spectra across a series of metal complexes.
Conclusions
The foregoing results demonstrate the potential utility of paramagnetic FeII complexes as chemical shift 19F MR thermometers. Most importantly, we show that the sensitivity of 19F MR thermometers can be improved by employing a temperature-dependent change in spin state, as illustrated in a series of FeII complexes. To our knowledge, these complexes represent the first examples of paramagnetic 19F MR chemical shift agents proposed for thermometry applications. Future efforts will focus on in vitro and in vivo MRS thermometry experiments on these compounds and the synthesis of spin-crossover complexes with higher sensitivity by exploiting the chemical tunability of the tacn-based ligand scaffold.Acknowledgements
This research was funded by the Air Force Research Laboratory under agreement no. FA8650-15-5518, the Chemistry of Life Processes Institute, and Northwestern University. The U.S. Government is authorized to reproduce and distribute reprints for governmental purposes notwithstanding any copyright notation thereon. The views and conclusions contained herein are those of the authors and should not be interpreted as necessarily representing the official policies or endorsements, either expressed or implied, of AFRL or the U.S. Government. T.D.H. thanks the Alfred P. Sloan Foundation. We thank Mr K. Du and Ms L. Lilley for experimental assistance and helpful discussions, Dr J. Y. Lee for experimental assistance, Ms C. Stern for assistance with X-ray crystallography, and Prof T. Meade for generous donation of 19F NMR standards and fetal bovine serum.Notes and references
- V. Rieke and K. B. Pauly, J. Magn. Reson. Imaging, 2008, 27, 376 CrossRef PubMed.
- (a) H. Rhim, S. N. Goldberg, G. D. Dodd III, L. Solbiati, H. K. Lim, M. Tonolini and O. K. Cho, RadioGraphics, 2001, 21, S17 CrossRef PubMed; (b) P. Wust, B. Hildebrandt, G. Sreenivasa, B. Rau, J. Gellermann, H. Riess, R. Felix and P. M. Schlag, Lancet Oncol., 2002, 3, 487 CrossRef CAS PubMed; (c) C. Weidensteiner, B. Quesson, B. Caire-Gana, N. Kerioui, A. Rullier, H. Trillaud and C. T. W. Moonen, Magn. Reson. Med., 2003, 50, 322 CrossRef PubMed; (d) P. Wust, C. H. Cho, B. Hildebrandt and J. Gellerman, Int. J. Hyperthermia, 2006, 22, 255 CrossRef PubMed; (e) N. R. Datta, S. G. Ordóñez, U. S. Gaipl, M. M. Paulides, H. Crezee, J. Gellermann, D. Marder, E. Puric and S. Bodis, Cancer Treat. Rev., 2015, 41, 742 CrossRef CAS PubMed.
- S. Lévy, Arch. Mal. Coeur Vaiss., 1995, 88, 1465 Search PubMed.
- R. Jayasundar and V. P. Singh, Neurol. India, 2002, 50, 436 CAS.
- B. Quesson, J. A. D. Zwart and C. T. W. Moonen, J. Magn. Reson. Imaging, 2000, 12, 525 CrossRef CAS PubMed.
- (a) J. C. Hindman, J. Chem. Phys., 1966, 44, 4582 CrossRef CAS; (b) Y. Ishihara, A. Calderon, H. Watanabe, K. Okamoto, Y. Suzuki, K. Kuroda and Y. Suzuki, Magn. Reson. Med., 1995, 34, 814 CrossRef CAS PubMed; (c) W. Wlodarczyk, M. Hentschel, P. Wust, R. Noeske, N. Hosten, H. Rinneberg and R. Felix, Phys. Med. Biol., 1999, 44, 607 CrossRef CAS PubMed.
- (a) K. Kuroda, Int. J. Hyperthermia, 2005, 21, 547 CrossRef CAS PubMed; (b) S. Roujol, M. Ries, B. Quesson, C. T. W. Moonen and B. Denis de Senneville, Magn. Reson. Med., 2010, 63, 1080 CrossRef PubMed; (c) G. Liu, Q. Qin, K. W. Y. Chan, Y. Li, J. W. M. Bulte, M. T. McMahon, P. C. M. van Zijl and A. A. Gilad, NMR Biomed., 2014, 27, 320 CrossRef PubMed; (d) L. Winter, E. Oberacker, K. Paul, Y. Ji, C. Oezerdem, P. Ghadjar, A. Thieme, V. Budach, P. Wust and T. Niendorf, Int. J. Hyperthermia, 2016, 32, 63 CrossRef CAS PubMed.
- B. Denis de Senneville, B. Quesson and C. T. W. Moonen, Int. J. Hyperthermia, 2005, 21, 515 CrossRef CAS PubMed.
- (a) C. S. Zuo, J. L. Bowers, K. R. Metz, T. Nosaka, A. D. Sherry and M. E. Clouse, Magn. Reson. Med., 1996, 36, 955 CrossRef CAS PubMed; (b) K. Roth, G. Bartholomae, H. Bauer, T. Frenzel, S. Kossler, J. Platzek and H.-J. Weinmann, Angew. Chem., Int. Ed. Engl., 1996, 35, 655 CrossRef CAS; (c) S. Aime, M. Botta, L. Milone and E. Terreno, Chem. Commun., 1996, 1265 RSC; (d) S. Aime, M. Botta, M. Fasano, E. Terreno, P. Kinchesh, L. Calabi and L. Paleari, Magn. Reson. Med., 1996, 35, 648 CrossRef CAS PubMed; (e) T. Frenzel, K. Roth, S. Koßler, B. Radüchel, H. Bauer, J. Platzek and H.-J. Weinmann, Magn. Reson. Med., 1996, 35, 364 CrossRef CAS PubMed; (f) C. S. Zuo, K. R. Metz, Y. Sun and A. D. Sherry, J. Magn. Reson., 1998, 133, 53 CrossRef CAS PubMed; (g) S. Aime, M. Botta, M. Fasano and E. Terreno, Chem. Soc. Rev., 1998, 27, 19 RSC; (h) J. Rohovec, I. Lukeš and P. Hermann, New J. Chem., 1999, 23, 1129 RSC; (i) Y. Sun, M. Sugawara, R. V. Mulkern, K. Hynynen, S. Mochizuki, M. Albert and C. S. Zuo, NMR Biomed., 2000, 13, 460 CrossRef CAS PubMed; (j) C. S. Zuo, A. Mahmood and A. D. Sherry, J. Magn. Reson., 2001, 151, 101 CrossRef CAS PubMed; (k) S. K. Hekmatyar, P. Hopewell, S. K. Pakin, A. Babsky and N. Bansal, Magn. Reson. Med., 2005, 53, 294 CrossRef CAS PubMed; (l) S. K. Hekmatyar, R. M. Kerkhoff, S. K. Pakin, P. Hopewell and N. Bansal, Int. J. Hyperthermia, 2005, 21, 561 CrossRef CAS PubMed; (m) S. K. Pakin, S. K. Hekmatyar, P. Hopewell, A. Babsky and N. Bansal, NMR Biomed., 2006, 19, 116 CrossRef CAS PubMed; (n) D. Coman, H. K. Trubel, R. E. Rycyna and F. Hyder, NMR Biomed., 2009, 22, 229 CrossRef CAS PubMed; (o) J. R. James, Y. Gao, M. A. Miller, A. Babsky and N. Bansal, Magn. Reson. Med., 2009, 62, 550 CrossRef CAS PubMed; (p) D. Coman, H. K. Trubel and F. Hyder, NMR Biomed., 2010, 23, 277 CAS; (q) M. Milne and R. H. E. Hudson, Chem. Commun., 2011, 47, 9194 RSC; (r) D. Coman, R. A. de Graaf, D. L. Rothman and F. Hyder, NMR Biomed., 2013, 26, 1589 CrossRef CAS PubMed.
- P. B. Tsitovich, J. M. Cox, J. B. Benedict and J. R. Morrow, Inorg. Chem., 2016, 55, 700 CrossRef CAS PubMed.
- (a) A. Palasz and P. Czekaj, Acta Biochim. Pol., 2000, 47, 1107 CAS; (b) C. Rydahl, H. S. Thomsen and P. Marckmann, Invest. Radiol., 2008, 43, 141 CrossRef CAS PubMed; (c) K. T. Rim, K. H. Koo and J. S. Park, Safety and Health at Work, 2013, 4, 12 CrossRef CAS PubMed.
- I. Bertini and C. Luchinat, NMR of Paramagnetic Molecules in Biological Systems, The Benjamin/Cummings Publishing Company, Inc., Menlo Park, CA, 1986 Search PubMed.
- (a) Spin Crossover In Transition Metal Compounds: Topics in Current Chemistry, ed. P. Gütlich and H. A. Goodwin, Springer, Berlin, 2004, vol. 1−3 Search PubMed; (b) A. B. Gaspar, M. Seredyuk and P. J. Gütlich, J. Mol. Struct., 2009, 924–926, 9 CrossRef CAS; (c) M. A. Halcrow, Chem. Soc. Rev., 2011, 40, 4119 RSC; (d) Spin-Crossover Materials: Properties and Applications, ed. M. A. Halcrow, Wiley-VCH, Weinham, 2013 Search PubMed.
- R. N. Muller, L. Vander Elst and S. Laurent, J. Am. Chem. Soc., 2003, 125, 8405 CrossRef CAS PubMed.
- I.-R. Jeon, J. G. Park, C. R. Haney and T. D. Harris, Chem. Sci., 2014, 5, 2461 RSC.
- W. R. Dolbier. Guide to Fluorine NMR for Organic Chemists, John Wiley & Sons, Hoboken, NJ, 2009 Search PubMed.
- (a) J. X. Yu, V. D. Kodibagkar, W. Cui and R. P. Mason, Curr. Med. Chem., 2005, 12, 819 CrossRef CAS PubMed; (b) J. Chen, G. M. Lanza and S. A. Wickline, Wiley Interdiscip. Rev.: Nanomed. Nanobiotechnol., 2010, 2, 431 CrossRef CAS PubMed; (c) I. Tirotta, V. Dichiarante, C. Pigliacelli, G. Cavallo, G. Terraneo, F. B. Bombelli, P. Metrangolo and G. Resnati, Chem. Rev., 2015, 115, 1106 CrossRef CAS PubMed.
- (a) V. V. Smirnov, E. K. Woller and S. G. DiMagno, Inorg. Chem., 1998, 37, 4971 CrossRef CAS PubMed; (b) L. Yatsunyk and F. A. Walker, Inorg. Chim. Acta, 2002, 337, 266 CrossRef CAS; (c) B. Song and B. Yu, Bull. Korean Chem. Soc., 2003, 24, 981 CrossRef CAS.
- (a) P. K. Senanayake, A. M. Kenwright, D. Parker and S. van der Hoorn, Chem. Commun., 2007, 2923 RSC; (b) A. M. Kenwright, I. Kuprov, E. De Luca, D. Parker, S. U. Pandya, P. K. Senanayake and D. G. Smith, Chem. Commun., 2008, 2514 RSC; (c) K. H. Chalmers, E. De Luca, N. H. M. Hogg, A. M. Kenwright, I. Kuprov, D. Parker, M. Botta, J. I. Wilson and A. M. Blamire, Chem.–Eur. J., 2010, 16, 134 CrossRef CAS PubMed; (d) P. Harvey, I. Kuprov and D. Parker, Eur. J. Inorg. Chem., 2012, 2015 CrossRef CAS; (e) P. Harvey, A. M. Blamire, J. I. Wilson, K.-L. N. A. Finney, A. M. Funk, P. K. Senanayake and D. Parker, Chem. Sci., 2013, 4, 4251 RSC.
- (a) B. A. Berkowitz, J. T. Handa and C. A. Wilson, NMR Biomed., 1992, 5, 65 CrossRef CAS PubMed; (b) A. G. Webb, N. B. Smith, D. S. Ellis and W. D. O'Brien, Proc.–IEEE Ultrason. Symp., 1995, 2, 1609 Search PubMed.
- (a) V. Stavila, M. Allali, L. Canaple, Y. Stortz, C. Franc, P. Maurin, O. Beuf, O. Dufay, J. Samarut, M. Janier and J. Hasserodt, New J. Chem., 2008, 32, 428 RSC; (b) S. J. Dorazio, P. B. Tsitovich, K. E. Siters, J. A. Spernyak and J. R. Morrow, J. Am. Chem. Soc., 2011, 133, 14154 CrossRef CAS PubMed; (c) J. Hasserodt, New J. Chem., 2012, 36, 1707 RSC; (d) P. B. Tsitovich and J. R. Morrow, Inorg. Chim. Acta, 2012, 393, 3 CrossRef CAS; (e) S. J. Dorazio, P. B. Tsitovich, S. A. Gardina and J. R. Morrow, J. Inorg. Biochem., 2012, 117, 212 CrossRef CAS PubMed; (f) F. Touti, P. Maurin and J. Hasserodt, Angew. Chem., Int. Ed., 2013, 52, 4654 CrossRef CAS PubMed; (g) P. B. Tsitovich, J. A. Spernyak and J. R. Morrow, Angew. Chem., Int. Ed., 2013, 52, 13997 CrossRef CAS PubMed; (h) S. J. Dorazio, A. O. Olatunde, P. B. Tsitovich and J. R. Morrow, JBIC, J. Biol. Inorg. Chem., 2014, 19, 191 CrossRef CAS PubMed; (i) C. Gondrand, F. Touti, E. Godart, Y. Berezhanskyy, E. Jeanneau, P. Maurin and J. Hasserodt, Eur. J. Inorg. Chem., 2015, 1376 CrossRef CAS; (j) J. Wang, C. Gondrand, F. Touti and J. Hasserodt, Dalton Trans., 2015, 44, 15391 RSC.
- I. Prat, A. Company, T. Corona, T. Parella, X. Ribas and M. Costas, Inorg. Chem., 2013, 52, 9229 CrossRef CAS PubMed.
- (a) A. Diebold and K. S. Hagen, Inorg. Chem., 1998, 37, 215 CrossRef CAS; (b) K. Chen and L. Que Jr, J. Am. Chem. Soc., 2001, 123, 6327 CrossRef CAS PubMed; (c) C. R. Goldsmith, R. T. Jonas, A. P. Cole and T. D. P. Stack, Inorg. Chem., 2002, 41, 4642 CrossRef CAS PubMed; (d) D. J. Rudd, C. R. Goldsmith, A. P. Cole, T. D. P. Stack, K. O. Hodgson and B. Hedman, Inorg. Chem., 2005, 44, 1221 CrossRef CAS PubMed.
- G. J. P. Britovsek, J. England and A. J. P. White, Inorg. Chem., 2005, 44, 8125 CrossRef CAS PubMed.
- (a) O. Schlager, K. Wieghardt, H. Grondey, A. Rufińska and B. Nuber, Inorg. Chem., 1995, 34, 6440 CrossRef CAS; (b) F. H. Fry, G. D. Fallon and L. Spiccia, Inorg. Chim. Acta, 2003, 346, 57 CrossRef CAS; (c) F. H. Fry, P. Jensen, C. M. Kepert and L. Spiccia, Inorg. Chem., 2003, 42, 5637 CrossRef CAS PubMed.
- M. G. B. Drew, C. J. Harding, V. McKee, G. G. Morgan and J. Nelson, J. Chem. Soc., Chem. Commun., 1995, 1035 RSC.
- (a) R. D. Shannon, Acta Crystallogr., Sect. A: Cryst. Phys., Diffr., Theor. Gen. Crystallogr., 1976, 32, 751 CrossRef; (b) Q. Yang, X. Cheng, C. Gao, B. Wang, Z. Wang and S. Gao, Cryst. Growth Des., 2015, 15, 2565 CrossRef CAS; (c) K. Takahashi, K. Kawamukai, M. Okai, T. Mochida, T. Sakurai, H. Ohta, T. Yamamoto, Y. Einaga, Y. Shiota and K. Yoshizawa, Chem.–Eur. J., 2016, 22, 1253 CrossRef CAS PubMed.
- (a) I. Bernal, I. M. Jensen, K. B. Jensen, C. J. McKenzie, H. Toftlund and J.-P. Tuchagues, J. Chem. Soc., Dalton Trans., 1995, 3667 RSC; (b) V. Balland, F. Banse, E. Anxolabéhère-Mallart, M. Nierlich and J.-J. Girerd, Eur. J. Inorg. Chem., 2003, 2529 CrossRef CAS; (c) J. England, G. J. P. Britovsek, N. Rabadia and A. J. P. White, Inorg. Chem., 2007, 46, 3752 CrossRef CAS PubMed.
- W. Linert, M. Konecny and F. Renz, J. Chem. Soc., Dalton Trans., 1994, 1523 RSC.
- Z. Ni, A. M. McDaniel and M. P. Shores, Chem. Sci., 2010, 1, 615 RSC.
- B. Strauß, V. Gutmann and W. Linert, Monatsh. Chem., 1993, 124, 391 CrossRef.
- (a) J. S. Brinen, J. G. Koren, H. D. Olmstead and R. C. Hirt, J. Phys. Chem., 1965, 69, 3791 CrossRef CAS; (b) C. Dubroca, Chem. Phys. Lett., 1972, 15, 207 CrossRef CAS; (c) H. R. Chang, J. K. McCusker, H. Toftlund, S. R. Wilson, A. X. Trautwein, H. Winkler and D. N. Hendrickson, J. Am. Chem. Soc., 1990, 112, 6814 CrossRef CAS; (d) P. Mialane, A. Nivorojkine, G. Pratviel, L. Azéma, M. Slany, F. Godde, A. Simaan, F. Banse, T. Kargar-Grisel, G. Bouchoux, J. Sainton, O. Horner, J. Guilhem, L. Tchertanova, B. Meunier and J.-J. Girerd, Inorg. Chem., 1999, 38, 1085 CrossRef CAS PubMed.
- C. J. Johnson, G. G. Morgan and M. Albrecht, J. Mater. Chem. C, 2015, 3, 7883 RSC.
- (a) V. Gutmann and D. Wychera, Inorg. Nucl. Chem. Lett., 1966, 2, 257 CrossRef CAS; (b) J. W. Turner and F. A. Schultz, Inorg. Chem., 2001, 40, 5296 CrossRef CAS PubMed; (c) L. J. Kershaw Cook, R. Mohammed, G. Sherborne, T. D. Roberts, S. Alvarez and M. A. Halcrow, Coord. Chem. Rev., 2015, 289–290, 2 CrossRef CAS.
- (a) D. F. Evans, J. Chem. Soc., 1959, 2003 RSC; (b) E. M. Schubert, J. Chem. Educ., 1992, 69, 62 CrossRef CAS.
- B. Weber and F. A. Walker, Inorg. Chem., 2007, 46, 6794 CrossRef CAS PubMed.
- The equation used to simulate the data is provided in the Experimental section in the ESI;† see ref. 36 for further details.
- H. Toftlund and J. J. McGarvey, Top. Curr. Chem., 2004, 233, 151 CrossRef CAS.
- The temperature coefficient of the chemical shift (CT) is defined as the slope of a linear fit to the data of a chemical shift vs. temperature (δ vs. T) plot.
Footnote |
| † Electronic supplementary information (ESI) available: Experimental details, additional crystallographic, magnetic, and spectroscopic data, and crystallographic information files (CIFs) for 1a·0.5CH3CN, 1b, 2a, 2b, and 3a. CCDC 1505471–1505473, 1505534, and 1505863. For ESI and crystallographic data in CIF or other electronic format see DOI: 10.1039/c6sc04287b |
| This journal is © The Royal Society of Chemistry 2017 |