 Open Access Article
Targeting cancer cell metabolism with mitochondria-immobilized phosphorescent cyclometalated iridium(III) complexes†
Jian-Jun
Cao
a,
Cai-Ping
Tan
*a,
Mu-He
Chen
a,
Na
Wu
a,
De-Yang
Yao
b,
Xing-Guo
Liu
b,
Liang-Nian
Ji
a and
Zong-Wan
Mao
*a
aMOE Key Laboratory of Bioinorganic and Synthetic Chemistry, School of Chemistry and Chemical Engineering, Sun Yat-Sen University, Guangzhou 510275, P. R. China. E-mail: tancaip@mail.sysu.edu.cn; cesmzw@mail.sysu.edu.cn
bKey Laboratory of Regenerative Biology, Guangdong Provincial Key Laboratory of Stem Cell and Regenerative Medicine, South China Institute for Stem Cell Biology and Regenerative Medicine, Guangzhou Institutes of Biomedicine and Health, Chinese Academy of Sciences, Guangzhou, People's Republic of China
First published on 22nd August 2016
Abstract
Cancer cell metabolism is reprogrammed to sustain the high metabolic demands of cell proliferation. Recently, emerging studies have shown that mitochondrial metabolism is a potential target for cancer therapy. Herein, four mitochondria-targeted phosphorescent cyclometalated iridium(III) complexes have been designed and synthesized. Complexes 2 and 4, containing reactive chloromethyl groups for mitochondrial fixation, show much higher cytotoxicity than complexes 1 and 3 without mitochondria-immobilization properties against the cancer cells screened. Further studies show that complexes 2 and 4 induce caspase-dependent apoptosis through mitochondrial damage, cellular ATP depletion, mitochondrial respiration inhibition and reactive oxygen species (ROS) elevation. The phosphorescence of complexes 2 and 4 can be utilized to monitor the perinuclear clustering of mitochondria in real time, which provides a reliable and convenient method for in situ monitoring of the therapeutic effect and gives hints for the investigation of anticancer mechanisms. Genome-wide transcriptional analysis shows that complex 2 exerts its anticancer activity through metabolism repression and multiple cell death signalling pathways. Our work provides a strategy for the construction of highly effective anticancer agents targeting mitochondrial metabolism through rational modification of phosphorescent iridium complexes.
Introduction
The success of platinum-based drugs in the past few decades has stimulated great interest in the search for other metal-based anticancer agents.1 Non-platinum anticancer drugs act through multiple mechanisms, different from those of platinum drugs.2,3 These drugs are expected to have the capability to overcome platinum resistance and reduce side effects.4,5 Very recently, organometallic iridium complexes have emerged as potential candidates for new metallo-anticancer drugs.6 As demonstrated by Sadler and Meggers et al., organometallic iridium complexes can exert their anticancer activity through multiple mechanisms, which include catalyzing cellular redox reactions7,8 and inhibiting enzyme activities.9,10 Additionally, cyclometalated iridium(III) complexes have rich photophysical properties, e.g., high quantum yields, large Stokes shifts, long-lived luminescence, good photostability and cell permeability. They have attracted increasing attention in bioimaging and biosensing applications.11–15 Our group has endeavoured to combine the unique photophysical and anticancer properties of phosphorescent cyclometalated Ir(III) complexes to construct novel multifunctional theranostic platforms that can induce and monitor the therapeutic response simultaneously.16–19The central metabolic pathways operating in malignant cells are different from those in normal cells.20,21 The alteration in cancer cell metabolism is important for oncogene revolution, tumorigenesis and tumour cell proliferation.22–24 Compared with their normal counterparts, tumour cells are characterized by a metabolic phenotype with a shift from ATP generation through oxidative phosphorylation to ATP generation through glycolysis even under normal oxygen concentrations.20 As mitochondria have well-recognized roles in the production of ATP and the intermediates needed for macromolecule biosynthesis, targeting mitochondria metabolism has emerged as a very effective strategy to kill cancer cells selectively.25
Mitochondria also play a vital role in a variety of cellular processes, such as cell death regulation, calcium modulation and redox signalling.26,27 Cancer cells exhibit various degrees of alterations to mitochondrial function, e.g., a higher mitochondrial membrane potential (MMP) and increased oxidative stress, which provides opportunities to target cancer cell mitochondria for an optimal therapeutic outcome.28
Moreover, there has been growing interest in developing emissive mitochondria-targeted multifunctional theranostic agents that can monitor changes in the mitochondrial physiological status during the therapeutic process.17,29,30 However, reports elucidating the consequence of targeting anticancer metal complexes to mitochondria are limited.31,32
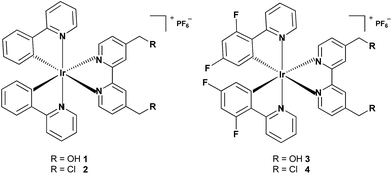
In this work, four cyclometalated iridium(III) complexes, [Ir(N–C)2(N–N)](PF6) (N–N = (2,2′-bipyridine)-4,4′-diyldimethanol (L1) or 4,4′-bis(chloromethyl)-2,2′-bipyridine (L2); N–C = 2-phenylpyridine (ppy) or 2-(2,4-difluorophenyl)pyridine (dfppy)), were designed and synthesized (Scheme 1). Due to their positive charge and lipophilicity, 1–4 were anticipated to accumulate in mitochondria. The reactive chloromethyl subunits were expected to immobilize 2 and 4 within mitochondria as the result of nucleophilic substitution with reactive thiols present in various mitochondrial proteins.33,34 Complexes 1 and 3 incorporating non-reactive hydroxymethyl groups were used as controls. The in vitro antiproliferative activities of 1–4 were investigated against several cancer cell lines as well as a human normal cell line. The anticancer properties of the mitochondria-immobilized complexes 2 and 4, which included mitochondrial damage, cellular ATP depletion, inhibition of mitochondrial respiration, reactive oxygen species (ROS) elevation and induction of apoptosis, were explored using a variety of methods. Time-dependent tracking of the mitochondrial morphology was carried out for 2- and 4-treated cells. Additionally, the possible anticancer mechanisms of complex 2 were elucidated by analysis of genome-wide gene expression profiles.
Results and discussion
Synthesis, characterization and stability
Complexes 1–4 were obtained by refluxing two equivalents of ligands and the corresponding cyclometalated Ir(III) dimers in CH2Cl2/CH3OH (1![[thin space (1/6-em)]](https://www.rsc.org/images/entities/char_2009.gif) :
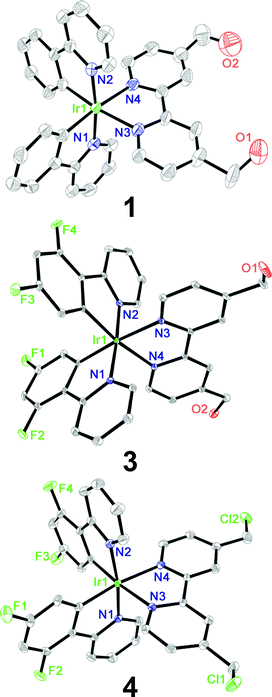
:![[thin space (1/6-em)]](https://www.rsc.org/images/entities/char_2009.gif) 1, v/v) followed by anion exchange with NH4PF6 and purification by column chromatography on silica gel. Pure products of 1–4 obtained in high yields by recrystallization were characterized by 1H NMR spectroscopy (Fig. S1–S4†), ESI-MS and elemental analysis (ESI†). Complexes 1, 3 and 4 were characterized by X-ray crystallography (Fig. 1, Tables S1 and S2†). The Ir atoms have a distorted octahedral coordination geometry and the largest deviation is represented by the bite angle (from 76.4° to 76.9°) of the bipyridine ligand. The two Ir–C bonds are in a mutual cis arrangement, and their high trans influence renders slightly shorter Ir–N bond lengths in the C–N ligands than those in the cyclometalating N–N ligands. These findings are commonly observed for related cyclometalated Ir(III) complexes.18,35
1, v/v) followed by anion exchange with NH4PF6 and purification by column chromatography on silica gel. Pure products of 1–4 obtained in high yields by recrystallization were characterized by 1H NMR spectroscopy (Fig. S1–S4†), ESI-MS and elemental analysis (ESI†). Complexes 1, 3 and 4 were characterized by X-ray crystallography (Fig. 1, Tables S1 and S2†). The Ir atoms have a distorted octahedral coordination geometry and the largest deviation is represented by the bite angle (from 76.4° to 76.9°) of the bipyridine ligand. The two Ir–C bonds are in a mutual cis arrangement, and their high trans influence renders slightly shorter Ir–N bond lengths in the C–N ligands than those in the cyclometalating N–N ligands. These findings are commonly observed for related cyclometalated Ir(III) complexes.18,35
The absorption spectra of complexes 1–4 in phosphate buffer saline (PBS), CH3CN and CH2Cl2 are characterized by multiple bands (Fig. 2A and S5†). The high-energy bands (<350 nm) are assigned to spin-allowed ligand-centered (1LC) π–π* transitions for cyclometalated (C–N) and ancillary (N–N) ligands. The relatively low-energy bands can be assigned to the mixed singlet and triplet metal-to-ligand charge-transfer (1MLCT and 3MLCT) and ligand-to-ligand charge-transfer (LLCT) transitions.11,18,36 Upon excitation at 405 nm, complexes 1–4 exhibit long-lived green to red phosphorescence (Fig. 2B, S6 and Table S3†). The emission lifetimes of 1–4 in PBS, CH3CN and CH2Cl2 fall in the range between 32 and 327 ns, indicating the phosphorescent nature of the emissions. The emission lifetimes and quantum yields of 1–4 are sensitive to solvent polarity. Generally, the emission quantum yields and lifetimes of 1–4 increase upon decreasing the solvent polarity, which is also observed for other related phosphorescent Ir(III) complexes.37
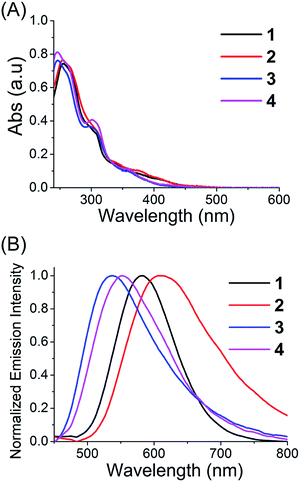 | ||
| Fig. 2 (A) UV/Vis spectra of complexes 1–4 measured in CH3CN at 25 °C. (B) Emission spectra of complexes 1–4 measured in CH3CN at 25 °C. The excitation wavelength is 405 nm. | ||
As the reactive chloromethyl groups may undergo hydrolysis in aqueous solutions, we chose complex 2 to evaluate its stability in a DMSO-d6 and D2O mixture (v/v, 7/3) at 37 °C. The results show that about 98.5% of complex 2 is invariant after 48 h incubation at 37 °C, as verified by 1H NMR spectroscopy (Fig. S7†). After 7 days, about 26.2% of complex 2 is transformed, which may be attributed to the hydrolysis of the chloromethyl groups.
In vitro cytotoxicity and selective killing of cancer cells
The in vitro cytotoxicity of complexes 1–4 and cisplatin was determined against human cervical carcinoma (HeLa), human lung carcinoma (A549), cisplatin-resistant A549 (A549R), human breast cancer (MDB-MA-231), human prostate carcinoma (PC3) and human normal liver (LO2) cells by a 3-(4,5-dimethylthiazol-2-yl)-2,5-diphenyltetrazolium bromide (MTT) assay after 48 h treatment. Complexes 2 and 4, with IC50 values ranging from 0.2 to 1.8 μM, show much higher cytotoxicity than complexes 1, 3 and cisplatin against all the human cancer cell lines tested (Table 1). Complexes 2 and 4 are highly cytotoxic against cisplatin-resistant A549R cells, indicating they are not cross-resistant with cisplatin.| Compounds | IC50a (μM) | |||||
|---|---|---|---|---|---|---|
| HeLa | A549 | A549R | MDB-MA-231 | PC3 | LO2 | |
| a Cells were incubated with the indicated compounds for 48 h. Data are presented as the means ± standard deviations (SD), and cell viability was assessed after 48 h of incubation. | ||||||
| 1 | 10.0 ± 0.9 | 24.0 ± 2.0 | 42.2 ± 2.7 | 24.5 ± 1.9 | >100 | >100 |
| 2 | 0.52 ± 0.04 | 0.40 ± 0.02 | 0.64 ± 0.04 | 0.33 ± 0.02 | 1.4 ± 0.1 | 4.5 ± 0.3 |
| 3 | 2.7 ± 0.2 | 16.8 ± 1.2 | 17.8 ± 1.4 | 12.3 ± 1.1 | 38.0 ± 1.9 | 8.1 ± 0.5 |
| 4 | 1.8 ± 0.1 | 0.21 ± 0.02 | 0.74 ± 0.05 | 0.66 ± 0.05 | 1.04 ± 0.09 | 1.5 ± 0.1 |
| Cisplatin | 18.8 ± 1.4 | 22.4 ± 2.0 | 120.2 ± 6.5 | 27.5 ± 2.5 | 23.8 ± 2.0 | 26.9 ± 1.9 |
Notably, a relatively high selectivity for cancer cells is observed for complex 2. For example, it shows approximately an 11 fold higher selectivity for cancerous A549 cells over noncancerous LO2 cells. A co-culture model of LO2 and A549 cells was used to further demonstrate the capability of complex 2 to selectively kill cancer cells (Fig. S8†). The nuclei of A549 cells were prelabeled with Hoechst 33![[thin space (1/6-em)]](https://www.rsc.org/images/entities/char_2009.gif) 342 (2′-(4-ethoxyphenyl)-5-(4-methyl-1-piperazinyl)-2,5′-bi-1H-benzimidazole trihydrochloride). After the cocultured cells are treated with 2, most of the A549 cells (blue nuclei) are stained positively by both annexin V and PI, while the LO2 cells are still viable. The hyperchromatic nuclei of the A549 cells indicate that 2 mainly induces apoptotic cell death.
342 (2′-(4-ethoxyphenyl)-5-(4-methyl-1-piperazinyl)-2,5′-bi-1H-benzimidazole trihydrochloride). After the cocultured cells are treated with 2, most of the A549 cells (blue nuclei) are stained positively by both annexin V and PI, while the LO2 cells are still viable. The hyperchromatic nuclei of the A549 cells indicate that 2 mainly induces apoptotic cell death.
Lipophilicity, cellular uptake and localization
It has been reported that the cellular uptake behaviour of metal complexes is usually related to many factors, e.g., lipophilicity, molecular size and substitute groups.18,38,39 The lipophilicity is referred to as log![[thin space (1/6-em)]](https://www.rsc.org/images/entities/char_2009.gif) Po/w (where Po/w = the octanol/water partition coefficient). The log
Po/w (where Po/w = the octanol/water partition coefficient). The log![[thin space (1/6-em)]](https://www.rsc.org/images/entities/char_2009.gif) Po/w values, determined by a classical shake-flask method, for 1, 2, 3 and 4 are 0.23, 1.28, 1.09 and 2.12, respectively.
Po/w values, determined by a classical shake-flask method, for 1, 2, 3 and 4 are 0.23, 1.28, 1.09 and 2.12, respectively.
As iridium is an exogenous element, the cellular uptake levels of Ir(III) can be quantitatively determined by inductively coupled plasma-mass spectrometry (ICP-MS). The cellular uptake efficacy is influenced by the lipophilicity and the substitution groups on the N–N ligand (Table S4†). It should be noted that complexes 2 and 4 with the chloromethyl substituents show a much higher cellular uptake efficacy than 1 and 3 containing the hydroxymethyl groups.
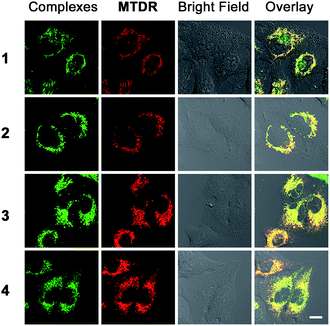
The localization of 1–4 in A549 cells was investigated by laser scanning confocal microscopy. All the complexes can be visualized in the A549 cells after 1 h incubation (Fig. S9†). The phosphorescence of 1–4 shows distinct filamentous and punctate patterns. Colocalization experiments of 1–4 with the mitochondrion-specific fluorescent probe MitoTracker Deep Red (MTDR) show that 1–4 can specifically localize to mitochondria (Fig. 3). The Pearson's colocalization coefficients obtained for 1–4 with MTDR are 0.74, 0.84, 0.87 and 0.82, respectively. Similar results are also observed for 2 and 4 by high resolution confocal scanning laser microscopy (Fig. S10†). However, negligible colocalization of 1–4 with LysoTracker Deep Red (LTDR) can be detected (Fig. S11†). To further verify the distribution of 1–4 in different cellular compartments, the mitochondrial, cytosolic and nuclear fractions were isolated from A549 cells treated with complexes 1–4 (Fig. S12†). As measured by ICP-MS, the content of iridium in the mitochondria is much higher than that obtained in the cytosol and nuclei. These results collectively indicate that complexes 1–4 can specifically target mitochondria in A549 cells.
We further investigated the cellular uptake mechanisms of 1–4. Incubation of A549 cells with 1–4 at a lower temperature (4 °C) results in a reduced cellular uptake efficiency as revealed by confocal microscopy (Fig. S13–16†). Pretreatment of the cells with metabolic inhibitors, 2-deoxy-D-glucose and oligomycin, can lower the cellular uptake levels of these complexes, while the endocytosis modulator chloroquine shows no effect on the ability of complexes to cross the plasma membrane. The results suggest that complexes 1–4 penetrate the cell membrane mainly through an energy-dependent mechanism and do not rely on the endocytic pathways.40
Mitochondrial immobilization
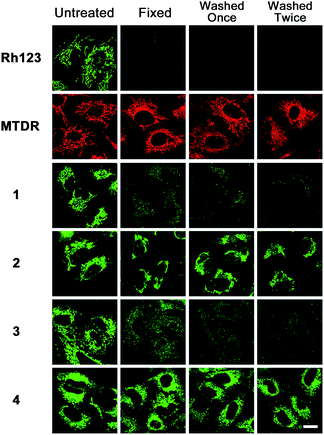
As complexes 2 and 4 contain chloromethyl groups, they are supposed to react with thiol groups of cysteine residues in proteins and peptides in cells to form stable covalent bonds.34 MitoTracker™ probes, commercial thiol reactive mitochondrial dyes containing chloromethyl groups, can be retained during cell fixation.33 Similar to that observed for MTDR, the emission of complexes 2 and 4 is retained in cells after the cells are fixed and washed (Fig. 4). Rhodamine 123, a conventional mitochondrial dye, is easily washed out once the MMP is lost.41 As expected, the emission of Rhodamine 123, and complexes 1 and 3 is barely detectable in cells under the same conditions. The higher cytotoxicity of 2 and 4 compared with 1 and 3 is correlated with their higher uptake efficacy, which may be at least partially attributed to their immobilization and prolonged retention time in mitochondria.The ability of 1–4 to undergo covalent conjugation to intracellular proteins was also confirmed by gel electrophoresis, which separates the proteins purified under denaturing conditions from lysed A549 cells treated with Ir(III) (Fig. S17†). Distinct emissive protein bands can be observed in the gel-separated denatured protein mixtures isolated from 2- and 4-treated cells. Meanwhile, no emissive bands are detected in proteins isolated from 1- and 3-treated cells. Similar results are observed in vitro using bovine serum albumin (BSA) as a model protein that contains one free cysteine residue (Fig. S18†). The interactions of complexes 1–4 with BSA have also been investigated using tryptophan fluorescence quenching experiments (Fig. S19†). The Stern–Volmer constants (KSV) determined for 1, 2, 3 and 4 are 7.0 × 10⁴, 1.1 × 10⁵, 7.2 × 10⁴ and 8.5 × 10⁴ M−1, respectively. Accordingly, an increase in the emission intensities is observed for 1–4 upon binding with BSA (Fig. S20†). Complex 2 displays approximately an 11.6-fold emission enhancement when the molar ratio of BSA and Ir(III) reaches 8![[thin space (1/6-em)]](https://www.rsc.org/images/entities/char_2009.gif) :
:![[thin space (1/6-em)]](https://www.rsc.org/images/entities/char_2009.gif) 1. The enhancement in emission intensities can be attributed to the hydrophobic environment in the binding pockets of proteins, which is favourable for their imaging applications.37 These results indicate that complexes 2 and 4 can be immobilized on mitochondria by covalent interactions with proteins.
1. The enhancement in emission intensities can be attributed to the hydrophobic environment in the binding pockets of proteins, which is favourable for their imaging applications.37 These results indicate that complexes 2 and 4 can be immobilized on mitochondria by covalent interactions with proteins.
Induction of mitochondrial dysfunction
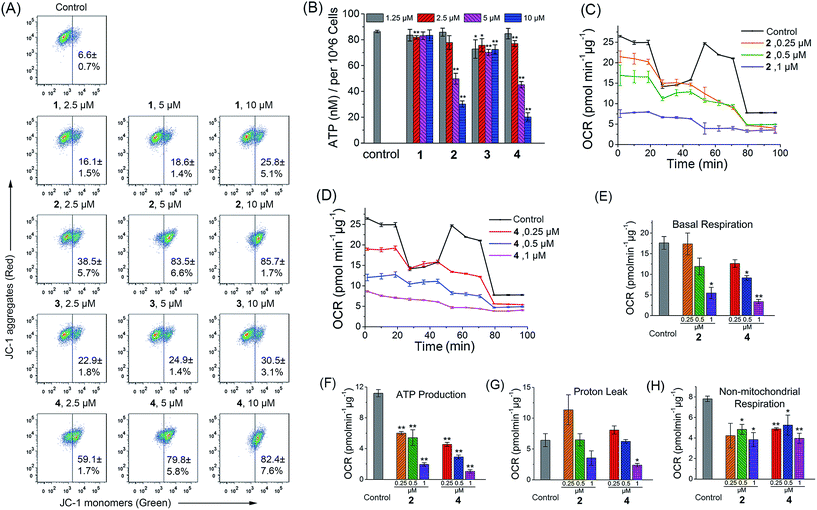
As complexes 1–4 could be localized to mitochondria, their impact on mitochondrial integrity was monitored by detecting the changes in MMP (ΔΨm). The red/green fluorescence of 5,5′,6,6′-tetrachloro-1,1′-3,3′-tetraethyl-benzimidazolylcarbocyanine iodide (JC-1), a mitochondria-selective aggregate dye, was detected by flow cytometry (Fig. 5A) and confocal microscopy (Fig. S21†).42 At low membrane potentials, JC-1 exists in the form of the “J-monomer” with green fluorescence. At high membrane potentials, JC-1 forms “J-aggregates” and displays red fluorescence. The control cells show red fluorescence, which indicates that the mitochondrial membranes retain a high voltage. The capability of these complexes to depolarize mitochondria is correlated with their cytotoxicity. In cells treated with 1 and 3, a small portion of cells lose their ΔΨm. Complexes 2 and 4 cause a marked decrease in MMP, as evidenced by the fluorescence shift from red to green. After a 6 h treatment, the percentage of cells with mitochondrial membrane depolarization increases from 6.6 ± 0.7% to 85.7 ± 1.7% and 82.4 ± 7.6% for 2 (10 μM, 6 h) and 4 (10 μM, 6 h), respectively.To further investigate the effects of complexes 1–4 on the mitochondrial metabolic status, we measured their impact on the intracellular ATP level and mitochondrial respiration. The capability of 1–4 to reduce the ATP content in A549 cells is correlated with their cytotoxicity (Fig. 5B). The impact of complexes 1 and 3 on intracellular ATP levels is not obvious. Meanwhile, complexes 2 and 4 cause a significant dose-dependent decrease in ATP production as compared with the control cells. At a concentration of 10 μM, the ATP levels decrease from 86.3 ± 1.0 to 30.2 ± 2.4 and 20.2 ± 3.3 nM for 2 and 4, respectively.
Complexes 2 and 4 were chosen as model compounds to further investigate their impact on the mitochondrial bioenergetic status. Mitochondrial respiration was quantified by measuring the oxygen consumption rate (OCR) directly using a Seahorse XF24 Extracellular Flux Analyzer.43 Several key parameters were measured to assess mitochondrial oxidative phosphorylation (OXPHOS) by using modulators of respiration that target components of the electron transport chain (ETC) (Fig. 5C and D). Cells treated with 2 and 4 display a decrease in basal OCR (Fig. 5E). The mitochondrial respiration comprises coupled respiration for ATP synthesis and uncoupled respiration to drive the futile cycle of proton pumping and proton leak back across the inner mitochondrial membrane.44 The coupled respiration and proton leak were determined using the ATP synthase inhibitor oligomycin. Cells treated with 2 and 4 show a dose-dependent decrease in ATP production as compared with the control cells (Fig. 5F). Proton leak is increased at a lower concentration (0.25 μM) with a decline observed at higher concentrations (1 μM) (Fig. 5G). After injection of the carbonyl cyanide 4-(trifluoromethoxy)phenylhydrazone (FCCP), a potent mitochondrial uncoupling agent that can dissipate the proton gradient and eliminate the control of respiration by ATP synthase, a decrease in the OCR peak of Ir(III)-treated cells is observed as compared with the resilient control cells. The observation suggests that the Ir(III)-treated cells have lost their spare respiratory capacity.45 Then, a mixture of antimycin A (a mitochondrial complex III inhibitor) and rotenone (a mitochondrial complex I inhibitor), which can shut down the mitochondrial respiratory chain thoroughly, was injected to determine the fraction of non-mitochondrial O2 consumption including substrate oxidation and cell surface oxygen consumption. A decrease in non-mitochondrial respiration is detected in cells treated with 2 and 4 (Fig. 5H). These results collectively indicate that the inhibition of both mitochondrial and non-mitochondrial respiration contributes to the cytotoxicity of 2 and 4.
Real-time tracking of mitochondrial morphology
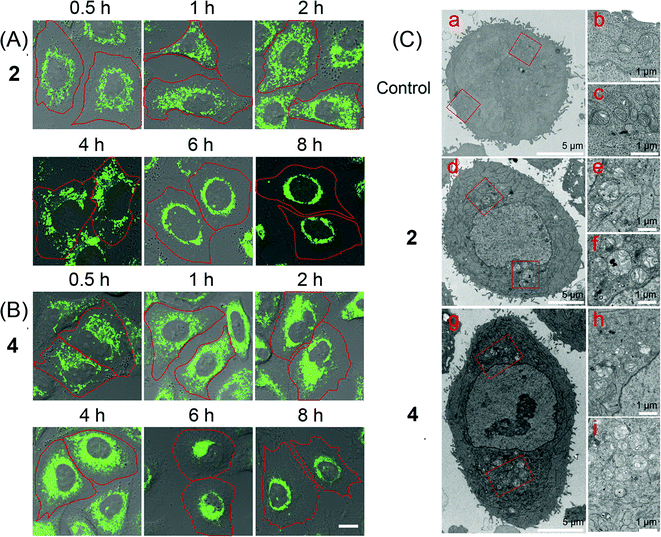
Mitochondria are highly dynamic organelles that undergo constant fusion and fission. Mitochondria are actively transported in cells, which is essential for maintaining physiological functions of cells.46 However, the molecular mechanisms regulating these behaviours have not been well understood yet. Thus, tracking the changes in mitochondrial morphology may give insight into the investigation of cell death mechanisms.47 Real-time tracking of the mitochondrial morphology was carried out by monitoring the emission of 2 and 4 in A549 cells using confocal microscopy (Fig. 6A and B). A549 cells can be effectively labelled by 2 and 4 after 0.5 h incubation, when mitochondria show the normal tubular network and distribution. Prolonged incubation causes a collapse of the normal tubular mitochondrial network into mitochondrial aggregates and large perinuclear clusters. Mitochondrial swelling, fragmentation and perinuclear clustering in cells treated with 2 and 4 are also confirmed by transmission electron microscopy (TEM, Fig. 6C). It can be seen that in control cells, mitochondria are distributed evenly in the cytoplasm. In Ir(III)-treated cells, the fragmented mitochondria tend to localize around the nucleus.Intracellular ROS detection
Apart from producing energy, mitochondria are also a major source of ROS. Mitochondrial damage and intracellular ROS production are closely related.27 Intracellular ROS elevation induced by complexes 1–4 was detected by flow cytometry and confocal microscopy with 2′,7′-dichlorodihydrofluorescein diacetate (H2DCFDA) staining. H2DCFDA can be converted to the highly fluorescent 2′,7′-dichlorofluorescein (DCF) by cellular ROS.48 After a 6 h treatment, a dramatic concentration-dependent ROS elevation is observed for 2- and 4-treated A549 cells. At a concentration of 10 μM, treatment with 2 and 4 increases the mean fluorescent intensity (MFI) by approximately 5.5- and 13.7-fold, respectively (Fig. 7). Similar results are also obtained by confocal microscopy, with markedly concentration-dependent increases in the intensity of the DCF fluorescence observed in 2- and 4-treated cells (Fig. S22†). Additionally, pre-treatment of A549 cells with N-acetyl-L-cysteine (NAC), a ROS scavenger, significantly diminishes the antiproliferative potency of 2 and 4 (Fig. S23†). These results indicate that 2 and 4 induce ROS-dependent cell death.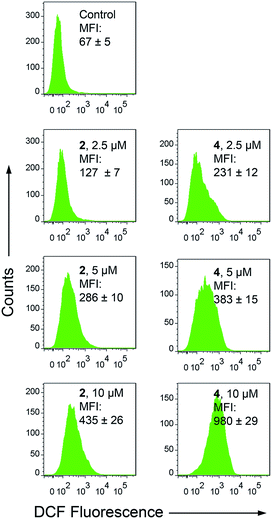 | ||
| Fig. 7 Intracellular ROS production measured by DCF fluorescence (λex = 488 nm, λem = 530 ± 30 nm) with flow cytometry. A549 cells were treated with 2 and 4 at the indicated concentrations for 6 h. | ||
Cell cycle arrest and induction of apoptosis
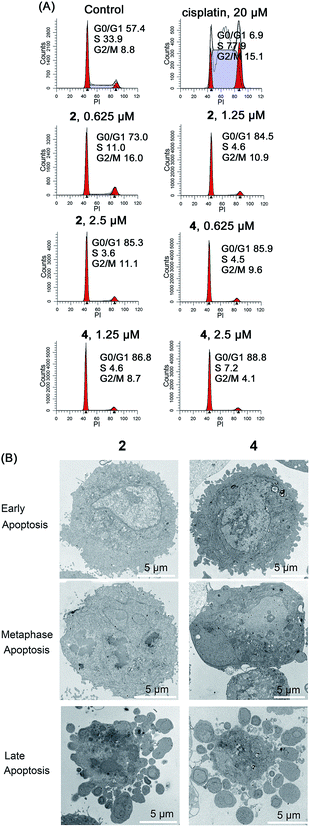
In addition to their role as ATP generators, mitochondria mediate essential cell functions such as cell-cycle control and apoptosis.49 Cell cycle arrest may occur in response to the blockage of macromolecule biosynthesis caused by a lack of ATP production and mitochondrial dysfunction.50 Mitochondria play a key role in apoptosis by regulating the release of cytochrome c and other pro-apoptotic proteins from the space between the inner and outer mitochondrial membranes to the cytosol.26Cell cycle arrest in A549 cells induced by 2 and 4 was analyzed by flow cytometry using propidium iodide (PI) staining (Fig. 8A). Complexes 2 and 4 cause a dose-dependent G0/G1 cell cycle arrest. After treatment with Ir(III) for 24 h, the percentage of cells in the G0/G1 phase increases from 57.4 ± 3.1% (control) to 85.3 ± 4.4% and 88.8 ± 5.2% for 2 (2.5 μM) and 4 (2.5 μM), respectively.
The morphology of apoptotic cells is characterized by cell shrinkage, nuclear fragmentation, chromatin condensation and membrane blebbing.51 First, the ultrastructural changes in the morphology of cells were examined by TEM (Fig. 8B). The control cells show a normal morphology. In contrast, the cells treated with 2 and 4 show obvious morphological evidence of different stages of apoptosis including condensed chromatin, nuclear fragmentation and apoptotic bodies. In addition, similar phenomena are also observed in Ir(III)-treated A549 cells stained with Hoechst 33![[thin space (1/6-em)]](https://www.rsc.org/images/entities/char_2009.gif) 342 (Fig. S24†). The control cells exhibit homogeneous nuclear staining, and the Ir(III)-treated cells display typical apoptotic changes, e.g., bright staining, condensed chromatin and fragmented nuclei.
342 (Fig. S24†). The control cells exhibit homogeneous nuclear staining, and the Ir(III)-treated cells display typical apoptotic changes, e.g., bright staining, condensed chromatin and fragmented nuclei.
The activation of caspases is one of the best recognized biochemical hallmarks of apoptosis.52 The effect of Ir(III) treatment on caspase-3/7 activity was determined using the Caspase-Glo assay. Treatment of A549 cells with 2 and 4 stimulates the activation of caspase-3/7 in a dose-dependent manner (Fig. S25†). After a 12 h treatment at a concentration of 10 μM, the activity of caspase-3/7 is increased by approximately 1.6- and 1.7-fold in 2- and 4-treated cells, respectively. Similar to that observed for cisplatin, pre-treatment of the cells with the pan-caspase inhibitor, z-VAD-fmk, inhibits the antiproliferative activity of 2 and 4 (Fig. S26†).
During apoptosis, phosphatidylserine (PS) is exposed externally due to loss of the asymmetry of plasma membrane phospholipids, and externalized phosphatidylserine emits eat-me signals to neighboring cells.51 The percentage of apoptotic cells was determined by annexin V and PI double labeling, measured by flow cytometry (Fig. S27†) and confocal microscopy (Fig. S28†). After treatment of cells with 2 and 4 for 24 h, the percentages of cells in both the early apoptotic (annexin V-positive and PI-negative) and the late/necrotic (annexin V-positive and PI-positive) stages increase dose-dependently. After 24 h of treatment, apoptotic cells increase from 1.4 ± 0.02% to 17.5 ± 0.8% and 61.5 ± 1.1% for 2 (10 μM) and 4 (10 μM), respectively. Moreover, pre-treatment of A549 cells with NAC decreases the apoptosis-inducing capability of 2 and 4 (Fig. S27†). These results collectively indicate that 2 and 4 induce caspase-dependent and ROS-mediated apoptotic cell death.
Microarray analysis
Complex 2 shows comparable cytotoxicity to complex 4 against the cancer cells tested, while it is less cytotoxic towards normal LO2 cells. We chose complex 2 as the model compound for microarray analysis to further elucidate the underlying mechanisms. Genome-wide gene transcriptional profiles of 2-treated cells were determined by Affymetrix human U133 plus 2.0 microarray analysis in triplicate runs (Table S5†). 507 gene sets are identified as being up-regulated and 715 gene sets are down-regulated by more than two-fold in 2-treated A549 cells (Table S6†). The heat shock 70 kDa protein 6 (HSP70B′) gene, is markedly increased (about 79-fold). HSPs are anti-apoptotic proteins, their expression can be induced in response to anti-cancer chemotherapy, and HSP70 can also prevent both caspase-dependent and caspase-independent cell death.53 The elevated expression of HSP70B′ confirms that 2 initiates apoptotic machinery in A549 cells. The mitochondrion-encoded critical subunits I, II and III of cytochrome c oxidase (COX1, COX2 and COX3) decrease significantly with up to a 15-fold decrease observed for COX1. The decrease in transcription of these genes in the respiratory chain confirms that treatment with 2 causes dysfunction of aerobic respiration.In order to identify the possible anticancer mechanisms, a connectivity map (Cmap, http://www.broad.mit.edu/cmap/), which contains genome-wide transcriptional expression data from a panel of cell lines treated with a library of 1309 bioactive small molecules, was used to analyze the list of transcripts regulated by 2.55 The results of the Cmap analysis in the case of 2 are summarized in Table S7.† A high correlation is obtained with 2 and pyrvinium, which can inhibit the mitochondrial respiration.56
To mine the core biological functions from the enormous dataset of a microarray, the impacted genes have been divided into three Gene Ontology (GO) database categories: biological process, cellular component and molecular function. Using the predefined gene sets by gene ontology, there are 43 pathways that are significantly enriched with the differentially expressed genes from the 2-treated group (Table S8†). Treatment with 2 influences several important biological processes such as the mitotic cell cycle, mitotic nuclear division and DNA replication.
The regulated genes derived from microarray experiments were analyzed by a web-based bioinformatics tool, DAVID (database for annotation, visualization, and integrated discovery).54 The modulation of cell signalling pathways by 2 is summarized in Table S9.† The results suggest that 2 affects several pathways known to regulate cell death, including the cell cycle, DNA replication and the p53 signalling pathway. The mitochondrion is a central metabolic organelle, and it executes critical functions for the metabolism of fatty acids, amino acids and nucleotides. Treatment with 2 influences metabolic pathways related to mitochondrial functions, such as D-glutamine and D-glutamate metabolism, alanine, aspartate and glutamate metabolism and pyrimidine metabolism. These findings are consistent with the experimental results.
In order to further confirm that 2-induced cell death occurs through mitochondrial dysfunction, cell cycle perturbation and apoptosis, we validate the differential expression of 21 genes involved in several key pathways (mitochondrial metabolism, the p53 signalling pathway and the cell cycle) in response to 2-treatment by quantitative real-time PCR (RT-PCR). The primer sequences of the selected genes studied in RT-PCR are listed in Table S10,† and the functions of these genes are listed in Table S11.† The heat map of the 2-induced expression profile of A549 cells to the untreated control is shown in Fig. S30.† The fold changes of expression as determined by RT-PCR for these genes are concordant with those obtained by microarray analysis (Fig. S31†). Based on the results of bioinformatic analyses, the proposed anticancer mechanisms of action of 2 are depicted in Fig. S32.† The cytotoxicity of 2 is suggested to be related to mitochondrial damage, elevation of ROS, initiation of DNA damage responses, cell cycle arrest and induction of apoptosis.
Conclusions
In summary, four cyclometalated Ir(III) complexes with 4′,4′-substituted 2′,2′-bipyridyl ligands have been developed as mitochondria-targeted anticancer agents. Among them, complexes 2 and 4 containing a reactive chloromethyl group can be fixed on mitochondria through nucleophilic substitution with reactive thiols present in mitochondrial proteins. The immobilization of complexes 2 and 4 on mitochondria results in a much higher cytotoxicity than the non-fixable complexes 1 and 3, which may attributed to their higher cellular penetration capability as well as a longer retention time on mitochondria. Mechanism studies show that 2 and 4 mainly induce caspase- and ROS-mediated apoptotic cell death. Complexes 2 and 4 can lower the intracellular ATP levels, attenuate the mitochondrial bioenergetic function and induce mitochondrial depolarization. Interestingly, complexes 2 and 4 can be also utilized to monitor mitochondrial morphological changes, which provides the possibility for in situ monitoring of the therapeutic effect, and gives insights into their anticancer mechanisms. Moreover, complex 2 can selectively kill cancer cells over normal cells. Overall, our work shows that targeting mitochondrial metabolism by immobilization is a very effective strategy for the construction of multifunctional phosphorescent metal complexes with enhanced anticancer activity and selectivity towards cancer cells.Acknowledgements
This study was supported by the 973 program (no. 2014CB845604 and 2015CB856301), the National Science Foundation of China (no. 21572282, 21231007 and 21571196), the Ministry of Education of China (no. IRT1298), the Guangdong Natural Science Foundation (2015A030306023), the Science and Technology Program of Guangzhou (2014J4100140) and the Fundamental Research Funds for the Central Universities.Notes and references
- N. Muhammad and Z. Guo, Curr. Opin. Chem. Biol., 2014, 19, 144–153 CrossRef CAS PubMed.
- G. Gasser and N. Metzler-Nolte, Curr. Opin. Chem. Biol., 2012, 16, 84–91 CrossRef CAS PubMed.
- Z. Liu and P. J. Sadler, Acc. Chem. Res., 2014, 47, 1174–1185 CrossRef CAS PubMed.
- C. H. Leung, H. J. Zhong, D. S. H. Chan and D. L. Ma, Coord. Chem. Rev., 2013, 257, 1764–1776 CrossRef CAS.
- S. Komeda and A. Casini, Curr. Top. Med. Chem., 2012, 12, 219–235 CrossRef CAS PubMed.
- Z. Liu, A. Habtemariam, A. M. Pizarro, S. A. Fletcher, A. Kisova, O. Vrana, L. Salassa, P. C. Bruijnincx, G. J. Clarkson, V. Brabec and P. J. Sadler, J. Med. Chem., 2011, 54, 3011–3026 CrossRef CAS PubMed.
- Z. Liu, I. Romero-Canelon, B. Qamar, J. M. Hearn, A. Habtemariam, N. P. Barry, A. M. Pizarro, G. J. Clarkson and P. J. Sadler, Angew. Chem., Int. Ed., 2014, 53, 3941–3946 CrossRef CAS PubMed.
- J. J. Soldevila-Barreda and P. J. Sadler, Curr. Opin. Chem. Biol., 2015, 25, 172–183 CrossRef CAS PubMed.
- A. Wilbuer, D. H. Vlecken, D. J. Schmitz, K. Kraling, K. Harms, C. P. Bagowski and E. Meggers, Angew. Chem., Int. Ed., 2010, 49, 3839–3842 CrossRef CAS PubMed.
- C. H. Leung, H. J. Zhong, H. Yang, Z. Cheng, D. S. Chan, V. P. Ma, R. Abagyan, C. Y. Wong and D. L. Ma, Angew. Chem., Int. Ed., 2012, 51, 9010–9014 CrossRef CAS PubMed.
- C. Y. Li, M. X. Yu, Y. Sun, Y. Q. Wu, C. H. Huang and F. Y. Li, J. Am. Chem. Soc., 2011, 133, 11231–11239 CrossRef CAS PubMed.
- L. C. Lee, J. C. Lau, H. W. Liu and K. K. Lo, Angew. Chem., Int. Ed., 2016, 55, 1046–1049 CrossRef CAS PubMed.
- X. Ma, J. Jia, R. Cao, X. Wang and H. Fei, J. Am. Chem. Soc., 2014, 136, 17734–17737 CrossRef CAS PubMed.
- Y. You, S. Lee, T. Kim, K. Ohkubo, W. S. Chae, S. Fukuzumi, G. J. Jhon, W. Nam and S. J. Lippard, J. Am. Chem. Soc., 2011, 133, 18328–18342 CrossRef CAS PubMed.
- Y. You, Y. Han, Y. M. Lee, S. Y. Park, W. Nam and S. J. Lippard, J. Am. Chem. Soc., 2011, 133, 11488–11491 CrossRef CAS PubMed.
- L. He, C. P. Tan, R. R. Ye, Y. Z. Zhao, Y. H. Liu, Q. Zhao, L. N. Ji and Z. W. Mao, Angew. Chem., Int. Ed., 2014, 53, 12137–12141 CrossRef CAS PubMed.
- Y. Li, C. P. Tan, W. Zhang, L. He, L. N. Ji and Z. W. Mao, Biomaterials, 2015, 39, 95–104 CrossRef CAS PubMed.
- L. He, Y. Li, C. P. Tan, R. R. Ye, M. H. Chen, J. J. Cao, L. N. Ji and Z. W. Mao, Chem. Sci., 2015, 6, 5409–5418 RSC.
- R. R. Ye, C. P. Tan, L. He, M. H. Chen, L. N. Ji and Z. W. Mao, Chem. Commun., 2014, 50, 10945–10948 RSC.
- R. A. Cairns, I. S. Harris and T. W. Mak, Nat. Rev. Cancer, 2011, 11, 85–95 CrossRef CAS PubMed.
- J. R. Cantor and D. M. Sabatini, Cancer Discovery, 2012, 2, 881–898 CrossRef CAS PubMed.
- W. H. Koppenol, P. L. Bounds and C. V. Dang, Nat. Rev. Cancer, 2011, 11, 325–337 CrossRef CAS PubMed.
- P. S. Ward and C. B. Thompson, Cancer Cell, 2012, 21, 297–308 CrossRef CAS PubMed.
- M. G. Vander Heiden, L. C. Cantley and C. B. Thompson, Science, 2009, 324, 1029–1033 CrossRef CAS PubMed.
- S. E. Weinberg and N. S. Chandel, Nat. Chem. Biol., 2014, 11, 9–15 CrossRef PubMed.
- S. W. Tait and D. R. Green, Nat. Rev. Mol. Cell Biol., 2010, 11, 621–632 CrossRef CAS PubMed.
- S. S. Sabharwal and P. T. Schumacker, Nat. Rev. Cancer, 2014, 14, 709–721 CrossRef CAS PubMed.
- S. Fulda, L. Galluzzi and G. Kroemer, Nat. Rev. Drug Discovery, 2010, 9, 447–464 CrossRef CAS PubMed.
- R. Kumar, J. Han, H. J. Lim, W. X. Ren, J. Y. Lim, J. H. Kim and J. S. Kim, J. Am. Chem. Soc., 2014, 136, 17836–17843 CrossRef CAS PubMed.
- R. Kumar, W. S. Shin, K. Sunwoo, W. Y. Kim, S. Koo, S. Bhuniya and J. S. Kim, Chem. Soc. Rev., 2015, 44, 6670–6683 RSC.
- S. P. Wisnovsky, J. J. Wilson, R. J. Radford, M. P. Pereira, M. R. Chan, R. R. Laposa, S. J. Lippard and S. O. Kelley, Chem. Biol., 2013, 20, 1323–1328 CrossRef CAS PubMed.
- W. Zhou, X. Wang, M. Hu, C. Zhu and Z. Guo, Chem. Sci., 2014, 5, 2761–2770 RSC.
- A. D. Presley, K. M. Fuller and E. A. Arriaga, J. Chromatogr. B: Anal. Technol. Biomed. Life Sci., 2003, 793, 141–150 CrossRef CAS.
- M. H. Lee, N. Park, C. Yi, J. H. Han, J. H. Hong, K. P. Kim, D. H. Kang, J. L. Sessler, C. Kang and J. S. Kim, J. Am. Chem. Soc., 2014, 136, 14136–14142 CrossRef CAS PubMed.
- S. J. Liu, Q. Zhao, Q. L. Fan and W. Huang, Eur. J. Inorg. Chem., 2008, 2177–2185 CrossRef CAS.
- Y. You, S. Cho and W. Nam, Inorg. Chem., 2014, 53, 1804–1815 CrossRef CAS PubMed.
- K. K. Lo, Acc. Chem. Res., 2015, 48, 2985–2995 CrossRef CAS PubMed.
- J. S. Y. Lau, P. K. Lee, K. H. K. Tsang, C. H. C. Ng, Y. W. Lam, S. H. Cheng and K. K. W. Lo, Inorg. Chem., 2009, 48, 708–718 CrossRef CAS PubMed.
- G. L. Zhang, H. Y. Zhang, Y. Gao, R. Tao, L. J. Xin, J. Y. Yi, F. Y. Li, W. L. Liu and J. Qiao, Organometallics, 2014, 33, 61–68 CrossRef CAS.
- C. A. Puckett and J. K. Barton, J. Am. Chem. Soc., 2007, 129, 46–47 CrossRef CAS PubMed.
- M. Poot, Y. Z. Zhang, J. A. Kramer, K. S. Wells, L. J. Jones, D. K. Hanzel, A. G. Lugade, V. L. Singer and R. P. Haugland, J. Histochem. Cytochem., 1996, 44, 1363–1372 CrossRef CAS PubMed.
- S. T. Smiley, M. Reers, C. Mottola-Hartshorn, M. Lin, A. Chen, T. W. Smith, G. D. Steele Jr and L. B. Chen, Proc. Natl. Acad. Sci. U. S. A., 1991, 88, 3671–3675 CrossRef CAS.
- D. A. Ferrick, A. Neilson and C. Beeson, Drug Discovery Today, 2008, 13, 268–274 CrossRef CAS PubMed.
- M. Wu, A. Neilson, A. L. Swift, R. Moran, J. Tamagnine, D. Parslow, S. Armistead, K. Lemire, J. Orrell, J. Teich, S. Chomicz and D. A. Ferrick, Am. J. Physiol.: Cell Physiol., 2006, 292, C125–C136 CrossRef PubMed.
- H.-Y. Lu, Y.-J. Chang, N.-C. Fan, L.-S. Wang, N.-C. Lai, C.-M. Yang, L.-C. Wu and J.-a. A. Ho, Biomaterials, 2015, 42, 30–41 CrossRef CAS PubMed.
- S. A. Detmer and D. C. Chan, Nat. Rev. Mol. Cell Biol., 2007, 8, 870–879 CrossRef CAS PubMed.
- C. W. Leung, Y. Hong, S. Chen, E. Zhao, J. W. Lam and B. Z. Tang, J. Am. Chem. Soc., 2013, 135, 62–65 CrossRef CAS PubMed.
- H. Wang and J. A. Joseph, Free Radical Biol. Med., 1999, 27, 612–616 CrossRef CAS PubMed.
- H. M. McBride, M. Neuspiel and S. Wasiak, Curr. Biol., 2006, 16, R551–R560 CrossRef CAS PubMed.
- R. J. DeBerardinis, J. J. Lum, G. Hatzivassiliou and C. B. Thompson, Cell Metab., 2008, 7, 11–20 CrossRef CAS PubMed.
- R. S. Hotchkiss, A. Strasser, J. E. McDunn and P. E. Swanson, N. Engl. J. Med., 2009, 361, 1570–1583 CrossRef CAS PubMed.
- S. J. Riedl and Y. G. Shi, Nat. Rev. Mol. Cell Biol., 2004, 5, 897–907 CrossRef CAS PubMed.
- A. Parcellier, S. Gurbuxani, E. Schmitt, E. Solary and C. Garrido, Biochem. Biophys. Res. Commun., 2003, 304, 505–512 CrossRef CAS PubMed.
- D. W. Huang, B. T. Sherman and R. A. Lempicki, Nat. Protoc., 2008, 4, 44–57 CrossRef PubMed.
- J. Lamb, E. D. Crawford, D. Peck, J. W. Modell, I. C. Blat, M. J. Wrobel, J. Lerner, J. P. Brunet, A. Subramanian, K. N. Ross, M. Reich, H. Hieronymus, G. Wei, S. A. Armstrong, S. J. Haggarty, P. A. Clemons, R. Wei, S. A. Carr, E. S. Lander and T. R. Golub, Science, 2006, 313, 1929–1935 CrossRef CAS PubMed.
- W. Xiang, J. K. Cheong, S. H. Ang, B. Teo, P. Xu, K. Asari, W. T. Sun, H. Than, R. M. Bunte, D. M. Virshup and C. Chuah, OncoTargets Ther., 2015, 6, 33769–33780 Search PubMed.
Footnote |
| † Electronic supplementary information (ESI) available: Experimental procedures, figures and tables, references and X-ray crystallographic data. CCDC 1452036–1452038. For ESI and crystallographic data in CIF or other electronic format see DOI: 10.1039/c6sc02901a |
| This journal is © The Royal Society of Chemistry 2017 |

