
Design protocol of microjet mixers for achieving desirable mixing times with arbitrary flow rate ratios
S.
Asano
 ,
S.
Yamada
,
T.
Maki
*,
Y.
Muranaka
and
K.
Mae
,
S.
Yamada
,
T.
Maki
*,
Y.
Muranaka
and
K.
Mae
Department of Chemical Engineering, Graduate School of Engineering, Kyoto University, Kyoto-daigaku Katsura, Nishikyo-ku, 6158510 Kyoto, Japan. E-mail: tmaki@cheme.kyoto-u.ac.jp
First published on 1st August 2017
Abstract
We extensively examined and discussed the performance of microjet mixers that consisted of two concentrically arranged tubes. The orientation of the feed streams with respect to the inner and outer inlets was the crucial factor for promoting the desired reaction. The Reynolds number after jetting and the velocity ratio of the inner and outer fluids were the key variables for promoting vigorous jetting and efficient mixing. By choosing the appropriate operating conditions, the microjet mixers exhibited excellent performance. The design protocol for microjet mixers was established based on mixing time measurements. We successfully maximized the throughput in one channel and numbered-up the microjet mixers. The microjet mixers also proved to be useful for treating viscous fluids with the appropriate choice of the feed orientation. The complete mixing of water with a 200 times more viscous fluid was achieved in 20 ms.
Introduction
Microflow reactors have been intensively studied and utilized for their enhanced mass and heat transportation due to their small diffusion length confined in a microspace.1 Microflow reactors have realized applications, such as novel routes for organic synthesis based on controlling the short lifetimes of intermediates,2 sequence-defined polymerization,3–6 and size and property-tuned nanoparticle synthesis.7–10 Microflow reactors are now applied not only in laboratory syntheses but also in industrial production11–13 while utilizing the advantages of continuous processing for productivity and reproducibility.Fast mixing is the most important advantage of microflow reactors for the applications listed above because it severely affects the selectivity of fast chemical reactions,2,14 the molecular weight distribution of polymers,15,16 and the size and distribution of nanoparticles.17–20 Even though scaling down the mixer ensures more rapid mixing, a mixer that is too small is undesirable because of the risk of clogging21,22 and the dramatic increase in the pressure drop. Because of this trade-off, micromixers have been a hot research topic for decades. Many studies have investigated the fundamentals of fluid dynamics in microchannels,23–26 created novel structured micromixers,27–30 proposed design and scale-up concepts,31–34 and sought methods to mix viscous fluids.35–37
Most of these studies were conducted using symmetric mixers and assumed the mixing of two fluids using the same flow rates. However, there are many practical situations for mixing two fluids at different flow rates. Typical examples of these situations include the following: antisolvent crystallization,20,38,39 the sequential addition of reactants into a main stream,40,41 mixing heated solvents with raw materials for solvothermal synthesis,34,42–44 and multistep organic synthesis processes.45,46 In spite of these plentiful applications, a comprehensive study on mixing using nonequal flow rates does not exist. A computational fluid dynamics (CFD) study was conducted that illustrated the mushroom-shaped vortices in a T-mixer caused by using a non-unity flow rate ratio,47 and an investigation was conducted on unbalanced flow distribution within multiple channels.48 A probable reason for the lack of a comprehensive study is the difficulty involved in treating multiple variables. A symmetric mixer is intuitively unsuitable for nonuniform flow rates. However, mixer asymmetry generates additional design variables, such as the position of one inlet relative to the other and the area ratio of each inlet. In addition, the Villermaux–Dushman reaction, which is the most popular method for monitoring mixing in a flow microreactor,49–51 is not suitable as it is. First, the reaction mechanism of the Dushman reaction is very complex, and its kinetics are highly sensitive to the reactant concentrations.52,53 Changes in the feed concentration with the flow rate ratio may make the results incomparable. Second, changing the feed orientation with respect to the inlets in an asymmetric mixer,54 or using different mixing profiles in a microchannel,27 is known to produce greatly different results, even for the same mixing time. Changing the flow rate ratio affects both the symmetry and the profile of mixing.
Here, we focus on a microjet mixer that consists of two concentrically arranged small tubes. It has remarkable advantages for studying mixing using nonuniform flow rate ratios. First, numerous microjet mixers with different dimensions can easily be fabricated by only combining commercially available tubing. Second, the concentric geometry allows us to neglect the complicated design parameters due to the asymmetric inlets. This study aims to clarify the key variables in microjet mixers, to propose a systematic design method for arbitrary flow rate ratios and to verify the advantages of the method using other micromixers. We examined the mixing performance multilaterally using two types of chemical test reactions, a computational simulation, and two kinds of flow visualizations. We also explored appropriate methods for treating viscous fluids with a microjet mixer.
Materials and methods
Materials
Phenolphthalein, rhodamine B, potassium iodide, potassium iodate, boric acid, bromine, 1,3,5-trimethoxybenzene (TMB), glycerol, a 5 M hydrochloric acid solution, a 5 M sodium hydroxide solution, ethanol, and methanol were purchased from Wako Pure Chemical Industries, Ltd. (Osaka, Japan) and used without further purifications. Ultra-purified water was prepared using a Milli-Q water purification system (Millipore, Milford, MA, USA).Mixers
The microjet mixers were assembled using commercial tees and tubes (IDEX Health & Science, Oak Harbor, USA: GL Science, Tokyo, Japan: Swagelok, Solon, USA: Sogo Laboratory Glass Works, Kyoto, Japan). Fig. 1(a) illustrates the assembly process. The smaller tubes with an outer diameter (o.d.) of 360 μm, 1/32 inches (790 μm), or 1/16 inches (1.6 mm) were inserted into the larger tubes with an o.d. of 1/16, 1/8 or 1/4 inches through a tee. Tubing sleeves with an o.d. of 1/16 inches or Swagelok reducers (1/16 inch to 1/8 inch) were installed to insert the inner tube into the tee for the 1/16 inch and 1/8 inch tubes, respectively. Reducers (1/4 inch to 1/8 inch) were used to connect the outer 1/4 inch tubes to the tees of the 1/8 inch tubes. This paper describes the composition of each microjet mixer in the following format: [inner diameter of the inner tube, Dii_; outer diameter of the inner tube, Dio_; and inner diameter of the outer tube, Doi (mm)].The outer diameter of the outer tube was omitted from the format because it did not influence the mixing. The counter-current schemes were examined by changing the connection of the inlet of the outer fluid to that of the outlet as shown in Fig. 1(a-i and ii).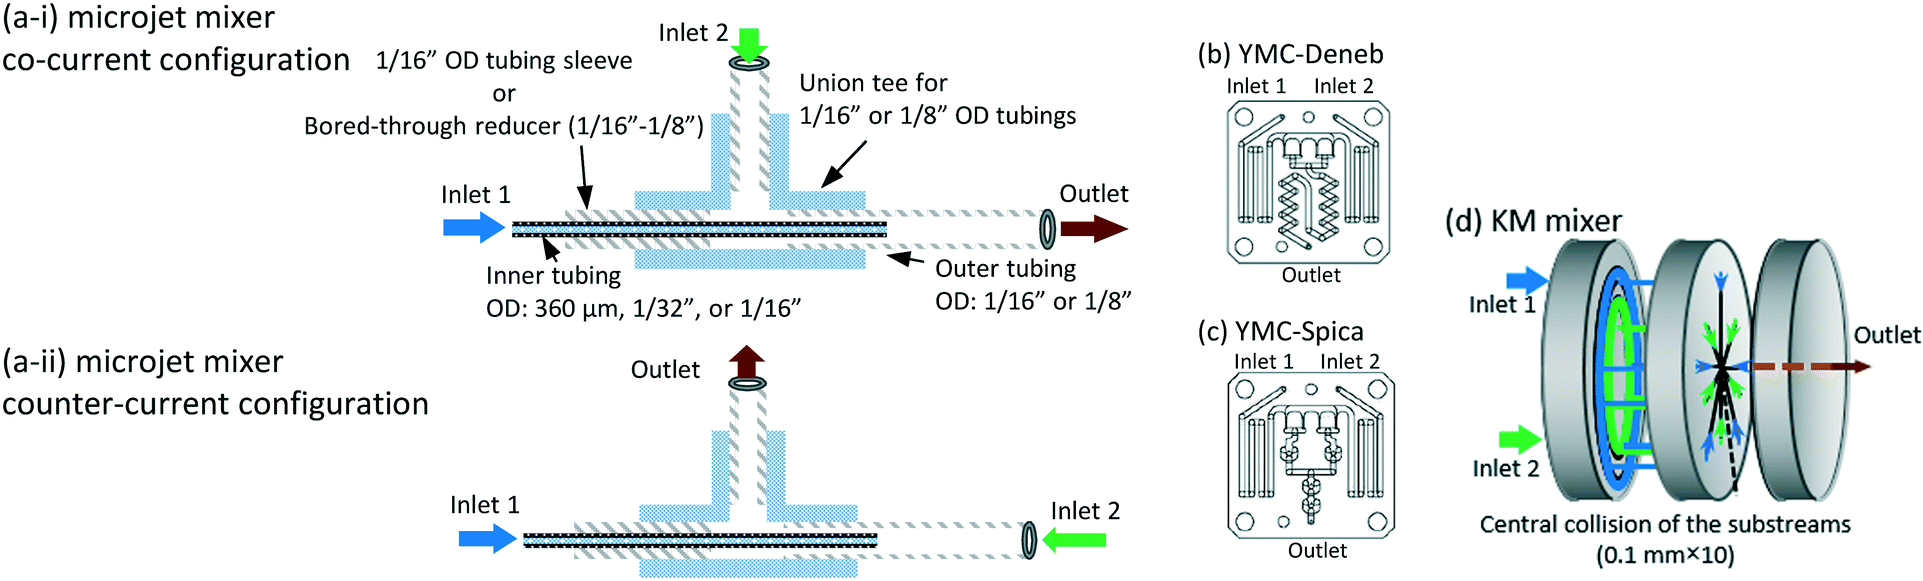 | ||
| Fig. 1 Schematics of the micromixers: (a) a microjet mixer, composition and flow directions; (b) YMC-Deneb micromixer; (c) YMC-Spica micromixer; (d) KM mixer with 5 × 2 substreams. The diagrams of the glass micromixers were reproduced from a catalog from YMC. | ||
The performances of glass micromixers Deneb and Spica (YMC, Kyoto, Japan), a KM mixer, and an arrowhead static mixer (Part number U-466, IDEX Health & Science) were examined by comparing with the microjet mixers. Deneb produces a manifold structure with a 3D helix channel. Spica produces a manifold structure with multiple split and recombination structures. Both glass chips have a 0.2 mm × 0.2 mm square cross-section as the smallest part. The KM mixer divides each fluid into 5 substreams via channels with 0.1 mm × 0.1 mm cross sections. The substreams arise at the center hole, which has a diameter of 0.32 mm, and then flow into the outlet hole with a 0.36 mm diameter and 1 mm length. A body made of stainless steel was used for the Villermaux–Dushman reaction, and a body made of polychlorotrifluoroethylene was used for the bromination reaction. The KM mixer was presented in greater detail in a previous paper.28 The arrowhead static mixer has a 0.5 mm hole with confluence angle of 270°. It also has a 10 μm pore frit at the outlet to enhance the mixing. The body was made of polyether ether ketone, and the frit was made of ultrahigh molecular weight polyethylene. Except for the microjet mixers, 30 cm length outlet tubes with an o.d. of 1/16 inches and inner diameter (i.d.) of 0.5 mm were connected to all mixers. The outer tubes of the microjet mixers were extended 30 cm as the outlet tubes. These outlet tubes were placed straight to minimize external disturbances during the mixing process and to ensure the mixing completion before the sampling phase.
Villermaux–Dushman reaction
Villermaux–Dushman reactions were conducted according to the method described by Commenge and Falk.51 A hydrochloric acid solution and an alkaline buffer solution containing potassium iodide, potassium iodate, and boric acid were mixed. The protocol couples the neutralization reaction of boric acid with the iodide–iodate redox reaction. The scheme includes parallel competing neutralization and redox reactions, as shown below.| H2BO3– + H+ ⇄ H3BO3 (main reaction) |
| 5I– + IO3– + 6H+ ⇄ 3I2 + 3H2O (side reaction) |
| I2 + I– ⇄ I3– (equilibrium) |
When the mixing is poor, the proton concentration has large local values, and the side reaction proceeds. The segregation index (Xs) was used to quantitatively evaluate the results.51 The definition of Xs is presented as follows:
| Xs = Y/YST |
where the subscript 0 denotes the initial concentration of the component before feeding. Concentrations without the subscript 0 indicate the obtained mixture solution. Note that some papers define the subscript 0 as the initial concentration in the reactor and omit 1/2 in the denominator of Y.55,56 The sensitivity of Xs against mixing is highly dependent on the concentration. Commenge and Falk51 proposed the following equation to estimate mixing times from the absorbance and employed concentration sets based on a simple mixing model called IEM (interaction by exchange with the mean):57

where OD represents the absorbance per millimeter at 353 nm.

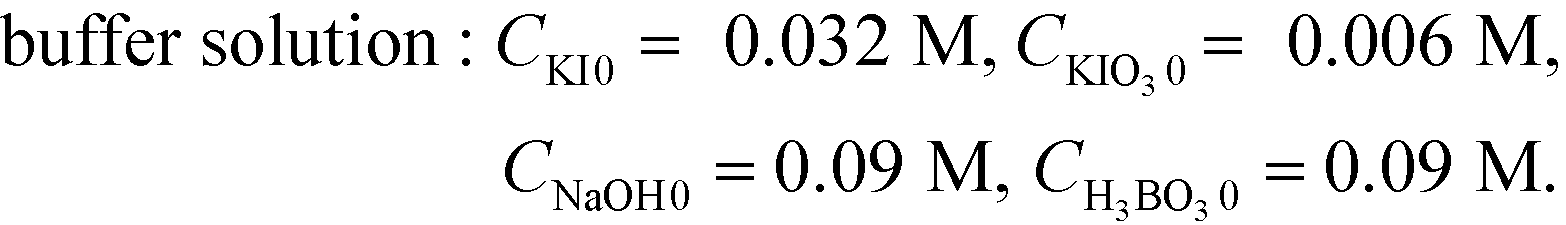
Aqueous solutions of acid and buffer were prepared with the following concentrations:
| acid solution: CHCl0 = 0.06 M, or 0.04 M |
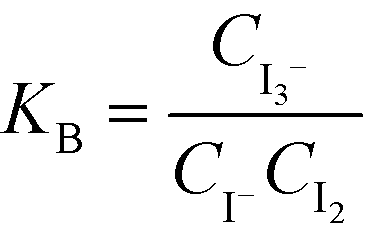
The solutions were fed into the device using 260D syringe pumps (Teledyne Isco, Lincoln, USA) at room temperature. The samples were collected from outlet tubes into optical cells with a 1 cm observation length. The absorbance at 353 nm, which is specific to triiodide ions, was measured just after the sample collection phase using a UV-Mini 1240 spectrophotometer (Shimadzu, Kyoto, Japan). The concentration of triiodide ions was obtained from the Lambert–Beer law using the molar absorption coefficient of triiodide at 353 nm, which is 26![[thin space (1/6-em)]](https://www.rsc.org/images/entities/char_2009.gif) 047 L mol−1 cm−1. The concentration of iodine was derived from the equilibrium constant KB [M−1], which is defined as follows:
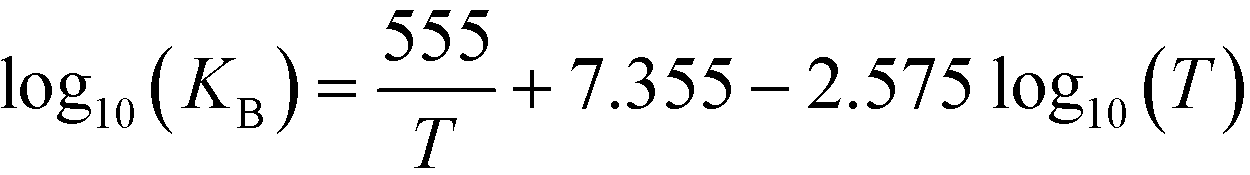
047 L mol−1 cm−1. The concentration of iodine was derived from the equilibrium constant KB [M−1], which is defined as follows:
where T [K] is the operating temperature. At least three samples were analyzed for each operation condition. The error bars in the figures indicate the standard deviations of the analyzed samples.
Bromination of 1,3,5-trimethoxybenzene
The competitive–consecutive bromination reactions of TMB were conducted according to the method established by Hecht et al.58 The reactions occurred by mixing the TMB solution and a bromine solution. The primary product is a monosubstituted derivative of TMB, 1-bromo-2,4,6-trimethoxybenzene (1BR). A by-product is a disubstituted compound of TMB, 1,3-dibromo-2,4,6-trimethoxybenzene (2BR). The reaction scheme is shown below.| TMB + Br2 → 1BR + HBr (main reaction) |
| 1BR + Br2 → 2BR + HBr (side reaction). |
Methoxy groups have an activating effect on electrophilic aromatic substitution, including bromination reactions. In contrast, bromine is a deactivating substituent against electrophilic aromatic substitution. As a result, the main reaction of TMB is instantaneous, and the side reaction of 1BR is moderately fast but slower than the main reaction. Bad mixing generates the local absence of TMB against bromine and promotes the side reaction.
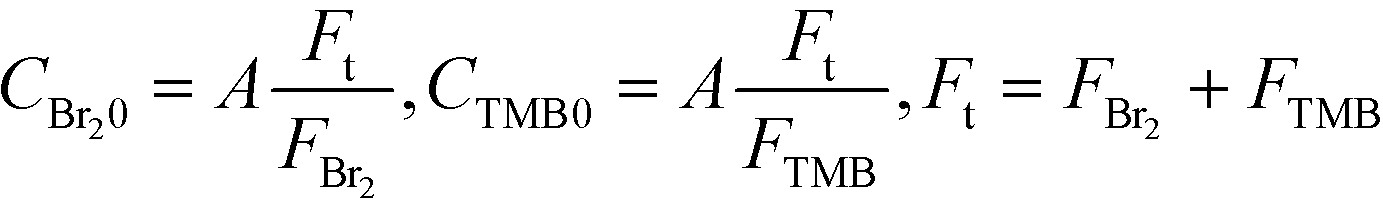
Solutions of TMB in methanol and bromine in methanol were prepared just before the experiment. The bromine solution was stored in a glass container carefully wrapped with aluminum foil to prevent a light-induced reaction between the bromine and methanol. The transparent parts of the devices were also covered with aluminum foil. A dual plunger pump, KP-22-13P (FLOM, Inc., Tokyo, Japan), that did not contain wetted metal parts was employed to avoid corrosion with bromine. The concentrations were changed according to the following equations:
The reaction was conducted at room temperature. The samples were collected from the outlet tubes connected to the mixers. The obtained samples were diluted 20 times with methanol and analyzed using a high-performance liquid chromatography system from Shimadzu. The system was composed of an autoinjector (SIL-10AF), a vacuum degasser (DGU-20A), a pump (LC-20AT), an oven (CTO-10A), and a UV/vis detector (SPD-20A). The separation column was an Agilent Zorbax SB-C18 (4.6 × 150 mm, 3.5 μm). The UV absorption at a wavelength of 207 nm was measured for 60 min. Water and methanol in a 1:1 volumetric ratio were used as the mobile phase. The oven was maintained at 40 °C. The flow rate of the mobile phase was 0.7 mL min−1. The injection volume of the sample was 1.0 μL. Chromatographs were recorded and integrated with an LCSolution Version 1.22 SP1. The linear correlations between the peak areas and their respective concentrations were used for calibration. Most likely, due to the unidentified side reactions of bromine, a material imbalance existed between the detected amount of brominated TMB derivatives and their expected amount from the feed rate and concentration. Samples with a less than 25% imbalance were used in this paper.
The selectivity to 2BR (S2BR) was used for indicating the mixing quality. It was calculated as shown below.
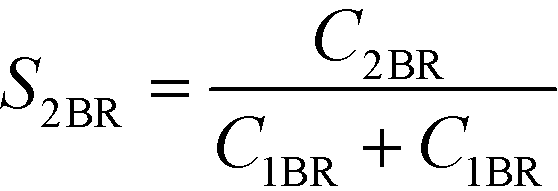
Smaller S2Br values indicate better mixing.
Computational fluid dynamics (CFD) simulations
CFD simulations were conducted to reveal further insights into the mixing and reactions in the microjet mixers. The mixing of two fluids, A and B, was simulated. Both fluids had the same viscosity of 0.8 mPa s and density of 998.2 kg m−3. The diffusivity was fixed to be 2 × 10⁻⁹ m2 s−1 for all species. A competitive–consecutive reaction system, which roughly mimics the bromination of TMB, was included in the calculation. The reaction formulas, rate equations, and initial concentrations are as follows:| A + B → R, r1 = k1CACB, k1 = 3611 m3 kmol−1 s−1 |
| B + R → S, r2 = k2CBCR, k2 = 0.3611 m3 kmol−1 s−1 |
| CA0 = 1.1 kmol m−3, CB0 = 1.1 kmol m−3 |
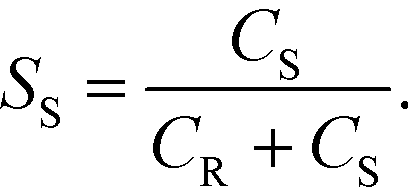
Smaller SS values indicate better mixing. A microjet mixer with the following properties was adopted: [0.10_0.36_1.0]. The lengths were 1 cm and 4.5 cm for the inner tube and the outer tube, respectively. The total flow rate was 10 mL min−1, and the corresponding Reynolds number after jetting was 211.
The commercial finite volume code FLUENT 14.5 was employed. The 3D calculation space was divided into 1507016 cells of tetrahedra and hexahedra. To minimize the numerical errors, finer grids with 5 μm small edge sizes were prepared around the nozzle because the secondary flows in this region dominated the numerical diffusion. Grids around the inner wall of the outer tube and outlet were prepared using an approximately 40 μm edge size. A laminar flow model was employed for treating the viscosity. Transient state simulations were conducted because steady state simulations could not converge due to the dynamic behavior around the mixing point.59 The total simulation time was 10 ms with a time step of 0.1 ms, and 2000 iterations were conducted with the steady-state model to obtain the initial state. Then, 20 iterations were conducted for each time step, and SS was obtained from the average concentrations of the outlet during 10 ms durations. The contour plot of the side reaction rate was taken from the initial condition. The mesh size dependence was checked by repeating the calculation with 2776580 refined calculation cells. The differences in the outlet concentrations were less than 0.01% for all species with refined cells.
Flow visualization
Flow visualization using the dye rhodamine B was conducted to confirm the vortices around the nozzle. A rhodamine B solution of 0.42 mM was employed. Flow visualization with decolorization was also conducted using an acid–base neutralization reaction for measuring the mixing time. A base solution and an acid solution were mixed so that the color disappeared after complete mixing. The concentrations were as follows: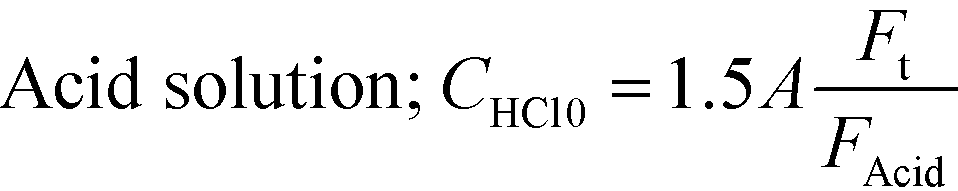
where A was fixed at 10 mM and FAcid, FBase, and Ft refer to the flow rate of the acid solution, the base solution and their sum, respectively. In both experiments, the colored fluid was fed from the inner tube, and 70 or 90 wt% aqueous glycerol solutions were employed as solvents in the case of studying the effect of viscosity.
The solutions were fed into the device using 260D syringe pumps (Teledyne Isco) at room temperature. Photos were taken around the nozzle using a digital microscope (VHX-1000, Keyence, Osaka, Japan), and photos including the entire tube were taken using a digital single-lens reflex camera (D50, Nikon, Tokyo, Japan). We estimated the mixing time (tmix) from the decolorization length, Lmix, and the average velocity (uave) as follows:
Pressure drop measurements
The pressure drop between the inner and outer fluid was measured using a microjet mixer with the following characteristics: [0.10_0.36_1.0]. A 58 mm length PEEK capillary was used as an inner tube, and a 30 cm glass tube was used as an outer tube. A PEEK tee with a 1.27 mm hole was used to connect the tubes. Water was fed from the 260D syringe pumps (Teledyne Isco) at room temperature. The pressure drop of the inner fluid was measured by the pressure indicator equipped in the 260D syringe pump. That of the outer fluid was measured by a pressure sensor (GP-M010, Keyence, Osaka, Japan) connected just before the tee.Numbering-up of microjet mixers
Four microjet mixers of [0.10_0.36_1.0] were constructed as described in the Pressure drop measurements section. Two dichotomic tree structures with four branches were constructed for distributing both the inner and outer fluids, as realized in previous studies.61,62 Swagelok tee mixers with 1.3 mm i.d. thru holes were used at the bifurcations. Stainless steel tubes are better for use as distributors because channel constriction due to the fittings usually occurs with soft plastic tubes, causing flow maldistribution. We employed stainless steel tubes with precut lengths (GL Sciences). Manually cutting the stainless-steel tubes was also avoided because it usually makes improper cross-sections. To produce a sufficient pressure drop to deliver the fluid equally, 1/16 o.d. tubes with a 0.25 mm i.d. and 10 cm length were used for feeding the outer fluid to the tees. For the inner fluid, inner tubes with an i.d. of 0.10 mm should induce a sufficient pressure drop for this purpose. All the other parts in the distribution sections were connected by 1/16 inch o.d. tubes with an 0.8 mm i.d. and 5 cm length.The flow distribution quality was examined by measuring the amount of accumulated outlet fluid from each microjet mixer. Water was delivered by the 260 D syringe pumps at a total flow rate of 170 mL min−1 (85 mL min−1 each for the inner and the outer fluids) for 2 min at room temperature. The amount of delivered water was measured by weighing the mass of conical flasks placed at the outlets before and after the experiments. Flow visualization using phenolphthalein decolorization was also conducted at the same flow rate.
Results and discussion
Flow direction and orientation
Microjet mixers can be operated in two schemes, a co-current scheme in which two fluids are fed in the same direction, or a counter-current scheme, in which two fluids are supplied in opposite directions, as described in Fig. 1(a-i) and (a-ii), respectively. Each scheme has two choices for the feed orientation concerning the inlets. Fig. 2(a) compares the results of the Villermaux–Dushman reaction for all combinations. The co-current scheme while feeding the acid solution from the inner tube showed significantly better results than the others. Regarding the flow directions, Ma et al.34 determined the advantages of the co-current scheme with respect to the mixing, heat transfer, and residence time distribution based on CFD simulations. Our results from this study also confirmed the benefits of the co-current scheme for a chemical reaction. A detailed discussion on the causes of inferior performance of the counter-current scheme is provided in the next section. Regarding the orientation of the feed, Kölbl and Kraut54 revealed its relation with the Villermaux–Dushman reaction in an unsymmetrical tee mixer. Their discussion regarding the mechanism concluded that less triiodide was generated when feeding H+ in the regions with a higher energy dissipation rate because the side reaction occurred only at areas with excess H+. Our results were consistent with their discussion. However, it was unclear whether the dependence was particular to the Villermaux–Dushman reaction or another reaction system. Fig. 2(b) shows the feed orientation dependence on the bromination of TMB. Feeding the bromine solution from the inner tube produced better results than that using the other tube. The results indicate that the reactant that involves both the main and side reactions should be fed to the inner tube.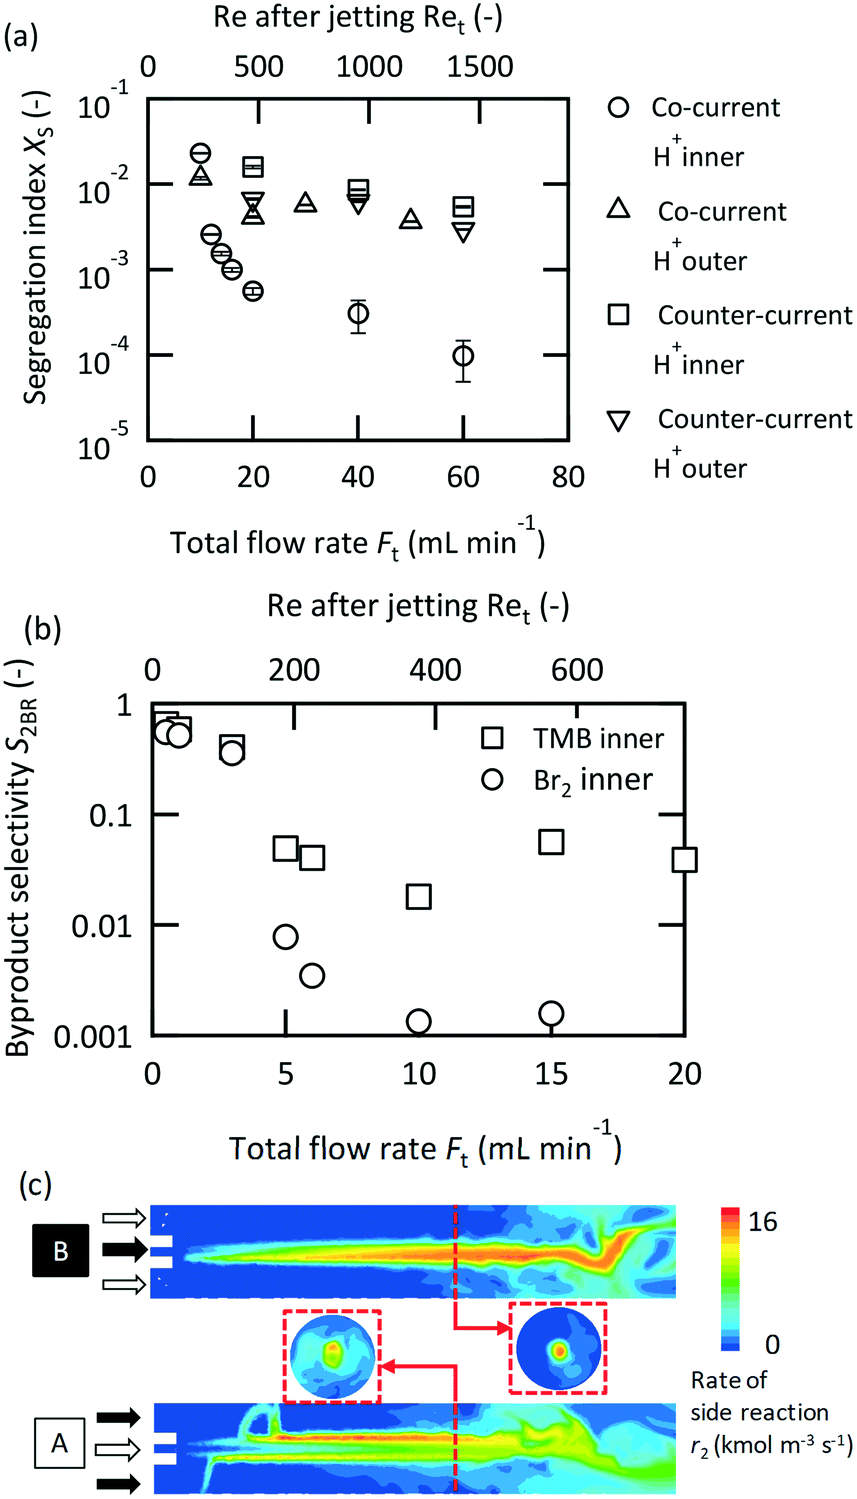 | ||
| Fig. 2 Investigation on the current direction and feed orientation: (a) Villermaux–Dushman reaction, [0.15_0.36_ 1.0], vi/vo = 12, and CHCl0 = 0.06 M; (b) bromination of TMB, [0.1_0.36_0.75], A = 0.01 M, FTMB/FBr2 = 1, and vi/vo = 43; (c) CFD simulation, [0.10_0.36_1.0], Ft = 10 mL min−1, vi/vo = 87, and Ret = 211. The contours of cross sections perpendicular to the center axis are 3 mm distant from the nozzle. | ||
CFD simulations were conducted to further investigate the mechanism. The dependence on the orientation was examined by modeling the competitive–consecutive reactions. The selectivity to the by-product SS was 0.16 when fluid B was fed from the inner tube. The other orientation resulted in a SS of 0.20. Feeding fluid B, which is the reactant that corresponded to bromine, from the inner tube produced better results. This is consistent with the experimental results. Fig. 2(c) illustrates the contours of the rate of the side reaction in the cross sections. The regions in which the side reaction proceeded were completely different between the two cases. When feeding fluid B from the inner tube, the side reaction was confined in the center of the reactor. During the other cases, the side reaction occurred in a wider area of the cross section and occurred especially rapidly in the field surrounding the center axis. A possible explanation for these phenomena is the mobility of the interface in which the intermediate product R is generated. If the interface tends to dissipate to the outer side, the outer field dominantly maintains R. In the case that the outer fluid is rich in reactant B, the side reaction occurs exclusively. In the other case, the side reaction can be confined to a small area.
We concluded that the feed orientation is the crucial factor for conducting chemical reactions using a microjet mixer. A reactant that is directly involved in both the main and side reactions should be fed from the inner tube. Kashid et al.63 examined the mixing efficiency of a microjet mixer with four other symmetric mixers based on the Villermaux–Dushman reaction without mentioning the employed feed orientation. In their study, the microjet mixer showed inferior mixing performance; however, we believe that changing the orientation would have dramatically changed their conclusion.
Flow regimes in the microjet mixer
Visualization experiments were conducted to examine the flow regimes in the microjet mixer. Three distinct flow regimes were observed. We classified them as follows:1) Laminar: vortices were not created, but a precise laminar flow was generated.
2) Moderate jetting: vortices formed at the nozzle. The jetting was stable, and the trajectory maintained the same structure.
3) Vigorous jetting: tiny and unsteady vortices appeared at the nozzle. The path of the flow was not consistent with time.
Fig. 3(a) shows typical pictures of the three flow regimes. In the laminar flow regime, nearly the same pictures were obtained using two visualization methods because minimal mixing proceeded due to diffusion. In the moderate jetting regime, the rhodamine B dye expanded throughout the whole channel, indicating mixing promotion by vortices, but in the neutralization experiment, segregated areas remained that were present as pink. In the vigorous jetting regime, the rhodamine B dye expanded throughout the whole outer tube instantly, and the color from the phenolphthalein vanished just after the nozzle, indicating that the mixing was truly rapid and perfect. The trajectory of the dye was unstable in the vigorous jetting regime, which is another substantial difference compared to the moderate jetting regime, in which the trajectory was stable for both visualization methods.
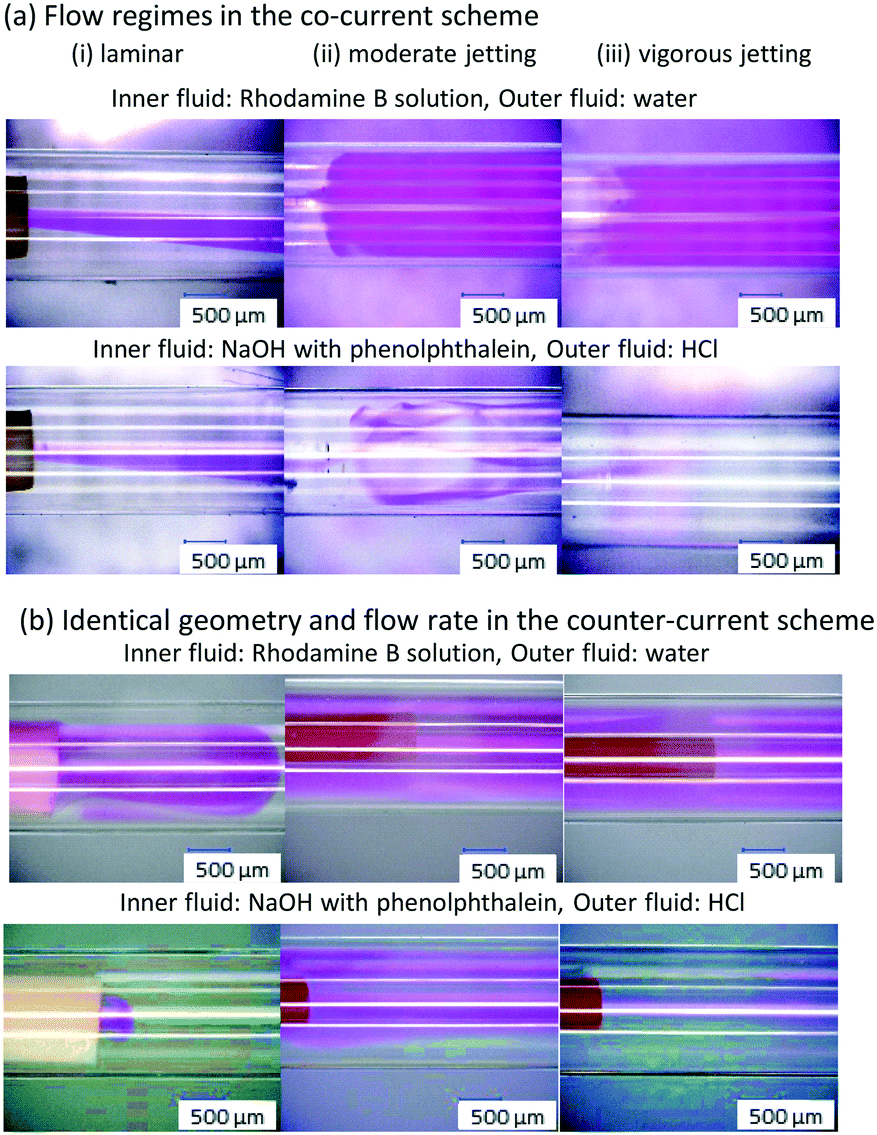 | ||
| Fig. 3 Visualized fluid behaviors around the nozzle: (a) co-current scheme with (i) [0.18_0.79_1.0], Fi = 1 mL min−1, Fo = 1 mL min−1, Ret = 95, and vi/vo = 12; (ii) [0.10_0.36_1.0],Fi = 1.5 mL min−1, Fo = 0.75 mL min−1, Ret = 107, and vi/vo = 174; (iii) [0.10_0.36_1.0], Fi = 10 mL min−1, Fo = 5.0 mL min−1, Ret = 712, and vi/vo = 174, and (b) counter-current scheme with the same geometry and flow rate. | ||
Fig. 3(b) shows the visualized flows in the counter-current configuration with an identical geometry and flow rate to Fig. 3(a). At the lower flow rate, the inner fluid flowed several millimeters from the nozzle to have contact with the outer fluid (Fig. 3(b) upper left). Slight mixing after being in contact with the outer fluid and changing direction was confirmed by the appearance of the reduced pink region during the neutralization experiment. However, the pink color remained around the wall of the inner tube (Fig. 3(b) lower left). With the increase in the velocity of the inner fluid, the rhodamine B dye expanded throughout the whole range of the outer tube (Fig. 3(b) upper middle), similar to the moderate jetting regime in the co-current configuration. In the neutralization experiment, the pink color remained straight along the center axis, returned after several centimeters and passed through the upper half of the space between the outer tube and inner tube (Fig. 3(b) lower middle). At a higher flow rate for both fluids, the rhodamine B dye expanded to the whole region and the trajectory was unstable (Fig. 3(b) upper right). However, the color of phenolphthalein slightly remained along the center axis for several centimeters, indicating that the mixing was not as fast and as uniform as that of the co-current configuration (Fig. 3(b) lower right). In summary, from the visualization, the key for rapid mixing in a microjet mixer is the vortices around the nozzle that expand the inner fluid quickly. The counter-current configuration was unsuitable for this purpose because it suppresses the expansion of the inner fluid.
Fig. 4 is a map of the observed flow conditions, while changing the flow velocity ratio (vi/vo) and the total Reynolds number after jetting (Ret), and mixer compositions. Intermediate behaviors that could not be precisely categorized are shown as the transition regions. In all three microjet mixers, low vi/vo and low Ret values resulted in the laminar regime. The increase in the vi/vo value caused the flow to occur in the moderate jetting mode. Both high vi/vo and Ret values resulted in the vigorous jetting mode.
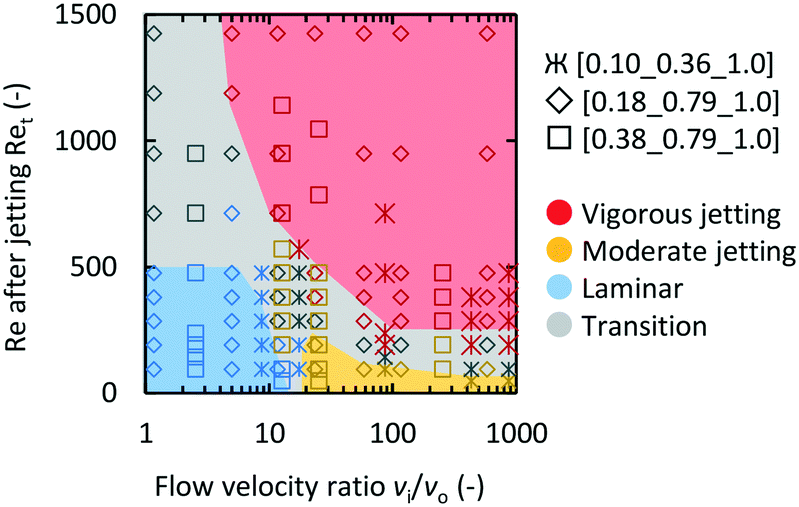 | ||
| Fig. 4 Flow regime mapping based on Ret and vi/vo. The marker shape indicates the geometry of the microjet mixer. The color of the marker indicates the observed flow regime. | ||
Rapid mixing in the vigorous jetting regime
It has been suggested that operating in the vigorous jetting regime is suitable for rapid mixing. To validate this strategy, chemical test reactions were conducted by changing the mixers and flow rates. Fig. 5(a) illustrates the results of the Villermaux–Dushman reaction using four microjet mixers with the same inner tube. The results using three of the mixers exhibited similar curves at approximately Ret = 400; however, [0.15_0.36_0.5] showed significantly larger Xs values. The reason for this result was attributed to the small velocity ratio. The Villermaux–Dushman reaction was conducted at the same flow rate so that the vi/vo values were dependent on Doi. From Fig. 4, vi/vo = 5 is not sufficient to induce vigorous jetting. The bromination of TMB was conducted by changing the flow rate ratio while maintaining vi/vo = 100. Fig. 5(b) summarizes the results. Larger Fi/Fo values resulted in a better performance in the transition regime. However, operating in the vigorous jetting regime resulted in a minimal by-product yield regardless of the value of Fi/Fo. Hence, the effectiveness of operating in the vigorous jetting regime was clarified.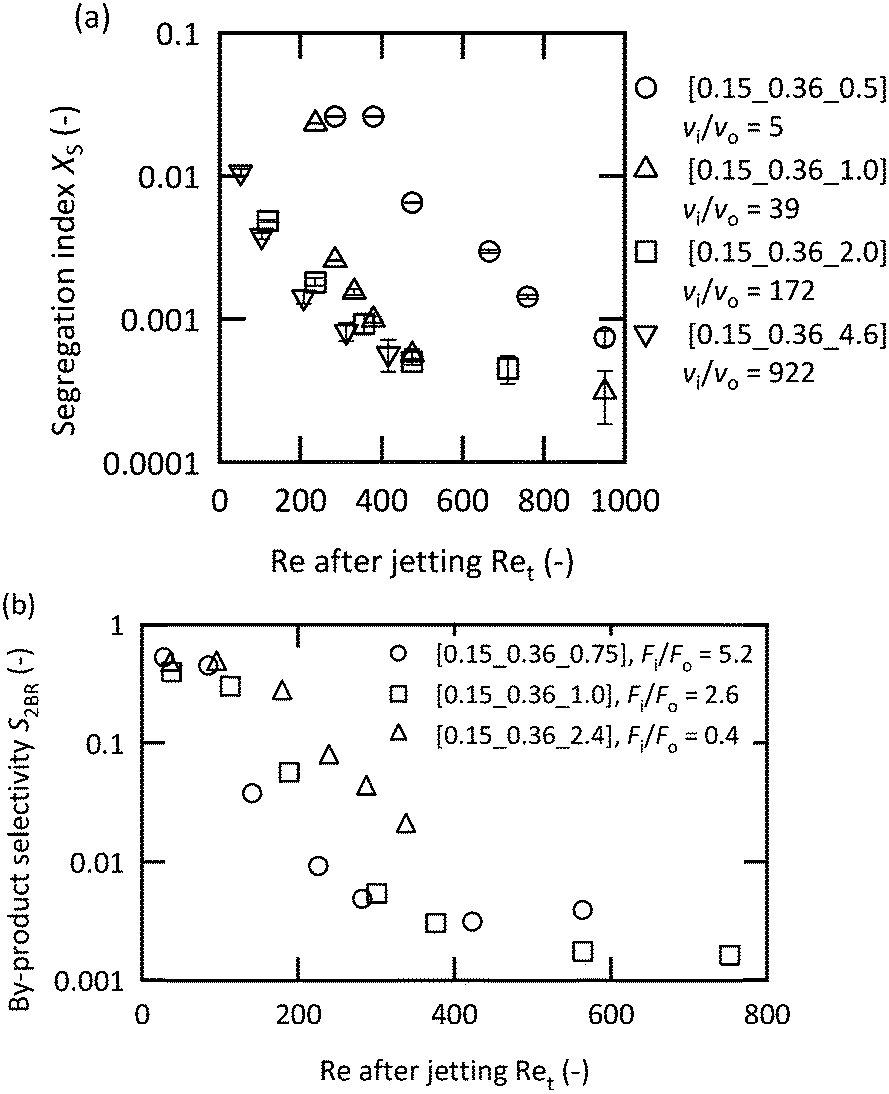 | ||
| Fig. 5 Chemical test reaction results with the fixed inner tube: (a) Villermaux–Dushman protocol with a fixed flow rate ratio of 1; the acid solution was fed from the inner tube (CHCl0 = 0.06 M); and (b) bromination of TMB with vi/vo fixed at 100. The Br2 solution was fed from the inner tube (A = 0.01 M). | ||
A performance comparison between the microjet mixers and the other micromixers was conducted. The dimensions of the microjet mixers were set to maintain high vi/vo values. The appropriate feed orientation was determined according to the results from the previous section. Micromixers with a highly optimized structure for mixing with equal flow rates were compared to the microjet mixer using the Villermaux–Dushman reaction. Fig. 6(a) depicts the results. The microjet mixer resulted in the smallest Xs value among all the other examined mixers. The performance of the YMC-Spica mixer did not improve with the increase in the flow rate. The possible reason for this result is the existence of maldistributions due to the complicated structure. The simple geometry of a microjet mixer may also have the advantage of avoiding an unexpected flow behavior. Next, the KM mixer, which is next to the microjet mixer in Fig. 6(a), and an arrowhead static mixer were employed to evaluate the nonuniform flow rate ratio using the bromination of TMB. Fig. 6(b) shows the results of the comparison with FBr2/FTMB = 4. The microjet mixer showed the smallest by-product yield in the vigorous jetting regime. In contrast, the arrowhead static mixer showed better results with a small flow rate due to the porous structure of the frit. However, it lacked the benefit of enhanced mixing by the vortices with the increased inertial force. The advantage of the microjet mixer was clarified from these results.
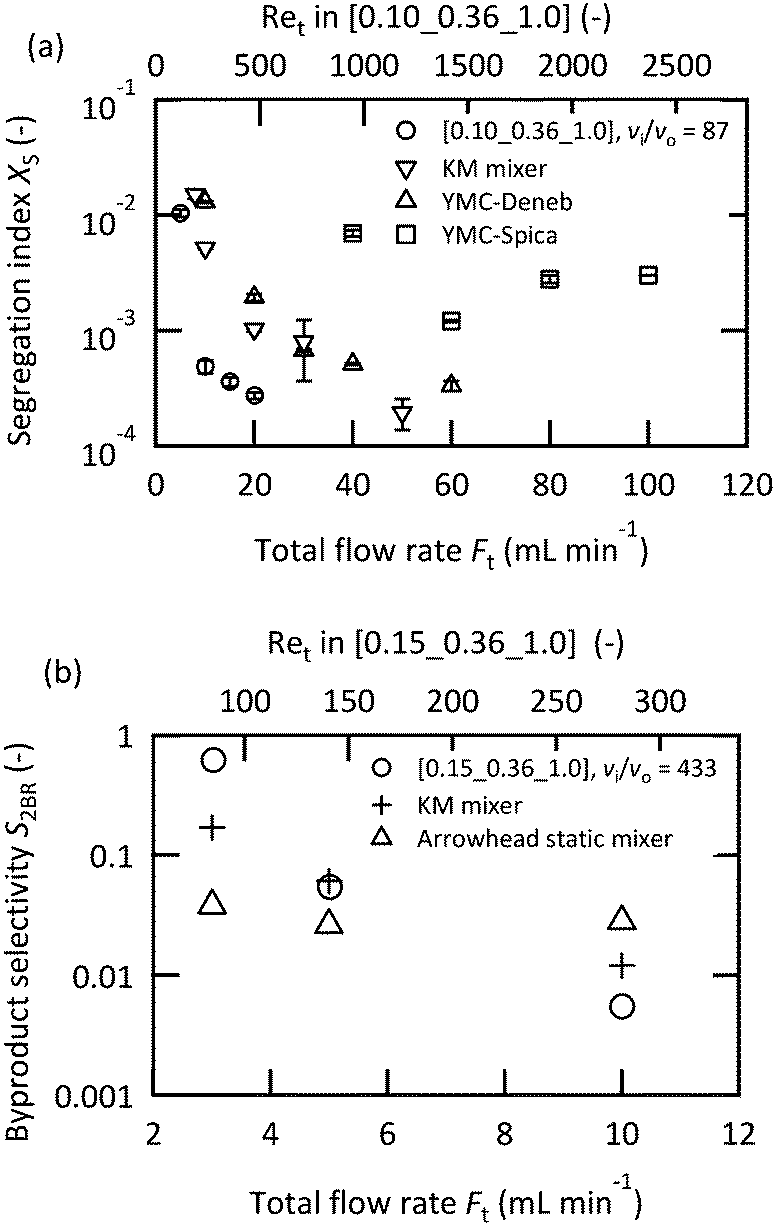 | ||
| Fig. 6 Comparison of the mixing performances of the micromixers: (a) Villermaux–Dushman protocol; the acid solution was fed from the inner tube (CHCl0 = 0.06 M); (b) bromination of TMB with FBr2/FTMB = 4 and A = 0.025 M. The Br2 solution was fed from the inner tube. | ||
For designing an optimal microjet mixer, the relationship between the scale of the channels and the mixing time is essential. Fig. 7(a) shows the mixing times in the vigorous jetting regime against Ret that were measured using three microjet mixers with analogous geometries. The direct observation of phenolphthalein decolorization combined with acid–base neutralization and the indirect estimation from the Villermaux–Dushman reaction were employed. The flow rate of the inner fluid (Fi) and the flow rate of the outer fluid (Fo) were identical. The results from the study of Lim et al.,20 in which a water–ethanol mixture (1:2 in volume ratio) was used, are also included. All of the examined microjet mixers showed similar decay curves using the acid–base neutralization method, and smaller dimensions enabled much faster mixing. The estimates from the Villermaux–Dushman reaction ultimately failed to predict the one-order shorter mixing times from the direct measurements. One of the reasons of the mismatch is due to the confinement of the side reaction around the center axis, which is unique to a microjet mixer. General issues regarding the proposed equation for calculating the mixing time from reaction results, such as the kinetics of the Dushman reaction, which are still under debate,31,52,64 might have also ruined the mixing time estimation. Therefore, we decided to use the mixing time derived from the acid–base neutralization method to design the mixer. The mixing times at Ret = 1000 derived from the visualization method for all mixers are displayed in a double-logarithmic chart in Fig. 7(b). The apparent linearity was confirmed with a power of 2.76. The appropriate dimensions of a microjet mixer can be derived from this relationship.
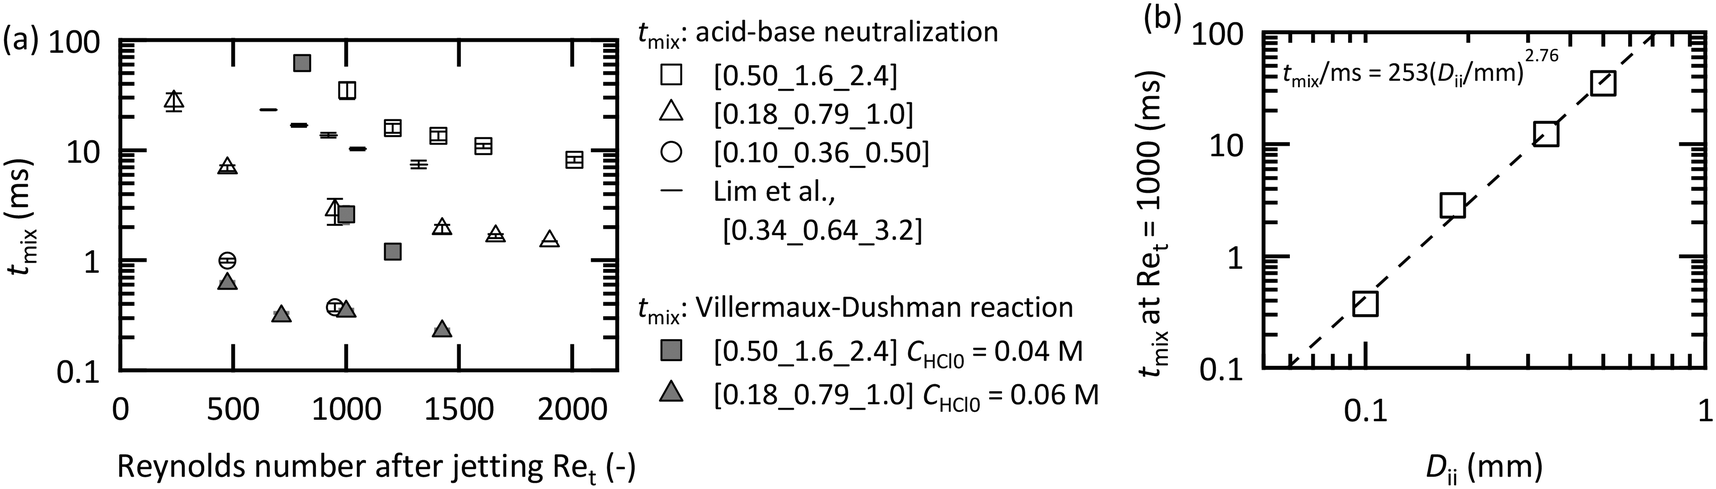 | ||
| Fig. 7 Measured mixing times from the acid–base neutralization method and Villermaux–Dushman reaction for various scales of microjet mixers: (a) mixing time against the Reynolds number after jetting; and (b) log–log plot of the mixing time at Ret = 1000 against the inner diameter of the inner tube (Dii). | ||
Designing a microjet mixer for maximizing the throughput
In operating a microjet mixer, the pressure drop is the primary restriction. The markers in Fig. 8(a) indicate the pressure drop of the inner fluid measured for various flow rates of the inner and outer fluids. The outer fluid did not influence the pressure drop of the inner fluid. The pressure drop (ΔP) of a fluid with a density ρ through a tube with a diameter D with an average velocity v can be written as| ΔP = 2fρv2L/D |
| f = 16/Re |
was proposed based on experimental data.65 The calculated pressure drops from these equations for the inner tube (L = 58 mm, D = 0.10 mm) are displayed as lines in Fig. 8(a). With smaller Re values, the pressure drop exactly agrees with the predictions from the Hagen–Poiseuille equation. With larger Re values, the pressure drop curve increased, but the measured value was approximately 24% smaller than that of the empirical turbulent curve. Fig. 8(b) shows the pressure measured before the inlet of the outer fluid. The pressure value was highly dependent on the flow rate of the inner fluid. By increasing the flow rate of the inner fluid, the pressure value decreased and reached a negative value when the flow rates of both fluids were equal or only the inner fluid flowed. This behavior was attributed to the Venturi effect around the nozzle, which means the fluid pressure decreased due to the partial acceleration of the fluid in a constricted space. For the design and operation of a microjet mixer, the most severe restriction would be the pressure drop of the inner fluid, which was larger by an order of magnitude than that of the outer fluid.
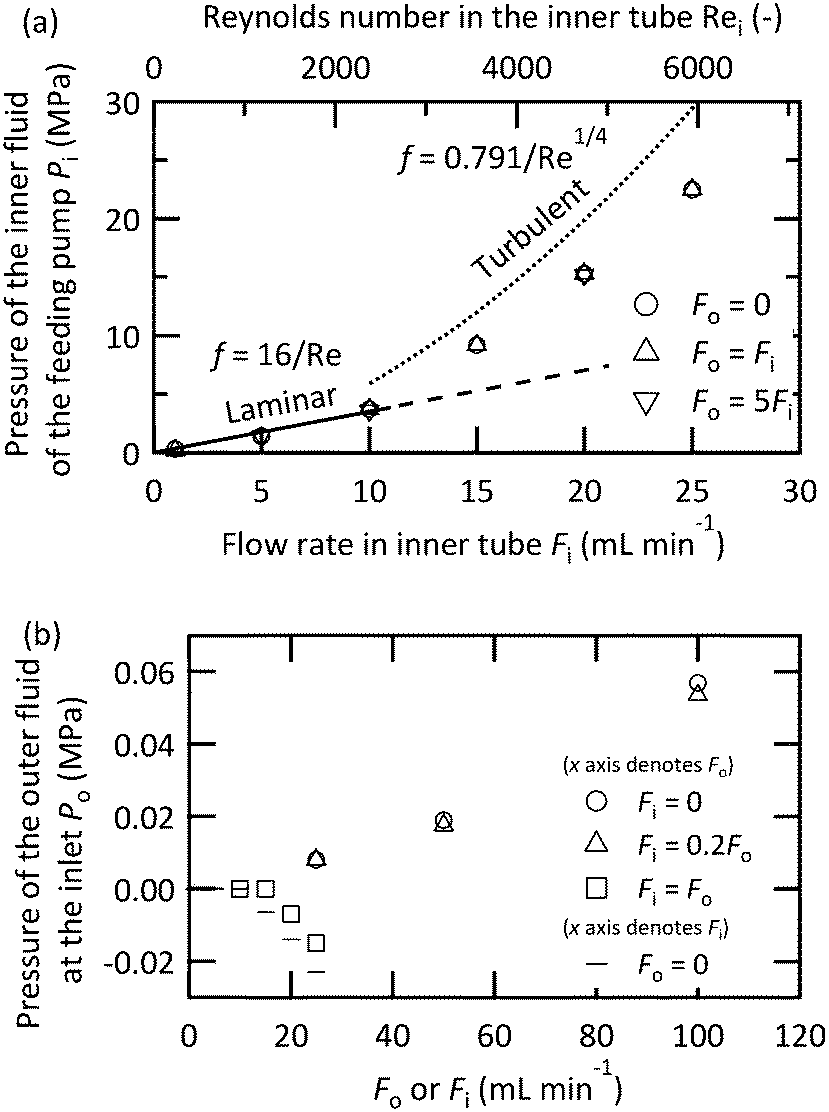 | ||
| Fig. 8 Pressure drop measured at [0.10_0.36_1.0] for the (a) inner fluid while changing the flow rate of the outer fluid and (b) the outer fluid while changing the flow rate of the inner fluid. | ||
We propose a design chart that determines the flow rate and geometry of a microjet mixer based on previously obtained data. Fig. 9 shows the scheme. The procedure can be utilized to obtain the desired throughput while achieving a feasible mixing time and minimizing the generation of undesired by-products. For this scheme, Ret was fixed at 1000 because further increasing the Reynolds number did not result in a dramatic change in the mixing time compared to reducing the dimension of microjet mixer (Fig. 7). The designing scheme starts from deciding the appropriate mixing time, flow rate ratio, and orientation of the feed streams. Regarding the orientation of the feed streams, the reactant that is directly involved in the side reaction should be provided through the inner flow tube, according to the previous discussion. Then, the diameter of the inner tube can be determined from the master curve in Fig. 7(b) with α = 253 ms mm−2.76 and β = 2.76. Next, the flow rate of the inner stream is maximized within the pressure limit of the pump used. With Re smaller than 2100, the pressure loss in the tube can be precisely predicted based on the length and diameter of the inner tube. When the Re in the inner tube is larger than 2100, the turbulence curve of f provides a rough estimation. When possible, experiments using only the single tube can provide the exact pressure loss without considering the effect of the outer fluid on the pressure drop of the inner fluid. Next, the flow rate of the outer stream is derived from the flow rate ratio. After, the inner diameter of the outer tube is decided from the total flow rate and Ret = 1000. The important step is to confirm the geometrical restrictions and velocity ratio for the vigorous jetting regime. If the procedure fails to provide a reasonable answer, the reaction conditions should be modified by changing the reaction temperature or concentrations. Lastly, numbering-up of the microjet mixers should be considered if the maximized single channel throughput is still not sufficient. We demonstrated the numbering-up concept by designing parallelized microjet mixers, as shown in Fig. 10(a). They presented an excellent flow distribution performance. The differences between the average flow rate and the measured values for each channel were −0.28%, 0.51%, 0.04%, and −0.27%. Fig. 10(b) shows the magnified view of the nozzles with phenolphthalein decolorization. The pink color disappeared a few millimeters from all the nozzles, showing that submillisecond mixing was successfully achieved using this numbered-up system. Because previous micromixers that have realized submillisecond mixing were all developed for analytical purposes with small structures with dimensions of tens of microns while ignoring the throughput,66,67 an accurate design strategy for microjet mixers is important for realizing both fast mixing and high throughput.
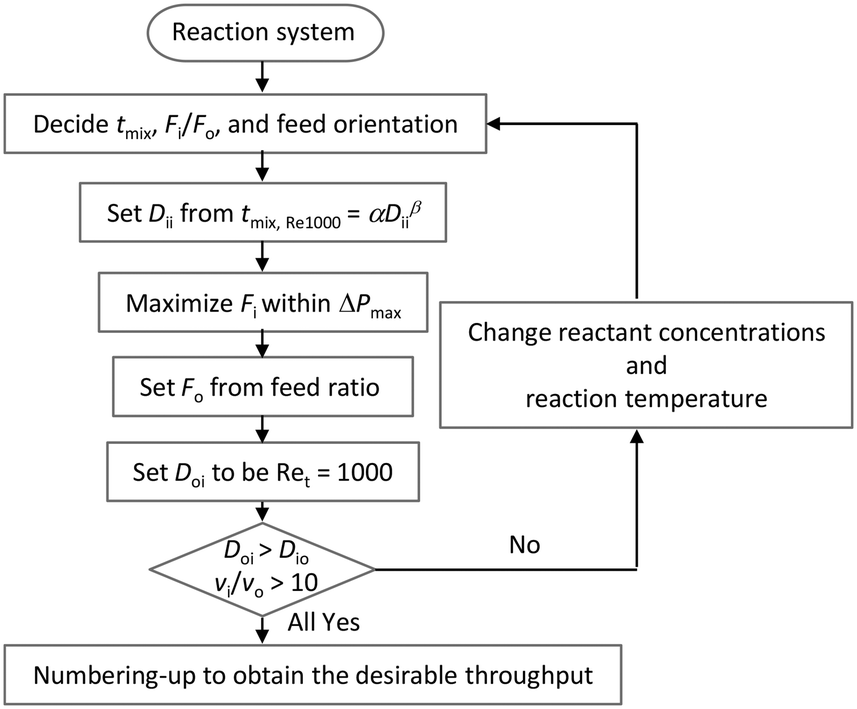 | ||
| Fig. 9 Design chart of a microjet mixer for obtaining a desired throughput while satisfying the mixing time requirement. | ||
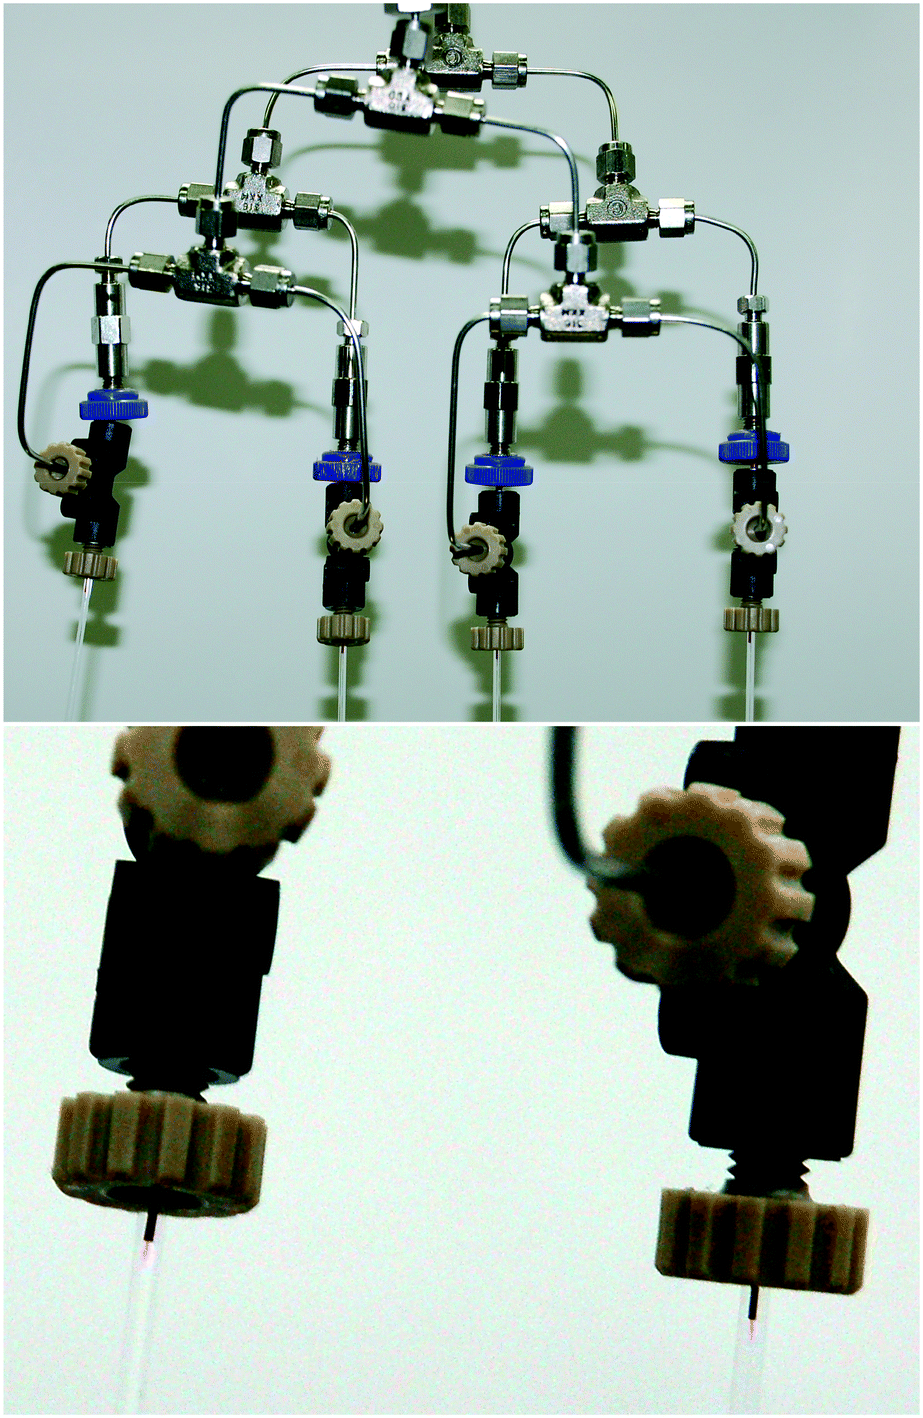 | ||
| Fig. 10 Numbered-up [0.10_0.36_1.0] microjet mixers while observing the decolorization of phenolphthalein at a total flow rate of 170 mL min−1 (Fbase = Facid = 85 mL min−1): (upper picture) full view; (lower picture) magnified view. | ||
Mixing of viscous fluids using the microjet mixer
The established design chart is not applicable to highly viscous fluids because increasing the viscosity dramatically changes the flow behavior in the mixers even with the same Reynolds number.37 The complete evaluation of the viscosity effect is out of the scope of this paper; however, we examined the feed orientation dependence and validated the applicability of the microjet mixer for treating viscous fluids. Fig. 11(a) shows the feed orientation dependence in the case of mixing a glycerol solution and water at the same flow rate. When the highly viscous fluid was fed from the outer tube, vortices evolved more efficiently than that using the inner tube. This orientation is also desirable for reducing the pressure loss because it allows a viscous fluid to flow through a wider cross section. In this orientation, the mixing time was determined and is shown in Fig. 11(b). The mixing time became longer with a higher viscosity; however, mixing in 20 ms was achieved using a 90 wt% glycerol solution using the microjet mixer. This is a significant achievement considering that a complicated micromixer with an orifice that is 20 μm in diameter failed to achieve complete mixing using a 60% glycerol solution (10 mPa s) and an HCl solution.68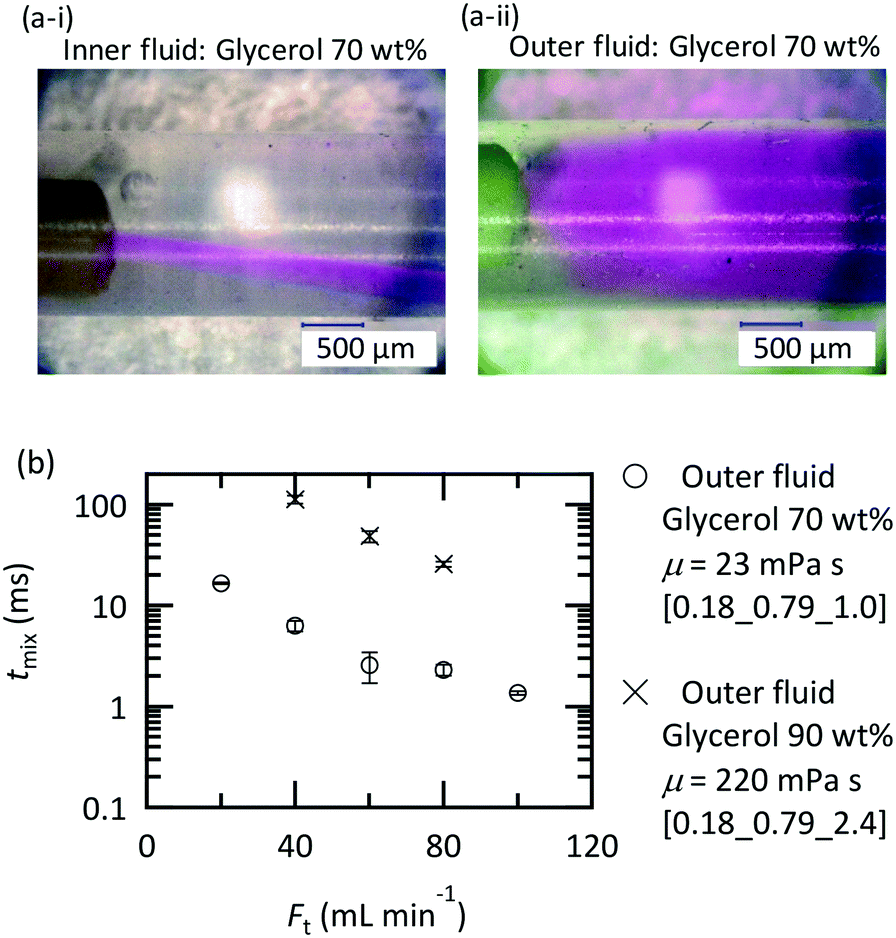 | ||
| Fig. 11 Mixing water and a glycerol solution at the same flow rate: (a) visualization of the flow around the nozzle by coloring the inner fluid with rhodamine B; [0.18_0.79_1.0] at Fi = Fo = 10 mL min−1; (b) mixing time evaluation during neutralization. The phenolphthalein base solution was fed from the inner tube, and the HCl solution with an intensified viscosity was fed from the outer tube. | ||
Conclusions
Carefully designing the operating conditions is essential for attaining the best performance from a microjet mixer. The most important factor in conducting fast chemical reactions using a microjet mixer is the feed orientation. A reactant that is directly involved in both the main and side reactions must be fed from the inner tube so that the side reaction can be confined within a small space. The flow regime can be predicted by only using two operating variables: the Reynolds number after jetting (Ret) and the flow velocity ratio (vi/vo). A vigorous jetting regime with a high Ret and vi/vo resulted in a short mixing time that was linearly related to the mixer scale. With the appropriate choice of the feed orientation, the microjet mixer in the vigorous jetting regime exhibited excellent performance compared to the other micromixers. We proposed a designing scheme to maximize the throughput with a certain mixing time for an arbitrary flow rate ratio. A properly designed microjet mixer would be a powerful tool both for a researcher who seeks to conduct reactions with a short and defined mixing time and for an industrial engineer who wants to obtain the largest throughput while maintaining the product quality with a simple micromixer.The microjet mixer also showed great performance in mixing viscous fluids. We propose feeding viscous fluids from the outer tubes to achieve faster mixing when treating fluids with different viscosities. However, the other orientation may be desirable depending on the reaction mechanism. In a future study on microjet mixers, a detailed model of the jetting process with a highly viscous fluid and a methodology for limiting the performance trade-off will be developed. The quantification of the resistance against clogging, which has been reported to be an important advantage of microjet mixers,19,20 would also be practical and meaningful.
Acknowledgements
We gratefully acknowledge the financial support provided by the Japan Society for the Promotion of Science (JSPS), grant number 25220913 and 15J00287.Notes and references
- K. Mae, Chem. Eng. Sci., 2007, 62, 4842–4851 CrossRef CAS.
- H. Kim, K.-I. Min, K. Inoue, D. J. Im, D.-P. Kim and J.-I. Yoshida, Science, 2016, 352, 691–694 CrossRef CAS PubMed.
- T. Junkers and B. Wenn, React. Chem. Eng., 2016, 1, 60–64 CAS.
- S. Asano, T. Maki, R. Nakayama, R. Utsunomiya, Y. Muranaka, T. Kuboyama and K. Mae, Chem. Eng. Process., 2017, 119, 73–80 CrossRef CAS.
- F. Bally, C. A. Serra, V. Hessel and G. Hadziioannou, Chem. Eng. Sci., 2011, 66, 1449–1462 CrossRef CAS.
- F. A. Leibfarth, J. A. Johnson and T. F. Jamison, Proc. Natl. Acad. Sci. U. S. A., 2015, 112, 10617–10622 CrossRef CAS PubMed.
- S. Watanabe, T. Hiratsuka, Y. Asahi, A. Tanaka, K. Mae and M. T. Miyahara, Part. Part. Syst. Charact., 2015, 32, 234–242 CrossRef CAS.
- S. Watanabe, S. Ohsaki, T. Hanafusa, K. Takada, H. Tanaka, K. Mae and M. T. Miyahara, Chem. Eng. J., 2017, 313, 724–733 CrossRef CAS.
- S. Marre, J. Park, J. Rempel, J. Guan, M. G. Bawendi and K. F. Jensen, Adv. Mater., 2008, 20, 4830–4834 CrossRef CAS.
- V. Sebastián and K. F. Jensen, Nanoscale, 2016, 8, 15288–15295 RSC.
- N. Kockmann, M. Gottsponer and D. M. Roberge, Chem. Eng. J., 2011, 167, 718–726 CrossRef CAS.
- D. M. Roberge, C. Noti, E. Irle, M. Eyholzer, B. Rittiner, G. Penn, G. Sedelmeier and B. Schenkel, J. Flow Chem., 2013, 1, 1 Search PubMed.
- A. Nagaki, Y. Nakahara, M. Furusawa, T. Sawaki, T. Yamamoto, H. Toukairin, S. Tadokoro, T. Shimazaki, T. Ito, M. Otake, H. Arai, N. Toda, K. Ohtsuka, Y. Takahashi, Y. Moriwaki, Y. Tsuchihashi, K. Hirose and J. I. Yoshida, Org. Process Res. Dev., 2016, 20, 1377–1382 CrossRef CAS.
- N. Daito, N. Aoki, J. I. Yoshida and K. Mae, Ind. Eng. Chem. Res., 2006, 45, 4954–4961 CrossRef CAS.
- F. Bally, C. A. Serra, V. Hessel and G. Hadziioannou, Macromol. React. Eng., 2010, 4, 543–561 CrossRef CAS.
- C. Rosenfeld, C. Serra, C. Brochon and G. Hadziioannou, Lab Chip, 2008, 8, 1682–1687 RSC.
- D. Yamamoto, T. Maki, S. Watanabe, H. Tanaka, M. T. Miyahara and K. Mae, Chem. Eng. J., 2013, 227, 145–150 CrossRef CAS.
- L. Zhou, S. Wang, D. Xu and Y. Guo, Ind. Eng. Chem. Res., 2014, 53, 481–493 CrossRef CAS.
- D. Liu, S. Cito, Y. Zhang, C.-F. Wang, T. M. Sikanen and H. A. Santos, Adv. Mater., 2015, 27, 2298–2304 CrossRef CAS PubMed.
- J. M. Lim, A. Swami, L. M. Gilson, S. Chopra, S. Choi, J. Wu, R. Langer, R. Karnik and O. C. Farokhzad, ACS Nano, 2014, 8, 6056–6065 CrossRef CAS PubMed.
- N. Kockmann, J. Kastner and P. Woias, Chem. Eng. J., 2007, 135, 110–116 CrossRef.
- R. L. Hartman, J. R. Naber, N. Zaborenko, S. L. Buchwald and K. F. Jensen, Org. Process Res. Dev., 2010, 14, 1347–1357 CrossRef CAS.
- N. Kockmann, T. Kiefer, M. Engler and P. Woias, Sens. Actuators, B, 2006, 117, 495–508 CrossRef CAS.
- D. Haller, P. Woias and N. Kockmann, Int. J. Heat Mass Transfer, 2009, 52, 2678–2689 CrossRef.
- F. Jiang, K. S. Drese, S. Hardt, M. Küpper and F. Schönfeld, AIChE J., 2004, 50, 2297–2305 CrossRef CAS.
- A. Günther, M. Jhunjhunwala, M. Thalmann, M. A. Schmidt and K. F. Jensen, Langmuir, 2005, 21, 1547–1555 CrossRef PubMed.
- S. Asano, T. Maki and K. Mae, AIChE J., 2016, 62, 1154–1161 CrossRef CAS.
- H. Nagasawa, N. Aoki and K. Mae, Chem. Eng. Technol., 2005, 28, 324–330 CrossRef CAS.
- H. Nagasawa and K. Mae, Ind. Eng. Chem. Res., 2006, 45, 2179–2186 CrossRef CAS.
- R. Baber, L. Mazzei, N. T. K. Thanh and A. Gavriilidis, J. Flow Chem., 2016, 6, 268–278 CrossRef.
- A. Kölbl, M. Kraut and A. Wenka, Chem. Eng. J., 2011, 167, 444–454 CrossRef.
- L. Zhendong, L. Yangcheng, W. Jiawei and L. Guangsheng, Chem. Eng. J., 2012, 181–182, 597–606 CrossRef.
- M. A. Sultan, K. Krupa, C. P. Fonte, M. I. Nunes, M. M. Dias, J. C. B. Lopes and R. J. Santos, Chem. Eng. Technol., 2013, 36, 323–331 CrossRef CAS.
- C. Y. Ma, M. Chen and X. Z. Wang, Chem. Eng. Sci., 2014, 109, 26–37 CrossRef CAS.
- K. Yang, G. Chu, L. Shao, Y. Xiang, L. Zhang and J. Chen, Chin. J. Chem. Eng., 2009, 17, 546–551 CrossRef CAS.
- W. F. Fang and J. T. Yang, Sens. Actuators, B, 2009, 140, 629–642 CrossRef CAS.
- X. Shi, Y. Xiang, L.-X. Wen and J.-F. Chen, Ind. Eng. Chem. Res., 2012, 51, 13944–13952 CrossRef CAS.
- M. Rahimi, P. Valeh-e-Sheyda, M. A. Parsamoghadam, N. Azimi and H. Abidi, Chem. Eng. Process., 2014, 85, 178–186 CrossRef CAS.
- M. Furuta, K. Mukai, D. Cork and K. Mae, Chem. Eng. Process., 2016, 102, 210–218 CrossRef CAS.
- M. Sultana and K. F. Jensen, Cryst. Growth Des., 2012, 12, 6260–6266 CAS.
- S. A. Khan and K. F. Jensen, Adv. Mater., 2007, 19, 2556–2560 CrossRef CAS.
- N. Aoki, A. Sato, H. Sasaki, A. A. Litwinowicz, G. Seong, T. Aida, D. Hojo, S. Takami and T. Adschiri, J. Supercrit. Fluids, 2016, 110, 161–166 CrossRef CAS.
- P. W. Dunne, E. Lester and R. I. Walton, React. Chem. Eng., 2016, 1, 352–360 CAS.
- A. S. Munn, P. W. Dunne, S. V. Y. Tang and E. H. Lester, Chem. Commun., 2015, 51, 12811–12814 RSC.
- A. Nagaki, K. Imai, H. Kim and J. Yoshida, RSC Adv., 2011, 1, 758–760 RSC.
- A. Nagaki, T. Iwasaki, K. Kawamura, D. Yamada, S. Suga, T. Ando, M. Sawamoto and J. I. Yoshida, Chem. – Asian J., 2008, 3, 1558–1567 CrossRef CAS PubMed.
- N. Kockmann, S. Dreher, M. Engler and P. Woias, Microfluid. Nanofluid., 2007, 3, 581–589 CrossRef CAS.
- L. S. Mendez-Portillo, M. Heniche, C. Dubois and P. A. Tanguy, AIChE J., 2013, 59, 988–1001 CrossRef CAS.
- L. Falk and J. M. Commenge, Chem. Eng. Sci., 2010, 65, 405–411 CrossRef CAS.
- M.-C. Fournier, L. Falk and J. Villermaux, Chem. Eng. Sci., 1996, 51, 5053–5064 CrossRef CAS.
- J. M. Commenge and L. Falk, Chem. Eng. Process., 2011, 50, 979–990 CrossRef CAS.
- J. R. Bourne, Chem. Eng. J., 2008, 140, 638–641 CrossRef CAS.
- A. Kölbl, M. Kraut and R. Dittmeyer, Chem. Eng. Sci., 2013, 101, 454–460 CrossRef.
- A. Kölbl and M. Kraut, AIChE J., 2011, 57, 835–840 CrossRef.
- J. S. Zhang, K. Wang, Y. C. Lu and G. S. Luo, Chem. Eng. Process., 2010, 49, 740–747 CrossRef CAS.
- Y. Lin, X. Yu, Z. Wang, S. T. Tu and Z. Wang, Chem. Eng. J., 2011, 171, 291–300 CrossRef CAS.
- J. Villermaux and L. Falk, Chem. Eng. Sci., 1994, 49, 5127–5140 CrossRef CAS.
- K. J. Hecht, A. Kölbl, M. Kraut and K. Schubert, Chem. Eng. Technol., 2008, 31, 1176–1181 CrossRef CAS.
- S. Dreher, N. Kockmann and P. Woias, Heat Transfer Eng., 2009, 30, 91–100 CrossRef CAS.
- M. C. Rose and J. Stuehr, J. Am. Chem. Soc., 1968, 90, 7205–7209 CrossRef CAS.
- Y. Su, K. Kuijpers, V. Hessel and T. Noël, React. Chem. Eng., 2016, 1, 73–81 CAS.
- K. P. L. Kuijpers, M. A. H. van Dijk, Q. G. Rumeur, V. Hessel, Y. Su and T. Noël, React. Chem. Eng., 2017, 2, 109–115 CAS.
- M. Kashid, A. Renken and L. Kiwi-Minsker, Chem. Eng. J., 2011, 167, 436–443 CrossRef CAS.
- A. Kölbl, Chem. Eng. J., 2008, 145, 176–177 CrossRef.
- R. B. Bird, W. E. Stewart and E. N. Lightfoot, Transport Phonomena, John Wiley & Sons, Inc., Revised 2nd, 2006 Search PubMed.
- Y. Li, C. Liu, X. Feng, Y. Xu and B. F. Liu, Anal. Chem., 2014, 86, 4333–4339 CrossRef CAS PubMed.
- W. Buchegger, C. Wagner, B. Lendl, M. Kraft and M. J. Vellekoop, Microfluid. Nanofluid., 2011, 10, 889–897 CrossRef CAS.
- A. V. Cherepanov and S. de Vries, Biochim. Biophys. Acta, Bioenerg., 2004, 1656, 1–31 CrossRef CAS PubMed.
| This journal is © The Royal Society of Chemistry 2017 |