 Open Access Article
Creative Commons Attribution 3.0 Unported Licence
High-performance monoliths in heterogeneous catalysis with single-phase liquid flow†
Christian P.
Haas
a,
Tibor
Müllner
a,
Richard
Kohns
ab,
Dirk
Enke
b and
Ulrich
Tallarek
 *a
*a
aDepartment of Chemistry, Philipps-Universität Marburg, Hans-Meerwein-Straße 4, 35032 Marburg, Germany. E-mail: tallarek@staff.uni-marburg.de; Web: http://www.uni-marburg.de/fb15/ag-tallarek Fax: +49 6421 28 27065; Tel: +49 6421 28 25727
bInstitute of Chemical Technology, Universität Leipzig, Linnéstraße 3, 04103 Leipzig, Germany
First published on 28th April 2017
Abstract
Hierarchical, macro-mesoporous silica monoliths with domain sizes (sum of mean macropore size and skeleton thickness) of ∼1 μm are highly efficient supports in heterogeneous catalysis with single-phase liquid flow. Their unprecedented performance regarding low backmixing, the elimination of internal and external diffusive transport limitations, as well as the simultaneous realization of a large (internal and external) surface area of the monolith skeleton allow reactor operation under exclusive reaction control. For experimental characterization, the Knoevenagel condensation was employed with an aminopropylated silica monolith integrated into an on-line coupled, high-pressure reaction–analysis system. It allows precise, fully automated adjustment and control of all relevant reaction parameters and promises a boost in the rapid, reproducible determination of the intrinsic reaction kinetics, in general. Hydrodynamic and reaction kinetic parameters identify extreme plug-flow conditions with this high-surface-area, compact type of microreactor and quasi-homogeneous operation in continuous-flow mode.
1. Introduction
Continuous-flow microreactor technology shows huge potential in organic synthesis for safety issues, precise control, and intensification of chemical reaction processes in industry and the lab (e.g., flash chemistry).1–4 However, trickle-bed reactors and slurry bubble columns are still the workhorses in the chemical industry for multiphase operations involving heterogeneously catalyzed reactions with gas–liquid reactants. While stirring in the slurry reactor prevents catalyst particles from settling and allows active mixing at high Reynolds numbers (minimizing temperature and concentration gradients), subsequent separation of the catalyst particles and partial replacement due to damage from attrition is required. In fixed-bed reactors, by contrast, these disadvantages are absent, but much larger catalyst particles are employed than in the slurry reactor to adjust for a convenient hydraulic (Darcy) permeability. On the other hand, this also increases mass transfer resistance with respect to diffusion into and through the large porous particles. To avoid intrinsic coupling of the characteristic diffusion length (Ldiff) inside the fully porous catalyst particles with the characteristic dimension of the flow channels (Lflow) between the particles in a fixed-bed reactor, hierarchically structured monoliths have been used as alternative supports for heterogeneously catalyzed reactions.5–9 They allow to combine the continuous-flow operational advantages of a fixed-bed over a slurry reactor with a much larger morphological flexibility than for particulate packings. This is illustrated by Fig. 1, where Ldiff characterizes diffusion-limited transport in the intraskeleton pore space (containing practically the entire active surface). Complementary, Lflow represents hydrodynamic (usually advection-dominated) transport through the monolith, but also the lateral diffusion from the flow-channel center to the channel walls, where reactants find entrance to the pore space with the large, active surface.7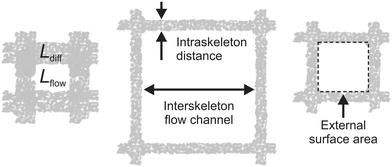 | ||
| Fig. 1 Decoupling of diffusion length Ldiff and flow-channel size Lflow in monoliths. Ldiff characterizes diffusive transport in the intraskeleton pore space providing the large, active surface (here, in the porous walls of the square channels); Lflow characterizes the advection-dominated transport in the interskeleton flow channels (thus, hydraulic permeability and hydrodynamic dispersion), but also lateral diffusion times the reactants need to reach the walls' external surface from the channel center, where they get access via the pore entrances to the walls' internal surface. Adapted with permission from Moulijn et al.7 (© 2011 Elsevier). | ||
Fig. 1 highlights the key advantage of monoliths over particulate fixed beds, i.e., the porous-layer (or skeleton) thickness can be adjusted independently from the interstitial microchannel (macropore) size, realizing a decoupling of the internal diffusion length in the catalyst from its hydraulic permeability and external surface area.10 Independent tuning of Ldiff and Lflow allows, for example, to combine short diffusion lengths (corresponding to thin catalyst layers) with flow-channels that provide well-defined residence times and minimal pressure drop. Further, the monolith in Fig. 1 offers a regular structure, i.e., the repeated microchannel pattern of square cells.5,7 Therefore, structures can be designed with all essential details up to the macroscopic confinement of a catalyst. It offers full control over local environments, including the interplay as well as separate optimization of the intrinsic reaction kinetics, transport phenomena, and hydrodynamics.11,12
Structured monoliths (catalysts) of the type represented by Fig. 1 have been efficiently used in practical applications,7 particularly in combination with slug (or Taylor) flow to realize liquid–gas transport that combines low pressure drop with high mass transfer rates (good mixing on slug level) and almost plug-flow behavior (little longitudinal mixing).5,13 Compared with this solid–liquid–gas and also the well-established solid–gas processing, where flow-through pores approach millimeter-dimension to guarantee a high permeability and low energy consumption, the application of monolithic supports for solid–liquid catalysis with single-phase liquid flow still emerges from a niche for low-temperature processes, particularly in the continuous-flow production of pharmaceuticals and fine chemicals.2,6,8,14–20 However, for liquid flow operation, millimeter-sized channels are unsuitable, as they lead to excessive longitudinal mixing (due to the parabolic pore-level flow profile under laminar conditions) and long lateral diffusion times for reactants in the flow channels to reach the external surface area and enter the internal pore space with the active surface. This inevitably results in unrealistic reactor residence times and very wide (as well as tailing) residence time distributions.
We therefore turn to much smaller flow-through channels (or macropores), from the millimeter down to the lower micrometer or even sub-micrometer dimension. Along this direction, organic polymer, polymer-on-glass, and silica monoliths offer a range of flexible morphologies and a portfolio of surface modifications.2,6,8,14–20 With respect to soft polymeric materials, sol–gel and porous glass-based silica monoliths have a higher mechanical and thermal stability and are also more resistant to a wider range of solvents for solid–liquid operation. By taking the drastic step towards sub-micrometer Lflow and Ldiff in hierarchical catalytic fixed-bed reactors (with solid–liquid processing), high-performance catalyst supports can be realized and the following goals are envisioned:
(i) elimination of external (Lflow) and internal (Ldiff) diffusive transport limitations (i.e., due to the diffusion towards and within the porous walls or skeleton), even with liquid-phase transport, when diffusion coefficients are four orders of magnitude smaller than in the gas phase and also slug flow cannot be used;
(ii) realization of plug-flow conditions by drastic reduction of backmixing caused by Taylor dispersion in the flow-channels (Lflow) and hold-up dispersion due to stagnant regions in the porous walls or skeleton (Ldiff); and
(iii) maximization of the external surface area (cf.Fig. 1), where flowing and stagnant fluids are getting in contact, to intensify mass transport to and from the active surface as well as convective heat removal.
The actual interplay between a large external surface area (realized with a small Lflow and a high macroporosity), the short diffusion lengths (small Lflow and Ldiff), and a homogeneous monolith morphology (preparation conditions) allows excellent heat transfer properties to be combined with extremely narrow residence time distributions so that a uniform residence time is expected for each reactant. If the reaction is sufficiently slow in the absence of the catalyst, it will only be observed as long as the mixed reactant solutions contact the catalytic microreactor. This, in turn, allows to translate mean velocity (together with the length of the support) into a precisely defined reaction time. It enables the systematic optimization of reaction times and thus helps to avoid side and consecutive reactions, a major goal, e.g., in the preparation of pharmaceuticals and fine chemicals or platform molecules from biomass.21–23 Until now, high-resolution reaction time control is only implemented for open-tubular microreactors, where reactions proceeding via non-catalytic or homogeneously catalyzed pathways usually start by mixing two reaction components and are quenched thermally or chemically.1,24–26 Inefficient heating, cooling, and mixing may bias the processed data. By contrast, the immobilization of the catalyst allows to separate heating, mixing, and chemical reaction in space and time.
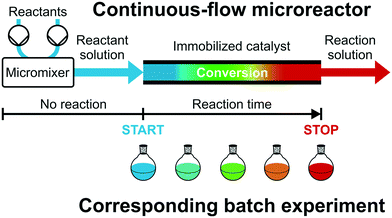
Fig. 2 illustrates this concept, i.e., different reactant solutions can be conveniently mixed by a micromixer and preheated before starting the reaction on the catalytic microreactor. Recently, Moore and Jensen24 have described a low-dispersion flow reactor as a series of batch reactors. Catalytic microreactors with high-performance supports (low-dispersion fixed-beds) can be treated just like batch reactors operated with small particles and high stirring rates, if transport limitations are avoided. With initial concentrations matched in both reactor types, the actual position of the reactant solution in the flow reactor can be translated into corresponding reaction time by the mean velocity and, therefore, into a series of batch experiments with equivalent reaction times and conversions (illustrated by the color gradient in Fig. 2). If the low-dispersion properties of the microreactor are conserved at increasing flow rate, a reaction time variation can be achieved with the reactor length as well as by the much more convenient adjustment of the flow rate (at a given reactor length), providing access to multiple reaction times in a single flow experiment. This allows to rapidly generate “batch” kinetic and catalytic data under steady-state continuous-flow conditions and to establish a fully automated optimization of reaction conditions or rapid screening of new heterogeneous catalysts.27,28
Catalytic fixed-bed reactors with flow-through channels or macropores in the lower micrometer (or even sub-micrometer) range relegate solid–liquid operation into the regime of high-pressure solid–liquid catalysis (HPSLC), with pressures exceeding 100 bar.29 While many applications, e.g., in solid–gas environmental catalysis, are unarguably motivated by the ambition to realize low pressure drops at high flow rates, so that pressure drop is a critical design factor, we target high efficiency and selectivity (a large internal and external surface area in combination with negligible mass transfer resistance and low backmixing) as well as space–time utilization (small and compact reactors, short contact times) first in HPSLC. Moreover, small Lflow and Ldiff keep the driving forces for mass transfer, heat transfer, and reaction high. It allows operation with much shorter catalyst beds and/or higher flow rates (shorter contact times) and opens the avenue for (solid–liquid) short-contact-time reactors, an exciting field with still many opportunities. Suitable instrumentation for HPSLC is available. In high-performance liquid chromatography (HPLC) silica monoliths and particulate beds are operated up to pressures of several hundred bar on a routine basis.30–32 Why should process intensification in HPSLC then be sacrificed for pressure drop?
With this potential of catalytic continuous-flow microreactors, e.g., in flash chemistry (where high-resolution reaction time control is crucial), it is surprising that the exciting research area and operational domain of HPSLC, especially with monolithic continuous-flow microreactors, is practically unexplored and undocumented, although instrumentation, monolithic supports, and relevant chemical reactions are readily available. For example, silica-based monoliths are routinely employed in HPLC,30–32 so why not use them in HPSLC as well? Promising examples of their application as catalytic reactors in that regard (solid–liquid operation) have already been reported and are summarized in a very recent review.17 This includes the implementation of the Knoevenagel condensation33 and the Diels–Alder reaction,34 or the application of palladium-loaded monoliths for selective hydrogenation.35
With the present work, we fill the gap between these previous studies and true HPSLC operation (facing backpressures > 100 bar) by combining concepts from flow chemistry, synthetic organic chemistry, heterogeneous catalysis, on-line quantitative chemical analysis, advanced materials, and reaction engineering. It paves the way for systematic screening of intrinsic reaction kinetics and rational reactor design by the individually addressable optimization of transport phenomena and hydrodynamics.
2. Materials and methods
2.1 Heterogeneously catalyzed reaction
As well-known test reaction for the evaluation of diffusion- and/or reaction-limitations in the silica-based monolith employed as continuous-flow microreactor, we used the base-catalyzed Knoevenagel condensation between benzaldehyde (BA) and ethyl cyanoacetate (ECA) to ethyl trans-α-cyanocinnamate (ECC). This reaction was implemented using a hierarchical (macro-mesoporous) silica monolith with aminopropylated silica (APS) surface and investigated in the temperature range of T = 10–40 °C. The also produced water is continuously removed from the microreactor with ethanol as the solvent. The latter was chosen since it has a low price and is environmentally benign.36 The greener water, though possible as solvent,37,38 is unsuitable here due to the low conversion and limited solubility of BA, ECA, and especially ECC.The Knoevenagel condensation belongs to the important carbon–carbon bond forming reactions in organic synthesis.39,40 We have adapted Scheme 1, since the Knoevenagel condensation has proven as adequate test reaction for heterogeneous base catalysis over the last decades and is therefore excessively used to evaluate basic catalysts, typically in batch mode.41 Although heterogeneous organocatalysis in continuous-flow mode (also with silica supports) receives increased attention,42–44 reports on the Knoevenagel reaction with fixed catalyst supports (porous-layer open-tubular design, monoliths, particulate beds) are relatively scarce.16,17,45–53 In both modes, however, the analysis of reaction products has so far almost exclusively been conducted off-line by gas chromatography.
2.2 Chemicals and materials
Reactants and the solvent of the adapted reaction system (Scheme 1) were used as received. BA (ReagentPlus®, ≥99%) was purchased from Sigma-Aldrich (St. Louis, MO) in highest possible purity. ECA (99%) was bought at Fluorochem (Hadfield, U.K.) and absolute ethanol (AnalaR NORMAPUR® ACS, Reag. Ph. Eur.) came from VWR International (Darmstadt, Germany). The condensation product ECC (99%) was also purchased from Sigma-Aldrich and used for calibration and solubility tests.For the HPSLC studies (Scheme 1) we used an APS monolith research sample, received from Merck Millipore (Darmstadt, Germany) as analytical column (4.6 mm inner diameter × 100 mm length) clad in polyether ether ketone (Chromolith® HighResolution NH2 100-4.6 mm). The preparation of the Chromolith® HighResolution monoliths is based on an established procedure described in more detail in ref. 30 and 54 (and references therein). These commercially available monoliths are a benchmark with conservative morphological properties. We have previously analyzed their hierarchical morphology from pore scale to macroscopic bed scale,32,55–60 and the morphological properties relevant to the present study are provided in section 2.3. For HPLC coupled on-line to HPSLC (section 2.4), we employed a morphologically similar monolith but with C18-modified, fully end-capped surface suitable for separation of reactants and product in 50![[thin space (1/6-em)]](https://www.rsc.org/images/entities/char_2009.gif) :
:![[thin space (1/6-em)]](https://www.rsc.org/images/entities/char_2009.gif) 50 (v/v) water/ethanol (Chromolith® HighResolution RP-18e 100-4.6 mm). HPLC-grade water was obtained from a Milli-Q gradient purification system (Millipore, Bedford, MA).
50 (v/v) water/ethanol (Chromolith® HighResolution RP-18e 100-4.6 mm). HPLC-grade water was obtained from a Milli-Q gradient purification system (Millipore, Bedford, MA).
2.3 Silica-based monoliths as microreactor and separation column
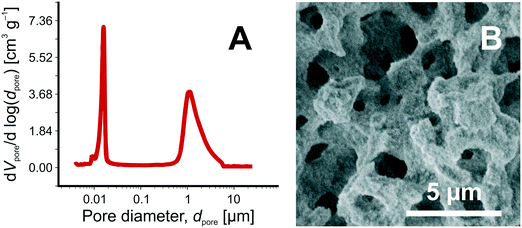
Silica monoliths with hierarchically structured pore space are important supports for chemical separations30,31 and heterogeneous catalysis.17 Their hierarchical architecture is realized with a continuous block of silica perforated by intersecting networks of larger and smaller pores.61,62 Macropores (>50 nm) allow fast, advection-dominated transport through the material; micro- and mesopores (<2 nm and 2–50 nm, respectively), accessible only by diffusion, generate a large surface area for adsorption and reaction. The silica-based monolithic columns used in the current work are prepared with tetramethoxysilane and polyethylene oxide as reactants in a sol–gel process accompanied by phase separation.54 The interskeleton macropores and a meso-microporous silica skeleton are formed during the sol–gel transition that accompanies spinodal decomposition of the reactants.61,63 In a second step, intraskeleton micropores are widened into mesopores by hydrothermal treatment. It results in hierarchical macro-mesoporous monoliths with interskeleton macropores and intraskeleton mesopores, without micropores.54Independent adjustment of macropore size and skeleton thickness allows to decouple hydraulic permeability and advection-dominated macropore-scale hydrodynamic dispersion (Lflow) from diffusion-limited intraskeleton mass transport (Ldiff) and mesopore space loading capacity.20 It gives the materials chemist a wider influence over properties of the final product than possible with traditional (particulate) fixed beds. Fig. 3 illustrates the hierarchical morphology of the macro-mesoporous silica-based monoliths employed here as 4.6 mm inner diameter × 100 mm length columns, i.e., as catalyst support for HPSLC and as analytical separation column in the on-line coupled HPLC.
We have already characterized in detail the hierarchical morphology of the macro-mesoporous monoliths used in this work for the two-dimensional HPSLC–HPLC experiments (Chromolith® HighResolution columns).32,55–60 The relevant parameters, needed for example to estimate the effective diffusion coefficient of ECA in the mesoporous skeleton of the APS monolith (for the calculation of its Thiele modulus, cf. section 3.5), are summarized in Table 1. These data have been derived using complementary approaches and involved (i) standard methods like nitrogen physisorption, mercury intrusion porosimetry, scanning electron microscopy;32,56–58 (ii) insight from morphological analysis of reconstructed macro- and mesopore spaces32,56,58–60 (obtained by focused ion-beam scanning electron microscopy or confocal laser scanning microscopy for reconstruction of the macropore space32,56,59,60 and scanning transmission electron microscopy for the mesopore space53); (iii) macroscopic mass transport experiments;32,56,57 and (iv) direct numerical simulation of diffusion coefficients, flow, and hydrodynamic dispersion coefficients in the physically reconstructed pore spaces.55
| Macropore space | Mesopore space | ||||||
|---|---|---|---|---|---|---|---|
| d macro [μm] | V macro [ml g−1] | ε macro [−] | d meso [Å] | V meso [ml g−1] | ε meso [−] | τ meso [−] | S BET [m2 g−1] |
| 1.15 | 1.95 | 0.57 | 150 | 1.0 | 0.68 | 1.25 | 250 |
The characteristics in Table 1 include the mean pore diameter (d), pore volume (V), and porosity (ε) for macropore space (macro) and mesopore space (meso) in these monoliths, as well as an estimate of the mesopore space tortuosity (τmeso).57 Aminopropylation of the silica surface of the Chromolith® HighResolution NH2 100-4.6 mm column for the Knoevenagel condensation (cf.Scheme 1) was adapted from literature.64,65 The specific surface area is ∼250 m2 g−1 and the coverage with aminopropyl groups is ∼2.8 μmol m−2 (determined by elemental analysis). Macro- and mesoporosity can be related to the total porosity of the monoliths (εtotal) as follows
| εtotal = (1 − εmacro)εmeso + εmacro, | (1) |
 | (2) |
 | (3) |
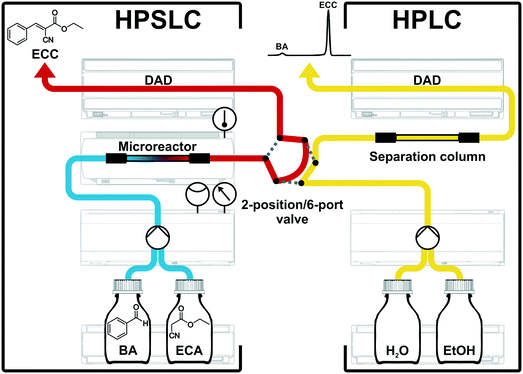
2.4 HPSLC–HPLC instrumentation and catalytic testing
Solid–liquid operation with system backpressures >100 bar can be easily managed by modern HPLC systems, without making any compromise regarding safety issues. A commercial HPLC system was therefore adapted to a flow-chemistry apparatus using the APS monolith as catalytic microreactor. All instrumental components of this configuration were received from Agilent Technologies (Waldbronn, Germany). Fig. 4 shows individual parts of this two-dimensional HPSLC–HPLC setup as well as the associated flow chart.For HPSLC operation, reactant solutions of BA and ECA (in ethanol) were provided in separate bottles. These solutions were degassed, pumped, and mixed by the binary-pump device (Agilent 1290 Infinity Series, G4220A) and then delivered to the microreactor, where the reaction took place on its APS surface (cf. section 2.1). The monolithic microreactor was fixed in a dedicated, thermostatted HPLC column compartment (Agilent 1290 Infinity Series, G1316C) allowing for a specified temperature accuracy of ±0.8 °C and a temperature stability of ±0.05 °C. For in-line study of the reaction solution a diode array detector (Agilent 1100 Series, G1315A) was placed directly behind the microreactor. This instrumentation allowed us to operate the monolith (4.6 mm inner diameter × 100 mm length) up to backpressures of 350 bar in a rapid and reproducible manner. To receive quantitative information about the reaction solution a second high-pressure dimension (HPLC separation) was on-line coupled to the HPSLC setup.19,26,67 A valve with two positions and six ports (Agilent 1200 Series, G1158A) connected the HPSLC dimension with the analytical HPLC setup. An injection loop integrated in the valve allowed us to generate and transfer discrete plugs of the reaction solution from the HPSLC to the HPLC dimension. In the load-position, the reaction solution just flowed over the injection loop (red flow path, Fig. 4); when switching the valve to the inject-position, the injection loop was flushed by the eluents of the HPLC dimension (grey dotted lines in Fig. 4) and an injection plug of the reaction solution (2.6 μL volume) was delivered to the separation column. Typically, the valve was switched from load to inject for 0.4 min and then turned back.
For the on-line coupled second dimension a modern HPLC setup was used. This consisted of a binary pump (Agilent 1290 Infinity Series, G4220A), a sample-injection device, an analytical separation column (cf. section 2.2), and a diode array detector (Agilent 1200 Series, G1315C). Chromatographic separation of reactants and product is achieved, which allows a quantification (peak integration) and identification (UV/VIS spectra) of the different chemical species. HPLC was isocratically run using 50![[thin space (1/6-em)]](https://www.rsc.org/images/entities/char_2009.gif) :
:![[thin space (1/6-em)]](https://www.rsc.org/images/entities/char_2009.gif) 50 (v/v) water/ethanol as eluent at a volumetric flow rate of Q = 1.5 mL min−1 (uav = 1.75 mm s−1). These conditions allowed a baseline separation of the reactant BA from the condensation product ECC (cf. Fig. S1 in the ESI†) and also provided an adequate time resolution of 5 minutes per measurement. For the detection of the aromatic compounds BA and ECC the chromatograms were recorded at a wavelength of 250 nm (Fig. S2†). The concentration of ECC was quantified by standard calibration, for which the purchased ECC was used (Fig. S3†).
50 (v/v) water/ethanol as eluent at a volumetric flow rate of Q = 1.5 mL min−1 (uav = 1.75 mm s−1). These conditions allowed a baseline separation of the reactant BA from the condensation product ECC (cf. Fig. S1 in the ESI†) and also provided an adequate time resolution of 5 minutes per measurement. For the detection of the aromatic compounds BA and ECC the chromatograms were recorded at a wavelength of 250 nm (Fig. S2†). The concentration of ECC was quantified by standard calibration, for which the purchased ECC was used (Fig. S3†).
The utilization of high-end HPLC devices in the adapted configuration (Fig. 4) allows precise control over all relevant reaction parameters in the microreactor, i.e., the initial concentration of reactants, the liquid phase composition, flow rate, resulting backpressure, and temperature. In addition, the HPSLC setup allows fully automated adjustments of flow rate and temperature over time. Also liquid-phase composition and type (as well as concentration) of reactants could be systematically varied, which altogether enables detailed and rapid screening of new catalysts and/or chemical reactions. The protocol for the catalytic testing in this work was run as follows. Solutions of BA (120 mmol L−1) and ECA (100 mmol L−1) in ethanol were mixed at a ratio of 50![[thin space (1/6-em)]](https://www.rsc.org/images/entities/char_2009.gif) :
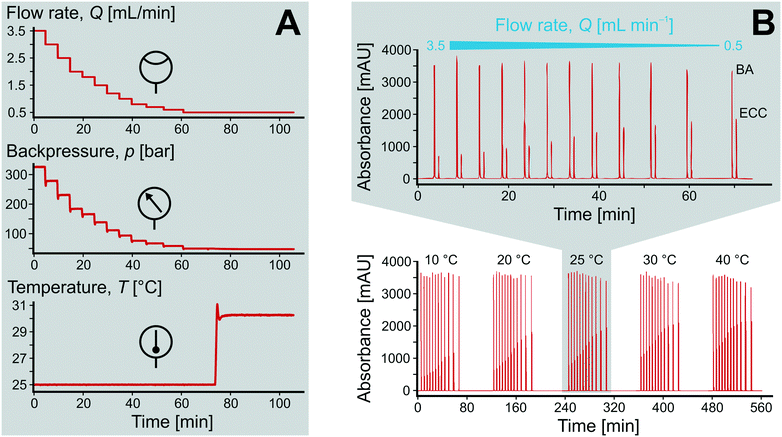
:![[thin space (1/6-em)]](https://www.rsc.org/images/entities/char_2009.gif) 50 (v/v), resulting in initial concentrations of c0(BA) = 60 mmol L−1 and c0(ECA) = 50 mmol L−1 at the inlet of the microreactor. Fig. 5A demonstrates the precise adjustment of volumetric flow rate Q and temperature T over time while recording resulting backpressure. The flow rate was usually varied between 0.5 and 3.5 mL min−1 (0.58–4.08 mm s−1) at a constant temperature, leading to system backpressures of up to p = 350 bar. Afterwards, the temperature was adjusted and the flow rate variation repeated.
50 (v/v), resulting in initial concentrations of c0(BA) = 60 mmol L−1 and c0(ECA) = 50 mmol L−1 at the inlet of the microreactor. Fig. 5A demonstrates the precise adjustment of volumetric flow rate Q and temperature T over time while recording resulting backpressure. The flow rate was usually varied between 0.5 and 3.5 mL min−1 (0.58–4.08 mm s−1) at a constant temperature, leading to system backpressures of up to p = 350 bar. Afterwards, the temperature was adjusted and the flow rate variation repeated.
The on-line coupled HPSLC–HPLC system and fully automated protocol for catalytic testing allows us to tightly and rapidly follow the performance of the microreactor (yield, conversion, productivity, catalyst activity). Combined with a high-performance (here, monolithic) support, which guarantees extremely low backmixing (narrow residence time distributions) and a high contact area the between flowing and stagnant fluids (high external surface area, cf.Fig. 1), as well as a large catalytically active surface, the intrinsic reaction kinetics (e.g., rate constants, reaction order, activation energy, side reactions) can be studied using a simple, reproducible, and fast procedure.
3. Results and discussion
3.1 Long-term stability of catalytic activity
The long-term stability of catalytic activity is an important issue in heterogeneous catalysis. To address this property, the HPSLC system containing the virgin APS monolith was programmed to operate with a constant flow rate (Q = 0.5 mL min−1, resulting in uav = 0.58 mm s−1 and p = 45.6 bar), temperature (T = 25 °C), and initial concentrations of BA and ECA (30 and 25 mmol L−1, respectively). Prior to that experiment, the microreactor was equilibrated with pure ethanol. For on-line HPLC analysis the samples were taken fully automated by switching the valve from load to inject. If the time between two data points exceeded 15 minutes, the flow in the HPLC dimension was stopped 7 minutes after the injection and started again 3 minutes before the next injection to reduce solvent waste.Yield of the Knoevenagel condensation was calculated as the ratio of the product concentration in the reaction solution, c(ECC) (directly determined from the obtained chromatograms in the HPLC dimension), and the initial concentration of the lowest-concentrated reactant, c0(ECA). Selectivity for this reaction is reported as >99%,33 in good agreement with the chromatograms (Fig. 5B), where the BA conversion closely matches the ECC yield. It should be noted that a concentration of 10 mmol L−1 of unconverted BA still remains in the reaction solution even at a maximum conversion of unity (cf. section 2.4). Therefore, we only refer to the conversion in the following, calculated according to:
 | (4) |
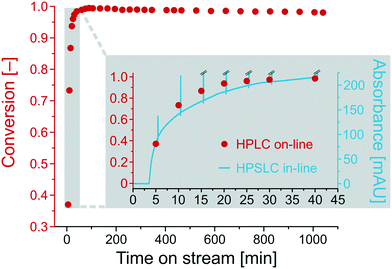
Fig. 6 shows the conversion for the base-catalyzed Knoevenagel condensation as a function of the time on stream. After a run-in period of about half an hour (inset in Fig. 6), the conversion becomes constant at 0.99 and remains nearly unchanged, resulting in a final conversion of 0.98 after ∼18 hours (1040 min). To compare the in-line (HPSLC) and second-dimension on-line (HPLC) analysis, the run-in period was monitored with both detection methods. Since absorption bands overlap at wavelengths of maximum absorption (UV/VIS spectra of BA and ECC in Fig. S2†), the in-line (HPSLC) UV/VIS-diode array detector could not record informative chromatograms at these wavelengths. Therefore, the in-line detector continuously measured the absorbance of the reaction solution at 360 nm, where only ECC shows a residual absorbance that can be related to ECC concentration in the reaction solution.
The ECC absorbance at 360 nm in the HPSLC in-line UV/VIS-diode array detector (blue line, Fig. 6) matches the course of conversion determined by on-line HPLC (red points, Fig. 6). The blue spikes are attributed to switching back the valve into the load position, which results in the injection of a water/ethanol plug in the HPSLC detector. The in-line chromatogram should only be consulted to detect qualitative compositional changes in the reaction solution. Extracting quantitative information is not possible, because signal intensity at the selected wavelength (360 nm) behaves non-linearly with ECC concentration. Nevertheless, the in-line HPSLC detection offers the advantage over on-line HPLC analysis of high temporal resolution and corresponding data acquisition rate (here, 10 s−1). It provides more accurate insight into the chronology of the ongoing processes in the microreactor, e.g., on how long it takes to approach steady state after changing a specific reaction parameter.
3.2 Reaction parameters and high-resolution reaction time control
Upon changing volumetric flow rate, it takes the monolithic microreactor only one space time (time to process one reactor void volume) to operate close to steady-state again, as verified by in-line detection. In contrast, cooling of the system takes relatively long (∼20 min), so that the system was typically operated with ascending temperatures. Working at high flow rates reduced the time to steady-state so much that HPLC analysis became the slowest step in the system (5 min per chromatogram). Fig. 5A illustrates not only the tight control and precise adjustment of key reaction parameters, but also highlights how quickly the HPSLC system responded to changes in flow rate and temperature. When the microreactor reached steady-state, the injection valve was switched automatically (accounting for the pressure-spikes in Fig. 5A). In the HPLC dimension, comprehensive sets of chromatographic data were acquired (as shown in Fig. 5B). They consisted of many individual chromatograms containing one BA and one ECC signal (Fig. S1†). Consequently, each pair of peaks can be related to one specific set of reaction parameters, i.e., initial concentration c0, temperature T, and volumetric flow rate Q. Chromatograms were recorded at the ECC calibration wavelength of 250 nm, where BA shows maximum absorption in contrast to ECC (Fig. S2 and S3†). The wealth of information that can be extracted from this single data set (spending 560 minutes for fully automated measurements, Fig. 5B) is discussed in the following sections.Accurate knowledge of the reaction time (trct) is important in the investigation of kinetics and intrinsic reaction parameters. To apply the concept of high-resolution reaction time control (cf.Fig. 2) to the presented HPSLC system, control experiments with a morphologically similar but unfunctionalized monolith (bare silica surface only) were first performed. These demonstrated that the Knoevenagel condensation between BA and ECA did not show any conversion without the basic catalyst. Thus, residence time tres of a reactant molecule on the HPSLC microreactor is equal to its reaction time trct. Employed high-performance monolithic supports exhibit small flow-channel sizes Lflow, a radially homogenous distribution of macroporosity εmacro, and also a very little short-range variation in Lflow.20,32,60 In combination with a large external surface area Aext and small skeleton thickness Ldiff, residence time distributions become so narrow that ideal plug-flow behavior is achieved. This can be illustrated using typical Bodenstein numbers (Bo) characterizing reactor-based liquid-phase transport by flow relative to hydrodynamic dispersion occurring simultaneously along the macroscopic flow direction:68,69
 | (5) |
The reaction time trct was therefore expressed by the mean residence time, based on the reactor void volume (itself calculated by the empty-reactor volume Vreactor and total fixed-bed porosity εtotal) and the volumetric flow rate Q:
 | (6) |
To conclude, trct only depends on Q, which can be very precisely controlled and adjusted. The resulting high-resolution reaction time control allows to assign conversion to reaction time and, as a consequence, to analyze multiple reaction times rapidly and fully automated in a single flow experiment. Kinetic data are recorded with the microreactor operating in steady state, which is in contrast to concepts like the “push-out” method (using flow-rate ramps or step-changes), where data points between two steady states are recorded and mathematical models have to be applied for kinetic interpretation.24,26,70
3.3 Conversion and productivity
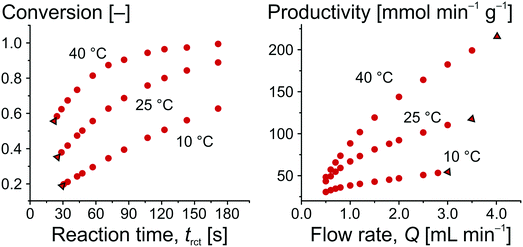
Before moving our focus towards detailed kinetic investigations, we quantify the performance of the microreactor in terms of conversion and productivity at three different temperatures (10, 25, and 40 °C). Isothermal operation of the microreactor could be assumed due to the low concentrations of the reactant solutions (a more detailed discussion can be found in the ESI†). The conversion for the Knoevenagel condensation was calculated according to eqn (4), whereas the productivity is based on the amount of ECC produced per time and mass of catalyst (mcat): | (7) |
The amount of ECC produced per time is expressed by c(ECC) (directly determined by on-line HPLC) and Q (automatically varied and controlled by the pumping system). mcat was calculated by the volume of the solid phase in the whole reactor Vsolid and the density of silica (δcat = 2.12 g cm−3),71 resulting in mcat = 0.49 g. The ECC produced per time could also be related to parameters other than mcat, such as the amount of catalytically active groups on the surface (turnover frequency, TOF), for which further information is available in the ESI.†Fig. 7 illustrates the obtained relationships for conversion as a function of reaction time and for productivity as a function of adjusted flow rate. For the same temperature, the data in Fig. 7 can be interconverted using eqn (4), (6), and (7), as illustrated with the data points framed by the black triangles. It is straightforward to see that an increased conversion (from left to right in the conversion plot) can only be achieved at the compromise of lower productivity (from right to left in the productivity plot). Working at higher temperature increases the conversion at constant flow rate and, simultaneously, improves the productivity of the microreactor.
3.4 Reaction order and mechanism
For kinetic investigations, it is important to know the reaction order that is associated with the reaction mechanism. The mechanistic details of the APS-catalyzed Knoevenagel condensation (Scheme 2) have been proposed by Laspéras et al.72 and experimentally proven using ATR-IR spectroscopy by Baiker and co-workers.50 In a first step, BA reacts reversibly with aminopropyl groups at the surface, yielding a benzaldimine species that shows a higher basicity than the free amino-group.72,73 In the second step, the activated methylene group of ECA is deprotonated by the benzaldimine species and the condensation product ECC is formed.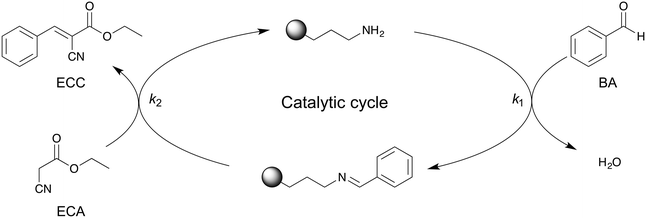 | ||
| Scheme 2 Proposed reaction mechanism for amine-catalyzed Knoevenagel condensation between BA and ECA to ECC.50,72 BA first reacts with the aminpropyl active sites of the APS surface, resulting in a benzaldimine species on the surface. After reaction with ECA, ECC is obtained and the APS surface recovered. | ||
To identify the rate-determining step of this mechanism, the initial reaction rate was studied in dependence of the initial BA concentration, c0(BA). The reaction rate ν can be expressed by the change of the ECC concentration with the reaction time trct:
 | (8) |
ln![[thin space (1/6-em)]](https://www.rsc.org/images/entities/char_2009.gif) v = ln v = ln![[thin space (1/6-em)]](https://www.rsc.org/images/entities/char_2009.gif) k2 + n ln k2 + n ln![[thin space (1/6-em)]](https://www.rsc.org/images/entities/char_2009.gif) ct(ECA) ct(ECA) | (9) |
Based on the data set in Fig. 5B, the reaction rate ν was calculated by plotting ct(ECC) against trct and subsequent differentiation. Then, the logarithmic reaction rate ν was plotted as a function of ct(ECC) to obtain the reaction order n with respect to ECA from the linear slope (Fig. 8). As a result, the APS-catalyzed Knoevenagel reaction of BA and ECA shows a zero-order kinetics with respect to BA (m = 0) and a first-order kinetics with respect to ECA (n = 1), resulting in an overall reaction order of unity.
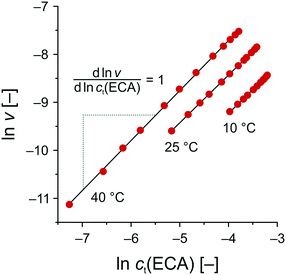 | ||
| Fig. 8 Determination of the reaction order with respect to ECA (cf. second step in Scheme 2) by means of eqn (9). T = 10 °C: slope = 0.985 (R2 = 0.9990); T = 25 °C: slope = 0.995 (R2 = 0.9999); and T = 40 °C: slope = 1.042 (R2 = 0.9995). | ||
3.5 Intraskeleton mass transfer
After convenient determination of the reaction order, the next step was to investigate intrinsic reaction parameters (e.g., rate coefficient k2, activation energy Ea) by treating the experimental data (Fig. 5B) as if they were recorded in batch mode (see previous discussion in section 3.2). In this respect, it is important that the catalytic data are free from all transport influences.74 This should be the case with the high-performance monoliths used in this work, as discussed already in section 1. For the Knoevenagel reaction occurring at the internal surface of the mesoporous skeleton of the APS monolith, the most relevant transport influence is reflected by the effective intraskeleton diffusion coefficient Deff, particularly, because the diffusion coefficients in liquids are about four orders of magnitude lower than in the gas phase.The relationship between the effectiveness factor η and the Thiele modulus Φ is well established for the investigation of internal transport limitations.74,75 The Thiele modulus accounts for the competition between the Knoevenagel reaction at the APS surface (represented by k2) and the limitation of transport of the reactant ECA by diffusion in the mesoporous skeleton of the monolith (represented by Deff):
 | (10) |
The characteristic diffusion length L is generally defined as the volume-to-surface ratio of the spatial domain, in which diffusion (and reaction) take place. The effectiveness factor compares the observed reaction rate coefficient in the microreactor with the intrinsic rate coefficient in the absence of any diffusive resistance and, consequently, describes how effectively the catalyst structure is used. While the η–Φ relationship is well-known for classical particulate geometries (sphere, slab, cylinder),75 we use physical reconstructions of the employed silica monoliths55 to determine Lskel in eqn (10) based on the ratio of Vskel (volume of the silica skeleton, including the mesopores) and its external surface area Aext. On that basis, we receive a very small value of Lskel = Vskel/Aext = 0.22 μm. Further, the value of Deff for ECA (in eqn (10)) was estimated by its molecular diffusion coefficient Dm in bulk solution and from the porosity and tortuosity of the mesoporous monolith skeleton according to:
 | (11) |
While the intraskeleton porosity εmeso and tortuosity τmeso for the employed silica monoliths are already known and included in Table 1,57 the value of Dm was estimated using the Wilke–Chang equation applied to ECA in pure ethanol. Further information and detailed calculations can be found in the ESI.†
With the experimentally determined k2-values and estimated diffusion coefficients Deff in the temperature range of T = 10–40 °C, the Thiele moduli for this specific reaction setup could be calculated. Fig. 9 compares the effectiveness factor–Thiele modulus relationship for slab and sphere geometry with data from the high-performance monolith. For the Knoevenagel reaction run on the APS monolith, the calculated values clearly imply operation under exclusive reaction control (gray-shaded region in Fig. 9). In this region, the geometry of the support does not play any role and the catalyst is utilized at highest effectiveness (η = 1).
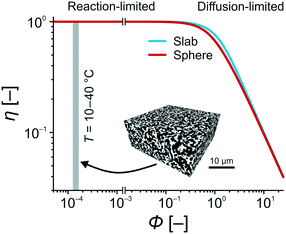 | ||
| Fig. 9 Effectiveness factor η for sphere and slab catalyst particle geometries as a function of the Thiele modulus Φ.75 For the APS-catalyzed Knoevenagel condensation between BA and ECA in the temperature range of T = 10–40 °C, the silica-based monolith used as catalyst support provides Thiele moduli of Φ = 1.25–1.65 × 10⁻³. Details for the calculation of these Φ-values (cf.eqn (10)) can be found in the ESI.† | ||
These results demonstrate that diffusive mass transport influences are completely absent in this microreactor. It allows to investigate the intrinsic reaction parameters in the described manner and, therefore, lays the foundation for a rapid catalyst screening and the systematic optimization of reaction conditions. In industry, Thiele moduli between pure reaction and diffusion controls (Φ = 0.2–1.2) are preferred,76 because reaction and diffusion rates are balanced and the catalytic system performs most efficiently in terms of cost and benefit. However, the essence of our work was the investigation of intrinsic kinetic and catalytic properties of reactions, which are relevant to lab-scale research in industry and academia, especially due to the simple, robust experimental setup using commercial HPLC devices. With the here achieved Thiele moduli, concentration gradients over the catalyst structure are virtually absent.77 Combined with the ideal plug-flow behavior, reaction conditions are uniform over the entire cross-section of the microreactor. This situation resembles quasi-homogeneous catalysis, where all active sites are instantly and always accessible. In the next section, this point will receive further support, when the activation energy of the Knoevenagel reaction is determined and compared with values for homogeneously and heterogeneously catalyzed reactions from the literature.
3.6 Arrhenius-plot
After advancing from mean residence time to reaction time and demonstrating the absence of transport limitations in the monolith, we now investigate intrinsic kinetic and catalytic reaction parameters. The activation energy Ea of the Knoevenagel reaction (second step in Scheme 2, characterized by the reaction rate coefficient k2) was analyzed with the Arrhenius equation | (12) |
Fig. 10 shows the Arrhenius plot for the Knoevenagel reaction in the solid–liquid system of this work, which results in an activation energy of Ea = 30.4 kJ mol−1. To discuss this value in the context of literature data, it should be recalled that Ea strongly depends on solvent, reaction mechanism, and cooperative effects of the support.79–81 Besides a primary-amine mechanism (PA), reaction can also follow a cooperative ion-pair mechanism (IP), in the absence of primary amines, via deprotonation of the CH-acidic ECA in the first step.81 Already reported activation energies for the Knoevenagel condensation between BA and ECA were all determined in batch mode and are summarized in Table 2.
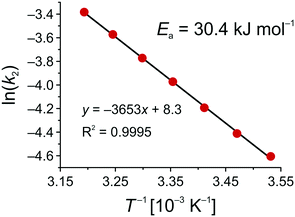 | ||
| Fig. 10 Arrhenius plot for the base-catalyzed Knoevenagel condensation between BA and ECA in ethanol using an APS monolith (cf.Scheme 2 and eqn (12)). | ||
| Heterogeneous catalysis | |||||
|---|---|---|---|---|---|
| Support | Catalytic center | Solvent | Mechanism | E a [kJ mol−1] | Reference |
| a PA: Primary-amine-catalyzed reaction mechanism; b IP: Ion-pair reaction mechanism; c LDH: Layered double hydroxides. | |||||
| Hierarchical silica | –NH2 | Ethanol | PAa | 30.4 | This work |
| magMCM-41 | –NH2 | None | PA | 47.7 | 82 |
| SBA-15 | –NH2 | Toluene | PA | 61.2 | 81 |
| X zeolite | Li, Na, K, Cs | None | IPb | 27–40 | 83 |
| Y zeolite | Li, Na, K, Cs | None | IP | 49–61 | 83 |
| LDHc | [PW12O40]3– | 2-Propanol/water (2![[thin space (1/6-em)]](https://www.rsc.org/images/entities/char_2009.gif) : :![[thin space (1/6-em)]](https://www.rsc.org/images/entities/char_2009.gif) 1) 1) |
IP | 33.3 | 84 |
For both mechanistic pathways, catalytic activation energies fall into similar ranges. Although conclusions can hardly be drawn from a comparison between different reaction systems, it can be recognized that the activation energy of this work is at the lower edge of the heterogeneously catalyzed reactions, even reflecting homogeneous catalysis. This is underlined by a comparison with the data reported by Hruby and Shanks.81 We found only half the activation energy of their heterogeneously catalyzed reaction employing SBA-15 (Ea = 61.2 kJ mol−1, Table 2). While the activation energy of their homogeneously catalyzed reaction (Ea = 25.3 kJ mol−1) is just slightly smaller than our activation energy, the value for their homogeneous catalysis combined with an acid–base cooperativity by adding unfunctionalized SBA-15 (Ea = 32.1 kJ mol−1) is even closer to ours. It again suggests an instant availability of the large active surface area of the monolithic microreactor (∼250 m2 g−1) presented in this work, as if all the catalytic centers could freely move in solution, thereby reflecting quasi-homogeneous catalytic processing.
4. Conclusions
Flow chemistry instrumentation was implemented to continuously process an aminopropylated silica-based microreactor (4.6 mm inner diameter × 100 mm length) up to backpressures of 350 bar in high-pressure solid–liquid catalysis (HPSLC). The morphology of the monolith used as hierarchical high-performance support has been adjusted (Lflow = 1.15 μm, Ldiff = 0.22 μm) such that both external and internal transport limitations were absent. The extremely low backmixing and high contact area between flowing and stagnant fluids, i.e., the high external surface area, allowed to transform the space positions on the continuous-flow microreactor into a series of batch experiments with corresponding reaction times. The presented two-dimensional HPSLC–HPLC equipment enabled direct analysis and quantification of reactants and products, resulting in a tight on-line monitoring of reactor performance. Furthermore, the intrinsic reaction kinetics and catalytic parameters could be investigated rapidly and fully automated. Our results reveal an instantly available catalytically active surface in the reactor (realizing a quasi-homogeneous catalysis) due to the high-performance support structure. The presented microreaction system can conveniently and comprehensively provide parameters of the intrinsic reaction kinetics on lab-scale, for example, to construct kinetic models for scale-up of reaction processes in research and development.References
- J. Yoshida, Y. Takahashi and A. Nagaki, Chem. Commun., 2013, 49, 9896–9904 RSC.
- I. Atodiresei, C. Vila and M. Rueping, ACS Catal., 2015, 5, 1972–1985 CrossRef CAS.
- B. Gutmann, D. Cantillo and C. O. Kappe, Angew. Chem., Int. Ed., 2015, 54, 6688–6728 CrossRef CAS PubMed.
- D. E. Fitzpatrick, C. Battilocchio and S. V. Ley, ACS Cent. Sci., 2016, 2, 131–138 CrossRef CAS PubMed.
- K. Pangarkar, T. J. Schildhauer, J. R. van Ommen, J. Nijenhuis, F. Kapteijn and J. A. Moulijn, Ind. Eng. Chem. Res., 2008, 47, 3720–3751 CrossRef CAS.
- A. Sachse, A. Galarneau, B. Coq and F. Fajula, New J. Chem., 2011, 35, 259–264 RSC.
- J. A. Moulijn, M. T. Kreutzer, T. A. Nijhuis and F. Kapteijn, Adv. Catal., 2011, 54, 249–327 CAS.
- E. B. Anderson and M. R. Buchmeiser, ChemCatChem, 2012, 4, 30–44 CrossRef CAS.
- W. Schwieger, A. G. Machoke, T. Weissenberger, A. Inayat, T. Selvam, M. Klumpp and A. Inayat, Chem. Soc. Rev., 2016, 45, 3353–3376 RSC.
- U. Tallarek, F. C. Leinweber and A. Seidel-Morgenstern, Chem. Eng. Technol., 2002, 25, 1177–1181 CrossRef CAS.
- E. Tronconi, G. Groppi and C. G. Visconti, Curr. Opin. Chem. Eng., 2014, 5, 55–67 CrossRef.
- Z. Ren, Y. Guo and P. X. Gao, Catal. Today, 2015, 258, 441–453 CrossRef CAS.
- M. T. Kreutzer, F. Kapteijn, J. A. Moulijn and J. J. Heiszwolf, Chem. Eng. Sci., 2005, 60, 5895–5916 CrossRef CAS.
- C. G. Frost and L. Mutton, Green Chem., 2010, 12, 1687–1703 RSC.
- J. Wegner, S. Ceylan and A. Kirschning, Adv. Synth. Catal., 2012, 354, 17–57 CrossRef CAS.
- R. Munirathinam, J. Huskens and W. Verboom, Adv. Synth. Catal., 2015, 357, 1093–1123 CrossRef CAS.
- A. Galarneau, A. Sachse, B. Said, C. H. Pelisson, P. Boscaro, N. Brun, L. Courtheoux, N. Olivi-Tran, B. Coasne and F. Fajula, C. R. Chimie, 2016, 19, 231–247 CrossRef CAS.
- M. Movsisyan, E. I. P. Delbeke, J. K. E. T. Berton, C. Battilocchio, S. V. Ley and C. V. Stevens, Chem. Soc. Rev., 2016, 45, 4892–4928 RSC.
- R. Greco, L. Caciolli, A. Zaghi, O. Pandoli, O. Bortolini, A. Cavazzini, C. De Risi and A. Massi, React. Chem. Eng., 2016, 1, 183–193 CAS.
- D. Enke, R. Gläser and U. Tallarek, Chem. Ing. Tech., 2016, 88, 1561–1585 CrossRef CAS.
- X. Liu, B. Ünal and K. F. Jensen, Catal. Sci. Technol., 2012, 2, 2134–2138 CAS.
- S. B. Ötvös, A. Szloszár, I. M. Mándity and F. Fülöp, Adv. Synth. Catal., 2015, 357, 3671–3680 CrossRef.
- C. Sievers, Y. Noda, L. Qi, E. M. Albuquerque, R. M. Rioux and S. L. Scott, ACS Catal., 2016, 6, 8286–8307 CrossRef CAS.
- J. S. Moore and K. F. Jensen, Angew. Chem., Int. Ed., 2014, 53, 470–473 CrossRef CAS PubMed.
- I. M. Mándity, S. B. Ötvös and F. Fülöp, ChemistryOpen, 2015, 4, 212–223 CrossRef PubMed.
- T. Durand, C. Henry, D. Bolien, D. C. Harrowven, S. Bloodworth, X. Franck and R. J. Whitby, React. Chem. Eng., 2016, 1, 82–89 CAS.
- H. Fang, Q. Xiao, F. Wu, P. E. Floreancig and S. G. Weber, J. Org. Chem., 2010, 75, 5619–5626 CrossRef CAS PubMed.
- N. Holmes, G. R. Akien, A. J. Blacker, R. L. Woodward, R. E. Meadows and R. A. Bourne, React. Chem. Eng., 2016, 1, 366–371 CAS.
- G. Eigenberger and W. Ruppel, Catalytic Fixed-Bed Reactors, in Ullmann's Encyclopedia of Industrial Chemistry, Wiley–VCH, Weinheim, Germany, 2012 Search PubMed.
- G. Guiochon, J. Chromatogr. A, 2007, 1168, 101–168 CrossRef CAS PubMed.
- Monolithic Silicas in Separation Science: Concepts, Syntheses, Characterization, Modeling and Applications, ed. K. K. Unger, N. Tanaka and E. Machtejevas, Wiley–VCH, Weinheim, Germany, 2011 Search PubMed.
- K. Hormann, T. Müllner, S. Bruns, A. Höltzel and U. Tallarek, J. Chromatogr. A, 2012, 1222, 46–58 CrossRef CAS PubMed.
- A. El Kadib, R. Chimenton, A. Sachse, F. Fajula, A. Galarneau and B. Coq, Angew. Chem., Int. Ed., 2009, 48, 4969–4972 CrossRef CAS PubMed.
- A. Sachse, V. Hulea, A. Finiels, B. Coq, F. Fajula and A. Galarneau, J. Catal., 2012, 287, 62–67 CrossRef.
- A. Sachse, N. Linares, P. Barbaro, F. Fajula and A. Galarneau, Dalton Trans., 2013, 42, 1378–1384 RSC.
- C. Capello, U. Fischer and K. Hungerbühler, Green Chem., 2007, 9, 927–934 RSC.
- F. Bigi and C. Quarantelli, Curr. Org. Chem., 2012, 9, 31–39 CAS.
- Y. Gu, Green Chem., 2012, 14, 2091–2128 RSC.
- L. F. Tietze, Chem. Rev., 1996, 96, 115–136 CrossRef CAS PubMed.
- R. H. Vekariya and H. D. Patel, Synth. Commun., 2014, 44, 2756–2788 CrossRef CAS.
- H. Hattori, Chem. Rev., 1995, 95, 537–558 CrossRef CAS; A. Corma, S. Iborra, I. Rodríguez and F. Sánchez, J. Catal., 2002, 211, 208–215 Search PubMed; K. H. Isobe, T. Suzuki and H. Hagiwara, Mol. Diversity, 2005, 9, 317–320 CrossRef PubMed; T. C. Keller, S. Isabettini, D. Verboekend, E. G. Rodrigues and J. Pérez-Ramírez, Chem. Sci., 2014, 5, 677–684 RSC; A. H. Chughtai, N. Ahmad, H. A. Younus, A. Laypkovc and F. Verpoort, Chem. Soc. Rev., 2015, 44, 6804–6849 RSC.
- C. Rodríguez-Escrich and M. A. Pericás, Eur. J. Org. Chem., 2015, 1173–1188 CrossRef.
- R. Porta, M. Benaglia and A. Puglisi, Org. Process Res. Dev., 2016, 20, 2–25 CrossRef CAS.
- M. Ferré, R. Pleixats, M. Wong Chi Man and X. Cattoën, Green Chem., 2016, 18, 881–922 RSC.
- E. Angeletti, C. Canepa, G. Martinetti and P. Venturello, Tetrahedron Lett., 1988, 29, 2261–2264 CrossRef CAS.
- E. Angeletti, C. Canepa, G. Martinetti and P. Venturello, J. Chem. Soc., Perkin Trans. 1, 1989, 105–107 RSC.
- S. M. Lai, C. P. Ng, R. Martin-Aranda and K. L. Yeung, Microporous Mesoporous Mater., 2003, 66, 239–252 CrossRef CAS.
- X. Zhang, E. S. M. Lai, R. Martin-Aranda and K. L. Yeung, Appl. Catal., A, 2004, 261, 109–118 CrossRef CAS.
- T. Jackson, J. H. Clark, D. J. Macquarrie and J. H. Brophy, Green Chem., 2004, 6, 193–195 RSC.
- R. Wirz, D. Ferri and A. Baiker, Langmuir, 2006, 22, 3698–3706 CrossRef CAS PubMed.
- A. R. Bogdan, B. P. Mason, K. T. Sylvester and D. T. McQuade, Angew. Chem., Int. Ed., 2007, 46, 1698–1701 CrossRef CAS PubMed.
- A. Sachse, A. Galarneau, F. Di Renzo, F. Fajula and B. Coq, Chem. Mater., 2010, 22, 4123–4125 CrossRef CAS.
- W. Song, D. Shi, S. Tao, Z. Li, Y. Wang, Y. Yu, J. Qiu, M. Ji and X. Wang, J. Colloid Interface Sci., 2016, 481, 100–106 CrossRef CAS PubMed.
- S. Altmaier and K. Cabrera, J. Sep. Sci., 2008, 31, 2551–2559 CrossRef CAS PubMed.
- D. Hlushkou, K. Hormann, A. Höltzel, S. Khirevich, A. Seidel-Morgenstern and U. Tallarek, J. Chromatogr. A, 2013, 1303, 28–38 CrossRef CAS PubMed.
- K. Hormann and U. Tallarek, J. Chromatogr. A, 2013, 1312, 26–36 CrossRef CAS PubMed.
- K. Hormann and U. Tallarek, J. Chromatogr. A, 2014, 1365, 94–105 CrossRef CAS PubMed.
- D. Stoeckel, C. Kübel, K. Hormann, A. Höltzel, B. M. Smarsly and U. Tallarek, Langmuir, 2014, 30, 9022–9027 CrossRef CAS PubMed.
- D. Stoeckel, C. Kübel, M. O. Loeh, B. M. Smarsly and U. Tallarek, Langmuir, 2015, 31, 7391–7400 CrossRef CAS PubMed.
- K. Hormann, V. Baranau, D. Hlushkou, A. Höltzel and U. Tallarek, New J. Chem., 2016, 40, 4187–4199 RSC.
- A. Feinle, M. S. Elsaesser and N. Huesing, Chem. Soc. Rev., 2016, 45, 3377–3399 RSC.
- A. Inayat, B. Reinhardt, J. Herwig, C. Küster, H. Uhlig, S. Krenkel, E. Raedlein and D. Enke, New J. Chem., 2016, 40, 4095–4114 RSC.
- K. Nakanishi and N. Tanaka, Acc. Chem. Res., 2007, 40, 863–873 CrossRef CAS PubMed.
- T. G. Waddell, D. E. Leyden and M. T. DeBello, J. Am. Chem. Soc., 1981, 103, 5303–5307 CrossRef CAS.
- K. C. Vrancken, K. Possemiers, P. van der Voort and E. F. Vansant, Colloids Surf., A, 1995, 98, 235–241 CrossRef CAS.
- D. Hlushkou and U. Tallarek, J. Chromatogr. A, 2006, 1126, 70–85 CrossRef CAS PubMed.
- G. S. Scatena, A. F. de la Torre, Q. B. Cass, D. G. Rivera and M. W. Paixão, ChemCatChem, 2014, 6, 3208–3214 CrossRef CAS.
- H. S. Fogler, Elements of Chemical Reaction Engineering, Prentice Hall, Upper Saddle River, NJ, 2006, 4th edn., Chapter 14.4.1 Search PubMed.
- R. L. Hartman, J. P. McMullen and K. F. Jensen, Angew. Chem., Int. Ed., 2011, 50, 7502–7519 CrossRef CAS PubMed.
- S. Mozharov, A. Norden, D. Littlejohn, C. Wiles, P. Watts, P. Dallin and J. M. Girkin, J. Am. Chem. Soc., 2011, 133, 3601–3608 CrossRef CAS PubMed.
- F. Gritti and G. Guiochon, Chem. Eng. Sci., 2006, 61, 7636–7650 CrossRef CAS.
- M. Laspéras, T. Llorett, L. Chaves, I. Rodriguez, A. Cauvel and D. Brunel, Stud. Surf. Sci. Catal., 1997, 108, 75–82 CrossRef.
- K. A. Utting and D. J. Macquarrie, New J. Chem., 2000, 24, 591–595 RSC.
- R. J. Madon and M. Boudart, Ind. Eng. Chem. Fundam., 1982, 21, 438–447 CAS.
- M. E. Davis and R. J. Davis, Fundamentals of Chemical Reaction Engineering, McGraw-Hill, New York, NY, 2003, Chapter 6.3 Search PubMed.
- V. Hlaváček, M. Kubíček and M. Marek, J. Catal., 1969, 15, 17–30 CrossRef.
- J. Pérez-Ramírez, C. H. Christensen, K. Egeblad, C. H. Christensen and J. C. Groen, Chem. Soc. Rev., 2008, 37, 2530–2542 RSC.
- F. Trachsel, C. Hutter and P. R. von Rohr, Chem. Eng. J., 2008, 135S, S309–S316 CrossRef.
- I. Rodriguez, G. Sastre, A. Corma and S. Iborra, J. Catal., 1999, 183, 14–23 CrossRef CAS.
- J. D. Bass, A. Solovyov, A. J. Pascall and A. Katz, J. Am. Chem. Soc., 2006, 128, 3737–3747 CrossRef CAS PubMed.
- S. L. Hruby and B. H. Shanks, J. Catal., 2009, 263, 181–188 CrossRef CAS.
- X. Chen, M. Arruebo and K. L. Yeung, Catal. Today, 2013, 204, 140–147 CrossRef CAS.
- A. Corma, V. Fornés, R. M. Martín-Aranda, H. Gracía and J. Primo, Appl. Catal., 1990, 59, 237–248 CrossRef CAS.
- Y. Jia, Y. Fang, Y. Zhang, H. N. Miras and Y. Song, Chem. – Eur. J., 2015, 21, 14862–14870 CrossRef CAS PubMed.
Footnote |
| † Electronic supplementary information (ESI) available. See DOI: 10.1039/c7re00042a |
| This journal is © The Royal Society of Chemistry 2017 |

